")
Back to Journals » Journal of Inflammation Research » Volume 18
LT-α Facilitates the Aerobic Glycolysis and M1 Polarization of Macrophages by Activating the NF-κB Signaling Pathway in Intervertebral Disc Degeneration
Authors Qiu C, Guo Z, Yuan J , Xiang H, Chen B, Yi Y, Zhao Y
Received 12 November 2024
Accepted for publication 4 March 2025
Published 19 March 2025 Volume 2025:18 Pages 4103—4120
DOI https://doi.org/10.2147/JIR.S506162
Checked for plagiarism Yes
Review by Single anonymous peer review
Peer reviewer comments 3
Editor who approved publication: Professor Ning Quan
Chensheng Qiu,1– 3 Zhu Guo,4 Junhua Yuan,5 Hongfei Xiang,4 Bohua Chen,4 Yuanxue Yi,2 Yongsheng Zhao1
1Department of Spinal Surgery, Qingdao Municipal Hospital, Qingdao, 266011, People’s Republic of China; 2Department of Laboratory Medicine, Chongqing Precision Medical Industry Technology Research Institute, Chongqing, 400000, People’s Republic of China; 3Key Laboratory of Clinical Laboratory Diagnostics (Chinese Ministry of Education), College of Laboratory Medicine, Chongqing Medical University, Chongqing, 400016, People’s Republic of China; 4Department of Spinal Surgery, Affiliated Hospital of Qingdao University, Qingdao, 266003, People’s Republic of China; 5Department of Special Medicine, School of Basic Medicine, Qingdao University, Qingdao, 266021, People’s Republic of China
Correspondence: Yongsheng Zhao; Yuanxue Yi, Email [email protected]; [email protected]
Purpose: Injury and inflammatory activate and polarize macrophages in intervertebral disc degeneration (IVDD). Further research needs to be carried to explore the mechanisms that regulate macrophage polarization, providing new insights and targets for IVDD treatment. The aim of our study was to evaluate the influence of LT-α on aerobic glycolysis (AG) and polarization in macrophages.
Methods: M0 macrophages were achieved by stimulating THP-1 cells with PMA. M1 macrophages were obtained by IFN-γ and LPS stimulation in M0 macrophages. Energy metabolomics, AG and apoptosis related protein expression, migration and invasion measurement, proliferation was analyzed. Polarization of macrophages, AG associated genes expression, macrophage recruitment was evaluated. NF-κB signaling was ascertained by laser confocal and Western blotting.
Results: The propanoate metabolism pathway was enriched in LT-α overexpressing M0 macrophages, and various energy metabolites were detected. Glucose absorption, lactic acid production, and levels of AG proteins were strikingly increased in LT-α overexpression macrophages and remarkably repressed in LT-α knockdown macrophages, accompanied by activated and inactivated NF-κB signaling, respectively. Suppressed migration and invasion ability, restrained proliferation, activated AG, and enhanced apoptosis were observed in nucleus pulposus (NP) cells treated by LT-α overexpressed macrophages, accompanied by reduced macrophage recruitment, with opposite results when treated by LT-α knockdown macrophages. The enhanced M1 polarization and activated AG in LT-α overexpression macrophages were abolished by co-culturing with NF-κB inhibitor.
Conclusion: LT-α facilitates the AG and M1 polarization of macrophages via activating the NF-κB signaling pathway.
Keywords: LT-α, macrophage polarization, aerobic glycolysis, nucleus pulposus cells, NF-κB signaling pathway
Introduction
Degenerative disc disease (DDD), associated with chronic low back pain and sciatica, severely affects the quality of people’s life.1 With the exacerbation of the aging population trend, the incidence of DDD is gradually increasing. According to epidemiological studies, DDD mainly occurs in the middle-aged and elderly population, especially those over 40 years old.2 Intervertebral disc degeneration (IVDD), a natural progression of the aging process, is the most important pathological basis of DDD.3 Currently, the treatment of IVDD mainly focuses on relieving symptoms, such as medication and physical therapy. However, these treatment methods cannot effectively reverse the progression of IVDD.4,5 By in-depth research on the pathological mechanisms of IVDD, new treatment targets can be sought, providing scientific basis for clinical diagnosis and treatment, and offering new ideas and approaches for finding novel treatment methods.
Macrophages are an important cell type in the immune system, playing a crucial role in inflammation and tissue repair processes.6 During the process of IVDD, injury and inflammatory stimuli can activate and polarize macrophages.7 It has been found that during IVDD, the number and activity of M1 macrophages significantly increase, and the released inflammatory factors exacerbate the inflammatory response and cell damage in intervertebral disc tissues.7 Moreover, the conditioned media of M1 macrophage could exacerbate nucleus pulposus cells proliferation suppression and IVDD, but the conditioned media of M2 macrophage could attenuate IVDD development in a rat IVDD model.8 The increase in the number and activity of M1 macrophages aggravates the inflammatory response and cell damage in intervertebral disc tissue, underscoring the critical role of macrophage polarization in the progression of IVDD. In a word, more research needs to be carried to explore the mechanisms that regulate macrophage polarization, providing new insights and targets for IVDD treatment. Aerobic glycolysis (AG) is a cellular energy metabolism pathway, mainly producing energy through glucose metabolism.9 AG in macrophages is reported to be correlated to the M1/M2 polarization. When macrophages polarize into M1 type, AG is activated. M1 macrophages mainly rely on the energy generated by AG to meet the energy requirements for their pro-inflammatory and cytotoxic responses.10 On the contrary, inhibiting AG can suppress macrophage M1 polarization while promoting macrophage M2 polarization.11 Therefore, regulating AG to control macrophage M1/M2 polarization may become an important direction for treating IVDD.
Lymphotoxin-α (LT-α, also know as tumor necrosis factor (TNF)-β) is a cytokine, belonging to one of the members of the TNF family, which is produced by activated immune cells such as lymphocytes and macrophages, and participates in various physiological and pathological processes.12,13 LT-α plays a key regulatory role in the immune system, participating in the formation and maintenance of lymphoid tissues, promoting the development and structural stability of lymph nodes.14 Additionally, LT-α is closely related to immune inflammatory related diseases, such as rheumatoid arthritis (RA) and graft-versus-host disease (GVHD).15 During inflammation, LT-α binds to its receptor and regulates the proliferation, migration, and release of inflammatory factors in inflammatory cells by activating multiple signaling pathways.16 A previous study revealed that mouse bone marrow-derived M1 macrophages expressed high levels of membrane-bound LT-α to trigger expression of the chemokines CCL19, CCL20, and CXCL16.17 Importantly, our previous study found that the levels of both the mRNA and protein of LT-α in human degenerated nucleus pulposus tissue significantly increased.15 Moreover, in vitro study demonstrated that LT-α could induce the apoptosis and inhibit the expression of type II collagen and aggrecan in rat primary nucleus pulposus cells. However, the role of LT-α in macrophage polarization and the progression of IVDD remains to be further investigated.
In this study, we have explored the effects of LT-α on macrophage AG and M1 polarization, as well as the impact of macrophages with LT-α overexpression on NP cell proliferation and apoptosis. Our findings revealed that macrophages with LT-α overexpression can inhibit nucleus pulposus (NP) cell proliferation and promote NP cell apoptosis, likely due to the promotion of macrophage AG and M1 polarization by LT-α. In conclusion, our study provides a strong theoretical foundation for targeting macrophage LT-α as a potential therapeutic strategy for IVDD.
Materials and Methods
Cells and Transfection
NP cells (iCell-0028a) and THP-1 cells (iCell-h213) were purchased from iCELL(China). NP cells were cultured in special culture medium for immortalized human primary nucleus pulposus cells (iCell-0028a-001b, iCell, China), while THP-1 cells were cultured in 1640 medium (31800–089, Gibco, USA) supplemented with 10% fetal bovine serum (FBS), 1% Penicillin/Streptomycin (P/S), and 0.05 mm β-mercaptoethanol under 5% CO2 and 37 °C. M0 macrophages were obtained by stimulating THP-1 cells using 150 nM phorbol-12-myristate-13-acetate (PMA) for 24 h. M1 macrophages were obtained by stimulating M0 macrophages using 20 ng/mL interferon-γ (IFN-γ) and 100 ng/mL lipopolysaccharide (LPS) for 24 h. To silence LT-α in M0 macrophages, cells were transfected with siRNAs (si-LT-α 1, si-LT-α 2, and si-LT-α 3) using the adenovirus for 48 h, with si-NC as the negative control. To construct LT-α overexpression M0 macrophages, cells were transfected with the adenovirus containing the LT-α overexpression vector (OV-LT-α) for 48 h, with empty vector as the negative control. The transfection processing was assisted by lipofectamine 2000 (11,668–019, Invitrogen, USA). Sequences of si-LT-α 1, si-LT-α 2, and si-LT-α 3 and si-NC were listed in the Table 1. We have evaluated the transfection efficiency using RT-qPCR in this study.
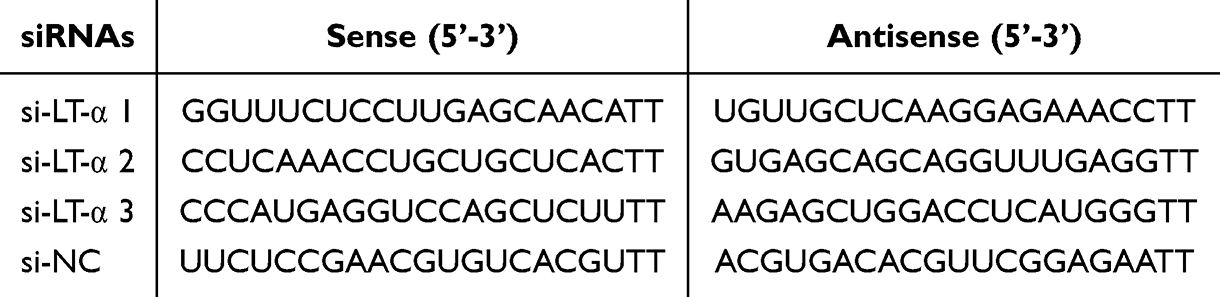 |
Table 1 Sequences of siRNAs Utilized in Transfections |
Reverse Transcription‑quantitative PCR (RT-qPCR)
Cells were treated with 1 mL of pre-cooled TRIzol reagent, then were repeatedly vortexed to lyse them. Total RNA was isolated from cells using the RNA isolation kit (CW0597S, Cwbio, China). The concentration of RNA was detected using a nucleic acid quantitative instrument, and the purity of the extracted RNA was detected by agarose gel electrophoresis. Following the kit instructions (AE311, TransGen Biotech, China), the total RNA was converted into cDNA. The reaction system was prepared according to the instructions of the SYBR Green PCR kit (AQ131, TransGen Biotech, China), and the PCR reaction was carried out. mRNA levels were calculated using the 2−ΔΔCT method, with GAPDH as the internal reference gene. Primer sequences are found in Table 2.
 |
Table 2 Primer Sequences for Reverse Transcription‑quantitative PCR (RT-qPCR) |
Energy Metabolomics
After transfection and treatments, cells were collected and cell precipitates were snap-frozen in liquid nitrogen and transported on dry ice for detection of the energy metabolomics. The energy metabolomics analysis was conducted by Wuhan Lingsi Biotechnology Co., Ltd (Wuhan, China). In this study, 12 samples were selected and divided into four groups for metabolic analysis. Using the liquid chromatography - mass spectrometry (LC-MS/MS) detection platform and an in-house database, a total of 60 metabolites were identified. All metabolites are found in Table S1.
The empirical cumulative distribution function (ECDF) was used to analyze the frequency of coefficients of variation (CV) for metabolites below the reference value. Principal component analysis (PCA) was performed to assess the overall metabolic differences between groups and the degree of variation within groups. Metabolite content data were processed using unit variance scaling (UV), and hierarchical cluster analysis (HCA) was conducted to explore the accumulation patterns of metabolites across different samples. Heatmaps were generated using the ComplexHeatmap package in R software. Differential metabolites were identified using the Partial Least Squares-Discriminant Analysis (PLS-DA) model (n ≥ 3) by calculating the Variable Importance in Projection (VIP). Metabolites with VIP > 1, fold change ≥ 2, or fold change ≤ 0.5 were selected as differential metabolites. Based on the Kyoto Encyclopedia of Genes and Genomes (KEGG) database (http://www.genome.jp/), differential metabolites were subjected to KEGG enrichment analysis.
Detection of Glucose Absorption and Lactic Acid Production
Macrophages were seeded at a density of 1×10⁶ cells per well in 6-well plates. After all cell experiments were completed, the cell supernatants were collected. The glucose in the supernatant was determined using the method of glucose oxidase method with the commercial kit (F006-1-1, Nanjing Jiancheng, China). The release of lactic acid was detected using the colorimetric method with the commercial kit (A019-2-1, Nanjing Jiancheng, China).
Western Blotting
Protein concentration was measured by BCA method after cell lysis. 10% SDS-polyacrylamide gel electrophoresis was conducted, and the protein was transferred onto a PVDF membrane by electroblotting. The membrane was then blocked with 5% non-fat milk in TBST for 2 h. Primary antibody against HK2 (1:800, DF6176, Affinity, USA), Glut1 (1:1000, AF5462, Affinity, USA), HIF1α (1:800, AF1009, Affinity, USA), Bcl-2 (1:800, AF6139, Affinity, USA), Bad (1:800, AF6471, Affinity, USA), Cleaved-caspase-3 (1:800, AF7022, Affinity, USA), p65 (1:800, 10745-1-AP, Proteintech, China), p-p65 (1:800, AF2006, Affinity, USA), and GAPDH (1:2000, GB12002, Servicebio, China) was added and incubated at 4°C overnight, followed by addition of secondary antibody (1:4000, GB23301 or GB23303, Servicebio, China) and culturing for 60 min. Chemiluminescence was then performed using an ECL kit (Millipore, Germany). Grayscale analysis was performed using Image J (National Institutes of Health, Bethesda, MD, USA).
Detection of the NP Cell Migration Ability
Macrophages were seeded on a 24-well plate. After different treatments, the Transwell chambers were placed in the wells of the 24-well plate. NP cells were seeded in the chambers and placed for 24 h. The chambers were taken out, and the upper layer of the culture medium was discarded. The upper layer of cells was gently wiped off with a moist cotton swab. The cells were fixed with 4% paraformaldehyde for 15 minutes and stained with 0.1% crystal violet solution for 20 minutes. The number of cells in each field was counted under an inverted microscope (100×, XD202, Suzhou Antai, China) and photographed for record.
Detection of the NP Cell Invasion Ability
The invasion assay using Transwell chambers was performed in the same manner as the migration assay, with the only difference being that the upper layer of the PET membrane in the Transwell chambers was uniformly covered with Matrigel matrix. The specific experimental procedure involved thawing the original gel stored at −20°C on ice, diluting the gel with serum-free culture medium at a ratio of 1:8, and spreading 80 μL of the matrix gel solution evenly on the upper layer of the PET membrane. After incubating in a cell culture incubator for 1 hour, the matrix gel solution was aspirated, and the prepared transfection reagent-cell mixture was added. The remaining steps were the same as the migration assay.
EdU Detection
THP-1 cells were seeded in the Transwell chamber. After different treatments, NP cells were loaded in the lower chamber. After 1-day of culture, the NP cells were taken out loaded onto the 24-well plate. A 20 μM 2×EdU working solution was prepared and added to the 24-well plate containing NP cells in equal volumes. Cells were further incubated for 2 hours. The culture medium was removed and 0.5 mL of 4% paraformaldehyde was added for fixation for 15 minutes. The fixation solution was then removed, and each well was washed before adding permeabilization solution (0.5 mL of PBS containing 0.3% Triton X-100) for 10 minutes. The permeabilization solution was removed, and 0.5 mL of Click reaction solution was added, followed by light-protected incubation for 30 minutes. After washing, DAPI solution was loaded and incubated in the dark for 10 minutes. The cells were then photographed under a microscope (XD202, Suzhou Antai, China).
Flow Cytometry for Apoptosis Detection
500 μL of 1 × Binding Buffer was used to resuspend NP cells. Then, 5 μL of Annexin V-FITC and 10 μL of propidium iodide (PI) were loaded to each tube. On the flow cytometer, Annexin V-FITC was detected through the FITC channel (Ex = 488 nm; Em = 530 nm), while PI was detected through the PI channel (Ex = 535 nm; Em = 615 nm). After gently vertexing to mix, cells were placed in the dark for 5 minutes, followed by loading onto the flow cytometry (BD FACSCalibur, USA) for apoptosis detection. Live and apoptotic cells were gated based on forward and side scatter (FSC/SSC) to exclude debris and cell doublets. We further identified apoptotic cells by Annexin V and PI staining.
Detection on Macrophage Recruitment Using Crystal Violet Staining
THP-1 cells were seeded in the Transwell chamber. After different treatments, NP cells were loaded in the lower chamber. After 1-day of culture, cells in the upper chamber were fixed using 4% paraformaldehyde. After washing, cells were stained with crystal violet for 10 minutes. After several rinses with deionized water, cells were air-dried and photographed for analysis.
The Subcellular Localization of NF-κB p65 Using the Laser Confocal Technique
Macrophages were seeded on cell culture slides and fixed with 4% paraformaldehyde for 30 minutes. After washing, they were permeabilized with 0.2% TritonX-100 in PBSA (PBS containing 1% BSA), placed on ice for 10 minutes, and then blocked with 1 mL PBSA for 1 hour. The primary antibody against p65 (1:200, 10745-1-AP, Proteintech, China) was diluted in PBSA and loaded into cells for 1 hour, followed by introducing the secondary antibody (1:200, GB23303, Servicebio, China) and 10 μg/mL DAPI at 37°C in a dark incubator for 1 hour. The slides were then taken out and mounted on glass slides, and fluorescence was observed and photographed using laser confocal microscopy (NIKON Eclipse Ti, Tokyo, Japan).
Flow Cytometry for Detection of CD86 Levels in Macrophages
After resuspending macrophages in PBS, 100 μL of the primary antibody against CD86 (13395-1-AP, Wuhan Sanying, Wuhan, China) was loaded and cultured for 60 minutes. Then, 100 µL of FITC-labeled secondary antibody (1:200, GB25303, Servicebio, China) was introduced and cultured in the dark for 30 minutes. Cells were then resuspended and subjected to the flow cytometry for detection.
Statistical Analysis
SPSS 18.0 software was used for statistical analysis. Shapiro-wilk and One-way analysis of variance (ANOVA) was used for data normality and homogeneity of variances analysis, respectively. All data are presented as the mean ± standard deviation (SD; n ≥ 3). One-way ANOVA was used for inter-group comparisons, and the least significant difference (LSD) test was used for pairwise comparisons. T-test was utilized for comparison within two groups. A P-value less than 0.05 was considered to indicate a statistically significant difference.
Results
The Identification of LT-α Knockdown and Overexpression in M0 Macrophages
We designed a series of experiments to explore the therapeutic potential of LT-α in IVDD (Figure 1A). First, we established macrophage models with LT-α knockdown and overexpression. In si-RNAs transfected M0 macrophages, LT-α was markedly downregulated in cells transfected with si-LT-α 1 (p<0.05) and si-LT-α 3 (p<0.01) compared to si-NC, with the lowest expression observed in si-LT-α 3 transfected M0 macrophages (Figure 1B). Furthermore, LT-α levels were sharply elevated in OV-LT-α transfected M0 macrophages compared to empty vector (p<0.01) (Figure 1C). Thus, si-LT-α 3 and OV-LT-α were applied in subsequent assays.
 |
Figure 1 LT-α knockdown and overexpression in M0 macrophages were identified. (A) Flowchart of this study. (B) Levels of LT-α in M0 macrophages transfected with si-NC, si-LT-α 1, si-LT-α 2, and si-LT-α 3 were determined by RT-qPCR (*p<0.05, **p<0.01 vs si-NC). (C) Levels of LT-α in M0 macrophages transfected with empty vector and OV-LT-α were determined by RT-qPCR (**p<0.01 vs empty vector). |
The Altered LT-α Level Was Associated with the Reprogramming of Energy Metabolism in Macrophages
Four groups of macrophages were used for energy metabolomics detection: M0, OV (OV-LT-α), si562 (si-LT-α 3), and M1. The proportion of substances with a CV value below 0.2 in samples exceeded 80%, indicating that the experimental data are highly stable (Figure 2A). PCA analysis revealed that the spatial distances between groups were substantial, while the spatial distances within each group were minimal (Figure 2B). The quality control data for samples indicated that the experimental data and the sample replicates among groups met the quality control requirements. The cluster heatmap analysis of all samples revealed significant differences between different treatment groups (Figure 2C). Additionally, a total of 60 metabolites were detected by LC-MS/MS in this study (Table S1).
 |
Figure 2 The quality control data of samples. (A) The coefficients of variation (CV) value distribution plot of samples were shown. (B) The principal component analysis (PCA) of samples was performed. (C) The cluster heatmap analysis of all samples. |
In the OV-LT-α group compared to M0, different metabolites were largely enriched in the propanoate metabolism (Figure 3A). Substances such as inosine, D-Erythrose 4-phosphate, D(+)-Glucose, D-Ribulose-5-phosphate and Guanosine were notably upregulated, while ATP, NADPH, Succinic acid and L-Cystine were notable downregulated (Figure 3B). In the si562 group compared to M0, different metabolites were largely enriched in the terpenoid backbone biosynthesis (Figure 3C). Substances such as D(+)-Glucose and 6-phosphogluconic-acid was markedly upregulated, while L-citrulline, glutamine, and ATP were markedly downregulated (Figure 3D). In the M1 group compared to M0, different metabolites were notably enriched in the valine, leucine, and isoleucine biosynthesis (Figure 3E). Substances such as D-Erythrose 4-phosphate, D(+)-Glucose, 6-Phosphogluconic-acid and 3-phenyllactic-acid were obviously upregulated, while ATP, ADP, Pyruvic-acid, Isocitric-acid and Citric-acid were obviously downregulated (Figure 3F). Metabolome results showed that changing the expression of LT-α could significantly promote the energy metabolic reprogramming of macrophages.
 |
Figure 3 Energy metabolome analysis of samples. (A) KEGG enrichment analysis of differential metabolites in OV-LT-α vs M0 groups. (B) Cluster analysis of differential metabolites in 5 significantly enriched KEGG metabolic pathways in OV-LT-α vs M0 groups. (C) KEGG enrichment analysis of differential metabolites in si652 vs M0 groups. (D) Cluster analysis of differential metabolites in 5 significantly enriched KEGG metabolic pathways in si652 vs M0 groups. (E) KEGG enrichment analysis of differential metabolites in M1 vs M0 groups. (F) Cluster analysis of differential metabolites in 5 significantly enriched KEGG metabolic pathways in M1 vs M0 groups. |
LT-α Facilitated the AG in M0 Macrophages
To investigate the effect of LT-α on macrophage AG, we have measured glucose and lactate levels in the cells. Compared to the M0 group, glucose absorption and lactate acid production were considerably increased in the OV-LT-α and M1 groups (P<0.01), and strikingly decreased by silencing LT-α (P<0.01) (Figure 4A and B). Furthermore, we have used WB to detect the expression of AG key proteins in macrophages. Compared to the M0 group, HK2, Glut1, and HIF1α levels were sharply boosted in the OV-LT-α and M1 groups (P<0.01), and markedly diminished in the si-LT-α group (P<0.01) (Figure 4C-F). In a word, LT-α could facilitate the AG in M0 macrophages.
 |
Figure 4 LT-α facilitated the AG in M0 macrophages. (A) Glucose absorption was measured in macrophages. (B) Lactic acid production was measured in macrophages. (C) Representative images of AG key protein in macrophages detected by WB. (D-F) Relative protein expression of HK2 (D), Glut1 (E) and HIF1α (F) in macrophages. **p<0.01 vs M0. |
LT-α-Overexpressed Macrophages Suppressed the Proliferation and Migration of NP Cells
Five groups were designed to evaluate the impact of LT-α-changed macrophages on NP cells: M0, OV-LT-α, si-LT-α, THP-1, and M1, in which M0 macrophages, OV-LT-α-transfected M0 macrophages, si-LT-α-transfected M0 macrophages, THP-1 cells, and IFN-γ and LPS stimulated M0 macrophages were co-cultured with NP cells in the Transwell. Firstly, we found that the number of recruited macrophage was significantly declined in the M1 group (P<0.05) and elevated in the THP-1 group (P<0.01), and no statistical difference in the OV-LT-α group and si-LT-α group (P>0.05), compared to the M0 group (Figure 5A and B). Next, we found that the EdU-positive NP cells were significantly reduced in the OV-LT-α group and M1 group (P<0.01), while the EdU-positive NP cells were obviously increased in the si-LT-α group (P<0.05) and THP-1 group (P<0.011), compared to the M0 group (Figure 5C and D). Moreover, compared to the M0 group, the number of migrated and invaded NP cells increased significantly in the si-LT-α group and THP-1 group (P<0.05), while the number of migrated and invaded NP cells decreased significantly in the M1 group (P<0.05). Although, compared with the M0 group, the number of migrated NP cells was reduced but not significant (P≥0.05), while the number of invaded NP cells was significantly reduced in the OV-LT-α group (P<0.05) (Figure 5E-G). In a word, these results revealed that LT-α-overexpressed macrophages could suppress the proliferation and migration of NP cells.
 |
Figure 5 LT-α-overexpressed macrophages suppressed the proliferation and migration of NP cells. (A) The representative images of detection on the macrophage recruitment by the crystal violet staining. Scale bar: 100 μm. (B) Crystal violet staining data statistics. (C) EdU representative images of NP cell proliferation. Scale bar: 100 μm. (D) EdU data statistics. (E) Transwell assays representative images of NP cell migration and invasion. Scale bar: 100 μm. (F) NP cell migration data statistics. (G) NP cell invasion data statistics. *p<0.05, **p<0.01 vs M0. |
LT-α-Overexpressed Macrophages Induced the Apoptosis and AG of NP Cells
Furthermore, we have investigated the effect of co-culture of macrophages and NP cells on NP cell apoptosis and AG. Flow cytometry results showed that the apoptotic NP cells were significantly increased in the OV-LT-α group and M1 group but were significantly decreased in the si-LT-α group and THP-1 group compared to the M0 group (P<0.01) (Figure 6A and B). Moreover, anti-apoptotic protein Bcl-2 was noticeably downregulated, while proapoptotic protein Bad and cleaved-caspase-3 were considerably upregulated in the OV-LT-α group and M1 group compared to the M0 group (P<0.01). Strikingly upregulated Bcl-2, and markedly downregulated Bad and cleaved-caspase-3 were observed in the si-LT-α group and THP-1 group compared to the M0 group (P<0.01) (Figure 6C-F). Levels of AG related proteins (HK2, Glut1, and HIF1α) were sharply boosted in the OV-LT-α group and M1 group, and largely repressed in the si-LT-α group and THP-1 group compared to the M0 group (P<0.01) (Figure 6G-J). These results uncovered that LT-α-overexpressed macrophages induced the apoptosis and AG of NP cells.
 |
Figure 6 LT-α-overexpressed macrophages induced the apoptosis and AG of NP cells. (A) Representative images of NP cell apoptosis detected by flow cytometry. (B) Flow cytometry data statistics. (C) The representative images of apoptotic proteins in NP cells detected by WB. (D-F) The relative protein expression of Bcl-2 (D), Bad (E) and cleaved caspase 3 (F). (G) The representative images of AG proteins in NP cells detected by WB. (H-J) The relative protein expression of HK2 (H), Glut1 (I) and HIF1α (J). **p<0.01 vs M0. |
LT-α Activated the NF-κB Signaling Pathway in M0 Macrophages
Additionally, we have investigated the effect of LT-α on the activation of the NF-κB signaling pathway in macrophages. WB results showed that NF-κB p65 localization in the nucleus significantly increased in the OV-LT-α group (P<0.05) and M1 group (P<0.01) but significantly decreased in the si-LT-α group (P<0.05) compared to the M0 group (Figure 7A and B). Additionally, compared to the M0 group, the relative protein expression of p-NF-κB p65 was remarkably boosted in the OV-LT-α group and M1 group (P<0.01), and notably reduced in the si-LT-α group (P<0.01) (Figure 7C and D). These results demonstrated that LT-α could activate the NF-κB signaling pathway in M0 macrophages.
 |
Figure 7 LT-α activated the NF-κB signaling pathway in M0 macrophages. (A) Representative images of IF detection of NF-κB p65 nuclear translocation. Scale bar: 50 μm. (B) Statistical analysis of NF-κB p65 fluorescence intensity. (C) Representative images of WB detection of NF-κB p65 activation. (D) The relative protein expression of p-NF-κB p65. *p<0.05, **p<0.01 vs M0. |
LT-α Facilitated the M1 Polarization and AG in M0 Macrophages by Activating the NF-κB Signaling Pathway
Five groups of macrophages were designed for identifying the involvement of NF-κB signaling pathway in the function of LT-α: M0, OV-LT-α, si-LT-α, OV-LT-α+(-)-DHMEQ, and si-LT-α+(-)-DHMEQ. (-)-DHMEQ is an inhibitor of NF-κB signaling pathway, and the treatment concentration was 5 μg/mL in this study. Flow cytometry results showed that, compared to the M0 group, the expression level of CD86 was strikingly upregulated in the OV-LT-α group and downregulated in the si-LT-α group (P<0.01), which was remarkably repressed by co-culturing with (-)-DHMEQ (P<0.01) (Figure 8A and B). Additionally, RT-qPCR results also showed that compared to the M0 group, the expression of M1 macrophage polarization markers iNOS, IL-1β, and TNF-α was significantly increased in the OV-LT-α group (P<0.01), whereas it was markedly decreased in the si-LT-α group (P<0.01). However, (-)-DHMEQ significantly inhibited the expression of iNOS, IL-1β, and TNF-α in both the OV-LT-α and si-LT-α groups (P<0.01) (Figure 8C-E). Meantime, we found that (-)-DHMEQ significantly inhibited the expression of glucose absorption and lactic acid production in both the OV-LT-α and si-LT-α groups (P<0.01) (Figure 8F and G). It’s worth noting that (-)-DHMEQ significantly inhibited the expression of macrophage AG markers HK2, Glut1, and HIF1α in both the OV-LT-α and si-LT-α groups (P<0.01) (Figure 8H-K). These results uncovered that LT-α could facilitate the M1 polarization and AG in M0 macrophages by activating the NF-κB signaling pathway.
 |
Figure 8 LT-α facilitated the M1 polarization and AG in M0 macrophages by activating the NF-κB signaling pathway. (A) Representative images of CD86 expression were detected by flow cytometry. (B) Flow cytometry data statistics. (C-E) The expression of M1 macrophage polarization markers iNOS (C), IL-1β (D) and TNF-α (E) was detected by RT-qPCR. (F) Glucose absorption was measured in macrophages. (G) Lactic acid production was measured in macrophages. (H) The representative images of AG proteins in macrophages detected by WB. (I-K) The relative protein expression of HK2 (I), Glut1 (J) and HIF1α (K). **p<0.01 vs M0. |
Discussion
Growing evidence indicates that IVDD degeneration is disorder closely linked to inflammation.7,8 Research has also demonstrated that macrophage infiltration within the IVDD escalates with the progression of the disease. Additionally, a previous study found that M1 macrophage-derived exosomes could exacerbate IVDD by enhancing NP cell senescence.18 These results revealed that macrophages may play a significant role in the progression of IVDD. The phenotype of macrophages is closely associated with energy metabolism. Differential bioenergetic requirements are one of the key factors in activating distinct macrophage phenotypes.19 In proinflammatory M1-type macrophages, the normal tricarboxylic acid (TCA) cycle is disrupted, leading to inhibition of oxidative phosphorylation (OXPHOS) metabolism. As a result, proinflammatory M1-type macrophages primarily rely on AG to generate ATP, leading to the accumulation of pro-inflammatory metabolites such as citric acid and succinate. These metabolites contribute to the secretion of active proteases and pro-inflammatory mediators.20
M1 macrophages with active AG typically exhibit increased glucose absorption and lactic acid production.21 Moreover, key AG markers, including HK2, Glut, and HIF1α, were also significantly upregulated in macrophages.22 The metabolic adaptation of glycolysis relies on the activation of several transcription factors, among which HIF1α serves as a metabolic and functional regulator of cellular response, regulating the expression of genes encoding glycolytic enzymes, glucose transporter protein Glut1, and inflammatory mediators.11 Upregulation of Glut1 is crucial for glycolytic activity in M1 macrophages as it facilitates rapid glucose absorption.23 This process is essential for maintaining the inflammatory activity of macrophages, especially during the high-energy demands of phagocytosis, ROS production, and secretion of pro-inflammatory factors.24,25 Additionally, HK2 catalyzes the binding of glucose and ATP in the initial stage of glycolysis, forming glucose-6-phosphate, which is the rate-limiting step of glycolysis.26 Previous studies found that elevated LT-α is closely linked to IVDD and may contribute to the progression of IVDD by inducing apoptosis in NP cells and reducing key extracellular matrix (ECM) proteins, leading to detrimental effects on disc integrity.15 So, LT-α may play a crucial role in the progression of IVDD. In this study, our energy metabolomics that LT-α overexpression significantly altered the energy metabolism of macrophages, promoting the production of related inflammatory mediators. Moreover, we also confirmed that LT-α overexpression significantly enhanced glucose absorption and lactate acid production in macrophages, along with increased expression of HK2, Glut1, and HIF1α. These findings suggest that LT-α promotes AG in macrophages.
The inflammatory microenvironment leads to the occurrence of IVDD, which leads to tissue atrophy, fibrosis, and phenotypic changes in NP cells.27 The intervertebral disc is composed of three key structures: the NP cells, the annulus fibrosus (AF), and the cartilaginous endplate (CEP), which are positioned on either side of the disc. NP cells are essential for the synthesis and secretion of the extracellular matrix (ECM). Researchers have shown that excessive loss of NP cells caused by apoptosis disrupts the homeostasis of the ECM, thus exacerbating the progression of IVDD.28,29 Therefore, the degeneration of intervertebral discs is closely linked to the loss of NP cells, which are critical for preserving the structural integrity and function of the disc.30 Fan et al have reported that M1 macrophage‑derived exosomes could promote IVDD by enhancing NP cells senescence by LCN2/NF‑κB signaling axis.18 Consistent with previous studies, we found that macrophages with LT-α overexpression inhibited NP cell proliferation, migration, and invasion, while promoting NP cell apoptosis and AG. Another previous study drew similar conclusions, soluble factors derived from macrophages can regulate the expression of glycolytic enzymes and pyroptosis in NP cells.31 We speculate that this effect may be due to soluble factors produced by macrophages, which inhibit NP cell proliferation and promote NP cell apoptosis. In a word, our study uncovered that macrophages with LT-α overexpression can inhibit NP cell proliferation and promote NP cell apoptosis, potentially accelerating the progression of IVDD.
LT-α is another vital member of the TNF superfamily and can bind to TNF receptors (TNFR1 or TNFR2) and LTβ receptor (LTβR), thereby regulating various cellular functions.16 Studies have shown that LT-α binding to LTβR can initiate multiple signaling pathways, including the NF-κB and MAPK pathways, which are extensively involved in the regulation of immune responses and cellular metabolism.32 NF-κB, as a critical transcription factor, plays a pivotal role in regulating the expression of glycolysis-related genes. Once activated, NF-κB can upregulate the expression of glycolytic enzymes such as Hexokinase 2 (HK2) and glucose transporter Glut1.33 These enzymes enhance glucose uptake and metabolism, thereby promoting AG metabolism. Importantly, NF-κB activation can promote pro-inflammatory M1 polarization of macrophages, leading to the production of inflammatory cytokines.34 M1-polarized macrophages can secrete related factors that promote NP cell senescence, thereby accelerating the progression of IVDD.18 Therefore, we have investigated the effect of LT-α on NF-κB activation in macrophages.
Our study found that LT-α overexpression significantly promoted NF-κB activation in macrophages. Further investigation revealed that LT-α overexpression significantly enhanced the expression of CD86, iNOS, IL-1β, and TNF-α in macrophages. These markers are closely associated with pro-inflammatory M1 polarization of macrophages, and their upregulation typically indicates a shift towards M1 polarization.35 Therefore, these findings demonstrated that LT-α overexpression can promote macrophage M1 polarization. However, we found that the NF-κB inhibitor could significantly abolish the promoting effect of LT-α overexpression on the expression of CD86, iNOS, IL-1β, and TNF-α in macrophages. Moreover, we also found that the NF-κB inhibitor could suppress LT-α overexpression-induced macrophage AG activity. Hence, our results revealed that LT-α could facilitate the M1 polarization and AG in macrophages by activating the NF-κB signaling pathway.
Although this study has confirmed that LT-α promotes macrophage M1 polarization and the progression of IVDD, there are still several limitations. First, the findings were primarily validated through cell models, and further animal studies are needed to confirm the role of LT-α in IVDD progression. Second, this study focused solely on the effects of LT-α on macrophage polarization and AG, without investigating its impact on other immune cells. Therefore, future research should expand its scope to explore the influence of LT-α on other immune cell types, aiming to comprehensively understand the therapeutic potential of LT-α in IVDD.
Conclusion
This study demonstrated that macrophages with LT-α overexpression can inhibit NP cell proliferation, migration, and invasion while promoting NP cell apoptosis and AG. Further investigation revealed that LT-α overexpression enhances macrophage AG and pro-inflammatory M1 polarization. Therefore, soluble factors derived from M1-polarized macrophages inhibit NP cell proliferation and promote NP cell apoptosis. The promotion of macrophage AG and M1 polarization by LT-α may be associated with the activation of the NF-κB signaling pathway in macrophages (Figure 9). In conclusion, our study provides a solid theoretical foundation for the development of LT-α-targeted therapies for IVDD.
 |
Figure 9 LT-α promotes aerobic glycolysis (AG) and M1 polarization in macrophages by activating the NF-κB signaling pathway. The M1-polarized macrophages then secrete soluble cytokines that induce AG in nucleus pulposus (NP) cells, thereby promoting apoptosis and inhibiting NP cell proliferation, migration, and invasion. |
Abbreviations
AG, aerobic glycolysis; ECM, extracellular matrix; HK2, hexokinase 2; LT-α, lymphotoxin-α; IVDD, intervertebral disc degeneration; LTβR, LTβ receptor; NP, nucleus pulposus; TNF, tumor necrosis factor; WB, Western blot.
Data Sharing Statement
The data used and analyzed during the current study are available from the corresponding author on reasonable request.
Author Contributions
All authors made a significant contribution to the work reported, whether that is in the conception, study design, execution, acquisition of data, analysis and interpretation, or in all these areas; took part in drafting, revising or critically reviewing the article; gave final approval of the version to be published; have agreed on the journal to which the article has been submitted; and agree to be accountable for all aspects of the work.
Funding
This work was supported by the Natural Science Foundation of Qingdao (23-2-1-150-zyyd-jch), the Natural Science Foundation of Shandong (ZR2022QC165) and the Program of Qingdao Science and Technology Bureau Industrial Cultivation Plan Science and Technology Benefiting the People (19-6-1-15-nsh).
Disclosure
The authors declare that they have no competing interests.
References
1. Dowdell J, Erwin M, Choma T, et al. Intervertebral disk degeneration and repair. Neurosurgery. 2017;80(3s):S46–s54. doi:10.1093/neuros/nyw078
2. Fine N, Lively S, Séguin CA, et al. Intervertebral disc degeneration and osteoarthritis: a common molecular disease spectrum. Nature Reviews Rheumatology. 2023;19(3):136–152. doi:10.1038/s41584-022-00888-z
3. Qiu C, Wu X, Bian J, et al. Differential proteomic analysis of fetal and geriatric lumbar nucleus pulposus: immunoinflammation and age-related intervertebral disc degeneration. BMC Musculoskeletal Disorders. 2020;21(1):339. doi:10.1186/s12891-020-03329-8
4. Ohnishi T, Iwasaki N, Sudo H. Causes of and molecular targets for the treatment of intervertebral disc degeneration: a review. Cells. 2022;11(3):394. doi:10.3390/cells11030394
5. Krut Z, Pelled G, Gazit D, et al. Stem cells and exosomes: new therapies for intervertebral disc degeneration. Cells. 2021;10(9):2241. doi:10.3390/cells10092241
6. Ahmad F, Rani A, Alam A, et al. Macrophage: a cell with many faces and functions in tuberculosis. Frontiers in Immunology. 2022;13:747799. doi:10.3389/fimmu.2022.747799
7. Koroth J, Buko EO, Abbott R, et al. Macrophages and intervertebral disc degeneration. Int J mol Sci. 2023;24(2):1367. doi:10.3390/ijms24021367
8. Li XC, Luo SJ, Fan W, et al. Macrophage polarization regulates intervertebral disc degeneration by modulating cell proliferation, inflammation mediator secretion, and extracellular matrix metabolism. Front Immunol. 2022;13:922173. doi:10.3389/fimmu.2022.922173
9. Tang BL. Glucose, glycolysis, and neurodegenerative diseases. Journal of Cellular Physiology. 2020;235(11):7653–7662. doi:10.1002/jcp.29682
10. Liu Y, Xu R, Gu H, et al. Metabolic reprogramming in macrophage responses. Biomarker Research. 2021;9(1):1. doi:10.1186/s40364-020-00251-y
11. Zhuang H, Lv Q, Zhong C, et al. Tiliroside ameliorates ulcerative colitis by restoring the M1/M2 macrophage balance via the HIF-1alpha/glycolysis pathway. Front Immunol. 2021;12:649463. doi:10.3389/fimmu.2021.649463
12. Borelli A, Irla M. Lymphotoxin: from the physiology to the regeneration of the thymic function. Cell Death and Differentiation. 2021;28(8):2305–2314. doi:10.1038/s41418-021-00834-8
13. Jana M, Pahan K. Induction of lymphotoxin-alpha by interleukin-12 p40 homodimer, the so-called biologically inactive molecule, but not IL-12 p70. Immunology. 2009;127(3):312–325. doi:10.1111/j.1365-2567.2008.02985.x
14. James Bates RE, Browne E, Schalks R, et al. Lymphotoxin-alpha expression in the meninges causes lymphoid tissue formation and neurodegeneration. Brain: a Journal of Neurology. 2022;145(12):4287–4307. doi:10.1093/brain/awac232
15. Guo Z, Qiu C, Mecca C, et al. Elevated lymphotoxin-alpha (TNFbeta) is associated with intervertebral disc degeneration. BMC Musculoskelet Disord. 2021;22(1):77. doi:10.1186/s12891-020-03934-7
16. Hirose T, Fukuma Y, Takeshita A, et al. The role of lymphotoxin-alpha in rheumatoid arthritis. Inflamm Res. 2018;67(6):495–501. doi:10.1007/s00011-018-1139-6
17. Guedj K, Khallou-Laschet J, Clement M, et al. M1 macrophages act as LTbetaR-independent lymphoid tissue inducer cells during atherosclerosis-related lymphoid neogenesis. Cardiovasc Res. 2014;101(3):434–443. doi:10.1093/cvr/cvt263
18. Fan C, Wang W, Yu Z, et al. M1 macrophage-derived exosomes promote intervertebral disc degeneration by enhancing nucleus pulposus cell senescence through LCN2/NF-kappaB signaling axis. J Nanobiotechnology. 2024;22(1):301. doi:10.1186/s12951-024-02556-8
19. Wang S, Liu R, Yu Q, et al. Metabolic reprogramming of macrophages during infections and cancer. Cancer Lett. 2019;452:14–22. doi:10.1016/j.canlet.2019.03.015
20. Li S, Liu L, Luo G, et al. The crosstalk between M1 macrophage polarization and energy metabolism disorder contributes to polystyrene nanoplastics-triggered testicular inflammation. Food Chem Toxicol. 2023;180:114002. doi:10.1016/j.fct.2023.114002
21. Jiang H, Wei H, Wang H, et al. Zeb1-induced metabolic reprogramming of glycolysis is essential for macrophage polarization in breast cancer. Cell Death Dis. 2022;13(3):206. doi:10.1038/s41419-022-04632-z
22. Li M, Yang Y, Xiong L, et al. Metabolism, metabolites, and macrophages in cancer. J Hematol Oncol. 2023;16(1):80. doi:10.1186/s13045-023-01478-6
23. Feng C, Jiang H, Yang X, et al. GLUT1 mediates the metabolic reprogramming and inflammation of CCR2$;+$ monocytes/macrophages from patients with DCM. Front Biosci (Landmark Ed). 2023;28(9):223. doi:10.31083/j.fbl2809223
24. Erlich JR, To EE, Liong S, et al. Targeting evolutionary conserved oxidative stress and immunometabolic pathways for the treatment of respiratory infectious diseases. Antioxid Redox Signal. 2020;32(13):993–1013. doi:10.1089/ars.2020.8028
25. Xu Y, Chen Y, Zhang X, et al. Glycolysis in innate immune cells contributes to autoimmunity. Front Immunol. 2022;13:920029. doi:10.3389/fimmu.2022.920029
26. Han X, Ren C, Lu C, et al. Deubiquitination of MYC by OTUB1 contributes to HK2 mediated glycolysis and breast tumorigenesis. Cell Death and differentiation. 2022;29(9):1864–1873. doi:10.1038/s41418-022-00971-8
27. Priyadarshani P, Li Y, Yao L. Advances in biological therapy for nucleus pulposus regeneration. Osteoarthritis Cartilage. 2016;24(2):206–212. doi:10.1016/j.joca.2015.08.014
28. Lin J, Zheng X, Xiong Z, et al. DJ-1-mediated p62 degradation delays intervertebral disc degeneration by inhibiting apoptosis of nucleus pulposus cells. Apoptosis: an International Journal on Programmed Cell Death. 2023;28(9–10):1357–1371. doi:10.1007/s10495-023-01862-0
29. Chen S, Lei L, Li Z, et al. Grem1 accelerates nucleus pulposus cell apoptosis and intervertebral disc degeneration by inhibiting TGF-beta-mediated Smad2/3 phosphorylation. Exp Mol Med. 2022;54(4):518–530. doi:10.1038/s12276-022-00753-9
30. Tu J, Li W, Yang S, et al. Single-cell transcriptome profiling reveals multicellular ecosystem of nucleus pulposus during degeneration progression. Adv Sci. 2022;9(3):e2103631. doi:10.1002/advs.202103631
31. Zheng X, Qiu J, Ye J, et al. Macrophage-derived PDGF-BB modulates glycolytic enzymes expression and pyroptosis in nucleus pulposus cells via PDGFR-beta/TXNIP pathway. Osteoarthritis Cartilage. 2024;32(10):1245–1260. doi:10.1016/j.joca.2024.05.001
32. Mussa A, Afolabi HA, Syed NH, et al. The NF-κB transcriptional network is a high-dose vitamin C-targetable vulnerability in breast cancer. Biomedicines. 2023;11(4):1060. doi:10.3390/biomedicines11041060
33. Chen L, Lin X, Lei Y, et al. Aerobic glycolysis enhances HBx-initiated hepatocellular carcinogenesis via NF-kappaBp65/HK2 signalling. J Exp Clin Cancer Res. 2022;41(1):329. doi:10.1186/s13046-022-02531-x
34. Fan X, Han J, Zhong L, et al. Macrophage-derived GSDMD plays an essential role in atherosclerosis and cross talk between macrophages via the mitochondria-STING-IRF3/NF-kappaB axis. Arterioscler Thromb Vasc Biol. 2024;44(6):1365–1378. doi:10.1161/ATVBAHA.123.320612
35. Yunna C, Mengru H, Lei W, et al. Macrophage M1/M2 polarization. Eur J Pharmacol. 2020;877:173090. doi:10.1016/j.ejphar.2020.173090
 © 2025 The Author(s). This work is published and licensed by Dove Medical Press Limited. The
full terms of this license are available at https://www.dovepress.com/terms.php
and incorporate the Creative Commons Attribution
- Non Commercial (unported, 3.0) License.
By accessing the work you hereby accept the Terms. Non-commercial uses of the work are permitted
without any further permission from Dove Medical Press Limited, provided the work is properly
attributed. For permission for commercial use of this work, please see paragraphs 4.2 and 5 of our Terms.
© 2025 The Author(s). This work is published and licensed by Dove Medical Press Limited. The
full terms of this license are available at https://www.dovepress.com/terms.php
and incorporate the Creative Commons Attribution
- Non Commercial (unported, 3.0) License.
By accessing the work you hereby accept the Terms. Non-commercial uses of the work are permitted
without any further permission from Dove Medical Press Limited, provided the work is properly
attributed. For permission for commercial use of this work, please see paragraphs 4.2 and 5 of our Terms.