")
Back to Journals » Journal of Inflammation Research » Volume 17
Machine Learning and Experimental Validation Identified Ferroptosis Signature and Innovative Biomarkers (ESR1 and GSTZ1) in Liver Fibrosis
Authors Luo W, Wu H, Yang Z, Lan T, Wu L, Huang Y
Received 6 August 2024
Accepted for publication 28 November 2024
Published 4 December 2024 Volume 2024:17 Pages 10313—10332
DOI https://doi.org/10.2147/JIR.S490258
Checked for plagiarism Yes
Review by Single anonymous peer review
Peer reviewer comments 4
Editor who approved publication: Dr Tara Strutt
Wen Luo,1 Hongwen Wu,2 Zhijie Yang,2 Tian Lan,2 Liya Wu,3 Yushen Huang2
1Department of Gastrointestinal Surgery, Liuzhou Workers Hospital, Liuzhou, People’s Republic of China; 2Department of Pharmacy, Liuzhou Workers Hospital, Liuzhou, People’s Republic of China; 3Department of Neurology, Liuzhou Workers Hospital, Liuzhou, People’s Republic of China
Correspondence: Yushen Huang; Liya Wu, Email [email protected]; [email protected]
Background: Targeting ferroptosis is an effective approach to mitigate hepatic fibrosis, yet no reports exist on the ferroptosis signature in liver fibrosis. This study aimed to explore ferroptosis characteristics in this disease.
Methods: RNAseq data from GSE6764, GSE188604 and Cancer Genome Atlas Liver Hepatocellular Carcinoma (TCGA-LIHC) were downloaded. Multiple machine learning methods, including Weighted Gene Co-expression Network Analysis (WGCNA), Random Forest (RF) and Support Vector Machine (SVM), were used to identify core genes in liver fibrosis and ferroptosis. WGCNA can pinpoint modules linked to clinical traits, aiding in discovering diagnostic and progression molecules in complex diseases. RF and SVM are often utilized for WGCNA validation to boost result accuracy. Carbon tetrachloride (CCl4) was used to establish a mouse liver fibrosis model to validate core gene expression, which was also assessed in test and validation GEO datasets. Finally, the diagnostic role of the core genes in liver fibrosis and hepatocellular carcinoma (HCC) was also investigated using ROC analysis.
Results: Multiple machine learning methods screened nine core genes, including IL1B, GSTZ1, LIFR, SLC25A37, PTGS2, MT1G, HSPB1, ESR1, and PHGDH. In vivo experimental validation, RT-PCR showed ESR1 and GSTZ1 were significantly under-expressed in the liver fibrosis group compared to the normal group. Simultaneously, in GSE6764 and GSE188604, ESR1 and GSTZ1 were also identified as protective genes for liver fibrosis. More in-depth research found that ESR1 and GSTZ1 exhibited a good diagnostic performance both in liver fibrosis and HCC, suggesting that a persistent decrease in ESR1 and GSTZ1 in patients might signal the progression from hepatic fibrosis to HCC.
Conclusion: The present study is the first to report the ferroptosis signature in liver fibrosis and identifies two novel biomarkers, ESR1 and GSTZ1, providing new insights for the diagnosis and treatment of liver fibrosis in the future.
Keywords: ESR1, GSTZ1, ferroptosis, liver fibrosis, biomarker
Introduction
Liver fibrosis is a significant global health issue characterized by the excessive accumulation of extracellular matrix (ECM), leading to the disruption of normal liver architecture and function. It is a common consequence of chronic liver diseases, including viral hepatitis, alcoholic liver disease, and non-alcoholic fatty liver disease (NAFLD).1 With the progression of liver fibrosis, the liver microenvironment undergoes significant changes, which facilitate the carcinogenesis of liver cells, leading to a higher mortality rate.2 Persistent cell death and compensatory regeneration in fibrotic livers can lead to genetic instability, making liver parenchymal cells more susceptible to carcinogenesis.3 In addition, hepatic stellate cells secrete soluble cytokines, chemokines, and chemotactic factors, establishing a complex tumor microenvironment that leads to epithelial-mesenchymal transition, which contributes to the occurrence of liver cancer.4 According to recent studies, liver fibrosis affects millions of people worldwide, with a substantial number progressing to advanced stages of the disease.5 Despite the availability of various diagnostic tools and therapeutic strategies, the management of hepatic fibrosis remains challenging due to the complex pathophysiology and the lack of effective anti-fibrotic treatments.6
Current diagnostic methods for liver fibrosis include liver biopsy, imaging techniques, and serum biomarkers. Liver biopsy, although considered the gold standard, is invasive and associated with complications such as pain, bleeding, and sampling errors.7 Non-invasive imaging techniques such as transient elastography and magnetic resonance elastography have been developed to assess liver stiffness, but they have limitations in terms of parameter standardization and clear measurement of liver stiffness in terms of pathogenicity.8 Serum biomarkers, such as the aspartate aminotransferase (AST) and alanine aminotransferase (ALT), are useful for screening but lack specificity and sensitivity for early-stage fibrosis.9 These limitations highlight the need for more reliable and non-invasive diagnostic tools to accurately assess liver fibrosis and monitor disease progression.
The role of ferroptosis, a form of regulated cell death characterized by iron-dependent lipid peroxidation (LPO), has gained attention in the context of liver fibrosis. Ferroptosis has a strong connection with the accumulation of ECM, a key step in hepatic fibrosis. When hepatic stellate cells are subjected to ferroptosis, the process effectively curtails their activation, thereby impeding their transition into activated myofibroblasts and subsequently preventing the assembly and deposition of the ECM. Inducing ferroptosis in hepatic stellate cells could potentially represent an innovative therapeutic strategy for the treatment of liver fibrosis.10 Simultaneously, ferroptosis is closely associated with oxidative stress and inflammation, which are commonly present in liver fibrosis. Liver fibrosis is accompanied by oxidative stress caused by the excessive accumulation of ROS, which can exacerbate the production of LPO. LPO-induced ferroptosis leads to the release of damage-associated molecular patterns (DAMPs) from dead cells, activating the NFκB pathway to promote inflammation.11 GPX4 serves as a pivotal regulatory molecule in the ferroptosis pathway, and through its modulation of the arachidonic acid (AA) pathway, it exacerbates the generation of ROS, forming a vicious cycle.12 Recent studies have identified several ferroptosis-related genes that are differentially expressed in hepatic fibrosis, suggesting their potential as biomarkers and therapeutic targets.13–15 Given the crucial role of ferroptosis in liver fibrosis, research into the characteristics of ferroptosis in this disease and the identification of gene signatures associated with it are of great importance. However, such studies have not yet been conducted.
The application of machine learning in the medical field is increasingly widespread, especially demonstrating significant advantages in the identification of core genes. Compared to traditional methods, machine learning can handle larger, more complex, and multi-dimensional data, revealing the potential regulatory relationships between genes more efficiently, thereby providing new biomarkers for disease diagnosis and prognosis. Commonly used machine learning methods include Weighted Gene Co-expression Network Analysis (WGCNA), Random Forest (RF) and Support Vector Machine (SVM), etc. WGCNA employs a weighted co-expression strategy, which is more in line with biological phenomena and can better reveal the interactive relationships between genes.16 Meanwhile, WGCNA is capable of identifying modules associated with clinical characteristics, which allows for a better discovery of molecules with diagnostic and progression features in complex diseases.17 WGCNA can also be combined with other machine learning algorithms, such as RF and SVM, to further screen for core genes with clinical significance, thereby enhancing the diagnostic accuracy and prognostic assessment capabilities for diseases.18
In the present study, we comprehensively summarized the list of ferroptosis-related genes through a database of ferroptosis and published literature. By intersecting with differentially expressed genes (DEGs) identified from GEO datasets, ferroptosis-related differentially expressed genes (FRDEGs) were obtained. To screen for FRDEGs that play significant roles, multiple machine learning methods, including WGCNA, RF, and SVM, were applied. The selected core genes were also validated in an animal model of liver fibrosis to enhance the accuracy and credibility of the results. Given the close connection between liver fibrosis and HCC, the relationship between core genes in liver fibrosis and HCC was also explored, expanding their clinical application scope. This investigation is the inaugural study to unveil the ferroptosis signature associated with liver fibrosis, identifying ESR1 and GSTZ1 as two promising biomarkers. These two genes not only hinder the progression of liver fibrosis but also serve as protective genes against HCC.
Materials and Methods
Data Collection
GEOquery R package19 was used to acquire gene expression profile data from the GSE6764 and GSE188604 datasets. RNAseq data for the Cancer Genome Atlas Liver Hepatocellular Carcinoma (TCGA-LIHC) were downloaded from TCGA. The GSE6764 dataset was based on the GPL570 [HG-U133_Plus_2] Affymetrix Human Genome U133 Plus 2.0 Array platform and GSE188604 was generated using the GPL14844 Illumina HiSeq 2000 (Rattus norvegicus) platform. 10 normal human liver samples and 65 liver fibrosis samples in the GSE6764 and three normal rat liver samples and three liver fibrosis samples in the GSE188604 were selected for subsequent analysis.
Differential Expression Analysis
After normalization and probe annotation, differential gene expression analysis between the normal and liver fibrosis groups was conducted by the limma package,20 with P value<0.05 and |logFC|>1 considered statistically significant. In the event that a gene exhibited various expression profiles, an average value was computed for use in subsequent analyses. PCA and volcano plots were utilized to visualize the DEGs results.
Determination of FRDEGs in Liver Fibrosis
Ferroptosis-related genes were downloaded from the FerrDb website (http://www.zhounan.org/ferrdb/current/)21 and the research of Chang’s team.22 After taking the union of the two sets and removing duplicates, a list of ferroptosis-related genes was obtained (Table S1). FRDEGs were acquired by intersecting DEGs with ferroptosis-related genes, which were visualized by a Venn diagram.
Machine Learning Analysis
WGCNA encompasses four different levels of factors including genes, samples, gene modules, and phenotypic traits, forming a four-dimensional analysis model, which makes the identified core genes more accurate. WGCNA was constructed using the R package “WGCNA”23 to identify the module most closely associated with hepatic fibrosis. The choice of soft threshold has a significant impact on the construction of the network and the identification of gene modules. The network topological characteristics for different power values were calculated using the pickSoftThreshold function. We first set the power value to range from 1 to 20. The results showed that when the power value reached 11, the curve tended to become parallel, at which point the network exhibited scale-free characteristics. This scale-free network distribution holds greater biological significance. Subsequently, the ideal power value was used to convert the correlation matrix into an adjacency matrix, based on which the topological overlap matrix was generated. Through average linkage hierarchical clustering, genes with similar expression profiles were grouped together. In this process, we ensured that each module contained more than 60 genes to guarantee the stability and reliability of the modules. At the same time, by adjusting the value of MEDissThres, the number of modules was reduced to improve the efficiency of the analysis. Finally, a correlation analysis between the modules and the disease was conducted, and the module with the most significant association with the disease was selected as the key for further analysis. RF and SVM were employed to validate the genes screened by WGCNA. RF was implemented using the randomForest R package, and SVM was conducted by the e1071 R package. ROC analysis and the area under the curve were used to evaluate the accuracy of these two machine learning methods. An area under the curve greater than 0.8 was considered to indicate good accuracy.
Enrichment Analysis
The clusterProfiler package24 was used to perform GSEA, with the gene set database for GSEA being the MSigDB Collections. The mountain map was employed to visualize the pathways and processes enriched by GESA.
Immune Analysis
The CIBERSORT algorithm, utilizing linear support vector regression to decode the expression matrix of 22 human immune cell subtypes, was applied to examine the variations in immune cell profiles between the normal population and liver fibrosis patients, with the results being visually represented through barplots, heatmaps, and lollipop plots. After pinpointing immune cells exhibiting substantial differences in infiltration between the liver fibrosis and control groups, a Spearman correlation analysis was performed to assess their relationship with the core genes, with the goal of shedding light on the core genes’ influence within the immune response.
Construction of Mouse Liver Fibrosis Model
Both male and female C57BL/6 mice, classified as specific pathogen-free (SPF) and aged 6–8 weeks with an average weight of 20 ± 2 grams, were sourced from the Experimental Animal Center of Guangxi Medical University in Guangxi, China. Following a one-week acclimatization period with free access to standard chow and water, the mice were randomly assigned to either a normal or hepatic fibrosis group, with nine animals in each group. Each group consisted of 4 female mice and 5 male mice, respectively. The female and male mice were housed in separate cages. The method of the mouse liver fibrosis model was performed as described in a previous study.25 The hepatic fibrosis group received intraperitoneal injections of 0.5 mL/100 g of a 20% carbon tetrachloride (CCl4) oil solution three times a week over a period of ten weeks. Concurrently, the normal group was administered intraperitoneal injections of a matching volume of normal saline. In the eleventh week, on the same morning, all animals were euthanized under sodium pentobarbital anesthesia, and liver tissue samples were collected for subsequent analysis.
Sirius Staining
Mouse liver specimens were preserved in 4% paraformaldehyde for a period of 48 hours before being embedded in paraffin. These paraffin-wax embedded tissues were then sectioned into 4-micron-thick slices and processed for Sirius red staining in accordance with standard protocols.
Reverse Transcription-Polymerase Chain Reaction
Total RNA was extracted from liver tissues using the TRIzol reagent. The RNA from each mouse was extracted and analyzed. CDNA, which served as the template for PCR, was synthesized through reverse transcription using a one-step RT kit (Takara Biotechnology, Dalian, China). PCR was conducted using a SYBR Green PCR kit (Takara Biotechnology). The levels of IL1B, GSTZ1, LIFR, SLC25A37, PTGS2, MT1G, HSPB1, ESR1, GPX4, SLC7A11 and PHGDH mRNA were quantified and normalized against GAPDH levels. The RT-PCR conditions involved a single initial denaturation step at 95°C for 30 seconds, followed by 40 cycles of denaturation at 95°C for 5 seconds and annealing at 60°C for 30 seconds. The primer sequences for the genes used in the experiment are provided in Table S2. PCR products underwent agarose gel electrophoresis to ascertain the integrity of the RNA. Data confirming the integrity of the RNA were then included in the subsequent statistical analyses.
Immunohistochemical Analysis
The protein expression levels of GSTZ1 and ESR1 in HCC were searched for in the human protein atlas (HPA, https://www.proteinatlas.org/), and immunohistochemistry images for both the normal and disease groups were downloaded.
Serum Biochemical Assay
The concentrations of serum aspartate aminotransferase (AST) and alanine aminotransferase (ALT) were determined utilizing an automated biochemical analyzer (Hitachi, Tokyo, Japan).
Enzyme-Linked Immunosorbent Assay
The expression levels of IL-6, IL-10, ESR1 and GSTZ1 were measured using enzyme-linked immunosorbent assay kits (Jianglaibio Technology Co. Ltd), following the protocols provided by the manufacturer.
Cell Culture
HepG2 and L02 cells were cultured in DMEM medium containing 10% heat-inactivated fetal bovine serum, 100 IU/mL penicillin, and 100 mg/ mL streptomycin in a constant temperature incubator at 37 ◦C and 5% CO2. Every 2–3 days, the cell culture medium was changed. When the cells reached about 80% confluence, they were digested to ensure adequate nutrition and growing space.
Statistical Analysis
All data calculation and statistical analysis were performed using R programming (https://www.r-project.org/, version 4.2.1). To compare two sets of continuous variables, we employed an independent Student’s t-test for normally distributed variables and a Mann–Whitney U-test (also known as the Wilcoxon rank sum test) for non-parametric variables. All tests were two-tailed, and statistical significance was determined at P < 0.05.
Results
Identification of DEGs Between the Normal and Liver Fibrosis Groups
The entire text’s analysis process is depicted in Figure 1. The GEO data, after standardization, exhibited greater consistency compared to their pre-standardized state (Figure 2A and B). The PCA plot revealed a distinct separation between the hepatic fibrosis group and the normal group, so a differential analysis was subsequently performed to pinpoint the specific DEGs (Figure 2C). As shown in Figure 2D, the volcano plot displayed DEGs between the normal and hepatic fibrosis groups. A total of 241 up-regulated genes and 353 down-regulated genes were screened using the criteria of P value<0.05 and |logFC|>1. To elucidate the specific functions of these genes, the GSEA was performed. The results illustrated that the DEGs were primarily enriched in ECM receptor interaction and collagen formation, which are key processes in the progression of liver fibrosis (Figure 2E). GSEA also demonstrated that cytokine signaling in immune system, sarscov2 innate immunity evasion and cell specific immune response were significant physiological roles through which the DEGs exerted their effects (Figure 2F). Ferroptosis can activate cell-specific immune responses or innate immune evasion through various cytokine pathways, including B cells, T cells, macrophages, and monocytes. Concurrently, an imbalance in the body’s immune system can feedback to influence ferroptosis, thereby establishing a self-perpetuating cycle of dysfunction.26 Furthermore, the process of ferroptosis in hepatic stellate cells suppresses their activation, consequently decreasing the accumulation of ECM and collagen.10 Therefore, these results indicate that the DEGs between the normal and liver fibrosis groups primarily participate in the progression of liver fibrosis by affecting collagen deposition and immune responses.
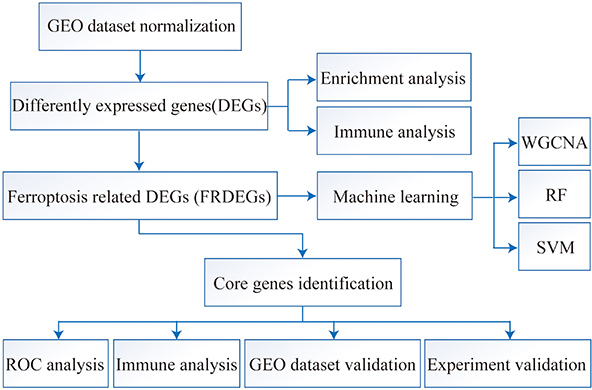 |
Figure 1 Flowchart of the current study. |
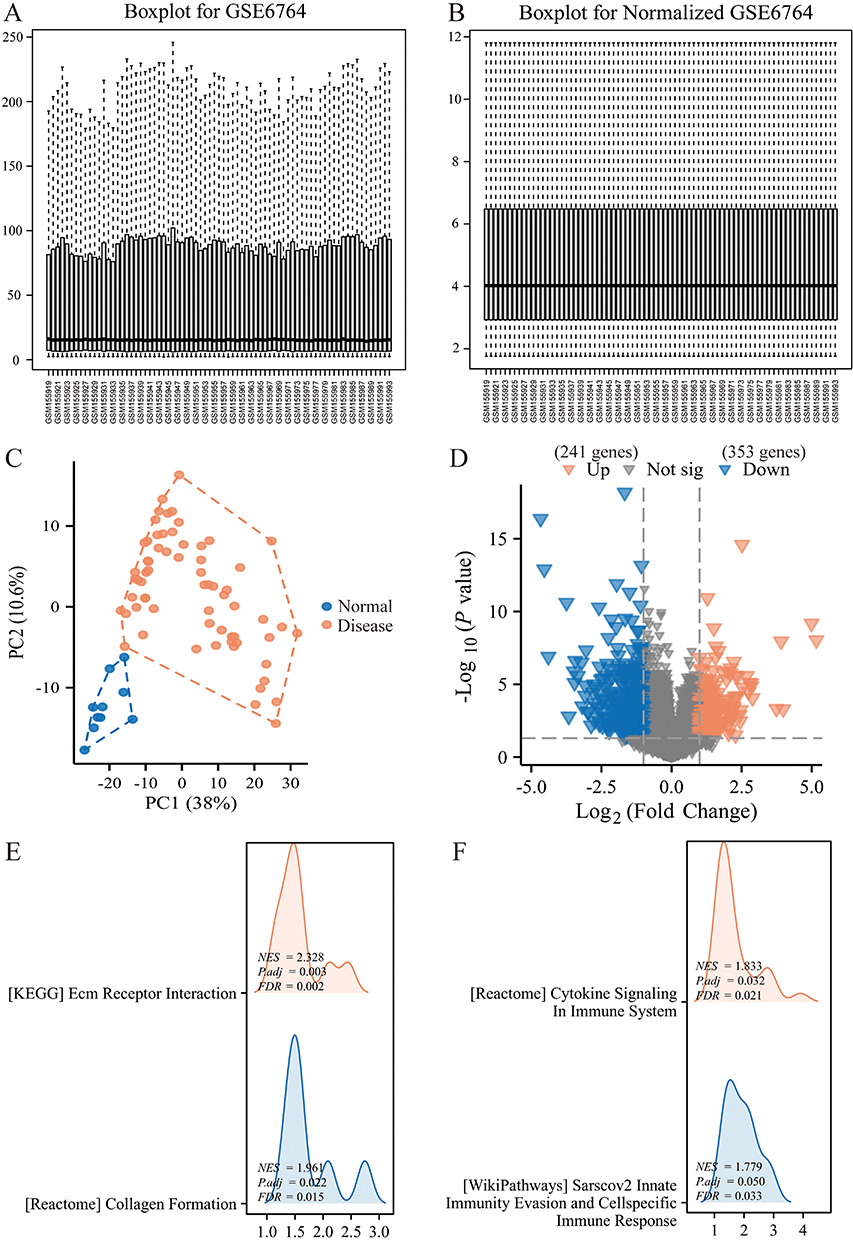 |
Figure 2 Identification of DEGs between the normal and liver fibrosis groups. (A and B) Distribution of the GEO dataset before (A) and after (B) normalization. (C) PCA analysis. Each point represents a sample, with blue for samples from the normal group and red for samples from the disease group. (D) Volcano plot of DEGs. Red represents significantly upregulated genes, while blue represents significantly downregulated genes. (E and F) Enrichment analysis of DEGs. |
Identification of FRDEGs in Hepatic Fibrosis
Ferroptosis is crucial in the occurrence and development of liver fibrosis, so it is imperative to explore the characteristics of ferroptosis-related genes in this disease. Ferroptosis-related genes comprise a total of 468 genes (Table S1). By intersecting DEGs with ferroptosis-related genes, 26 FRDEGs were identified (Figure 3A). The differential expressions of the 26 FRDEGs between the control and disease groups were displayed using a heat map and a group comparison chart (Figure 3B and C). These FRDEGs may participate in the occurrence and development of liver fibrosis by acting on the ferroptosis process, which expands the understanding of pathogenesis in hepatic fibrosis.
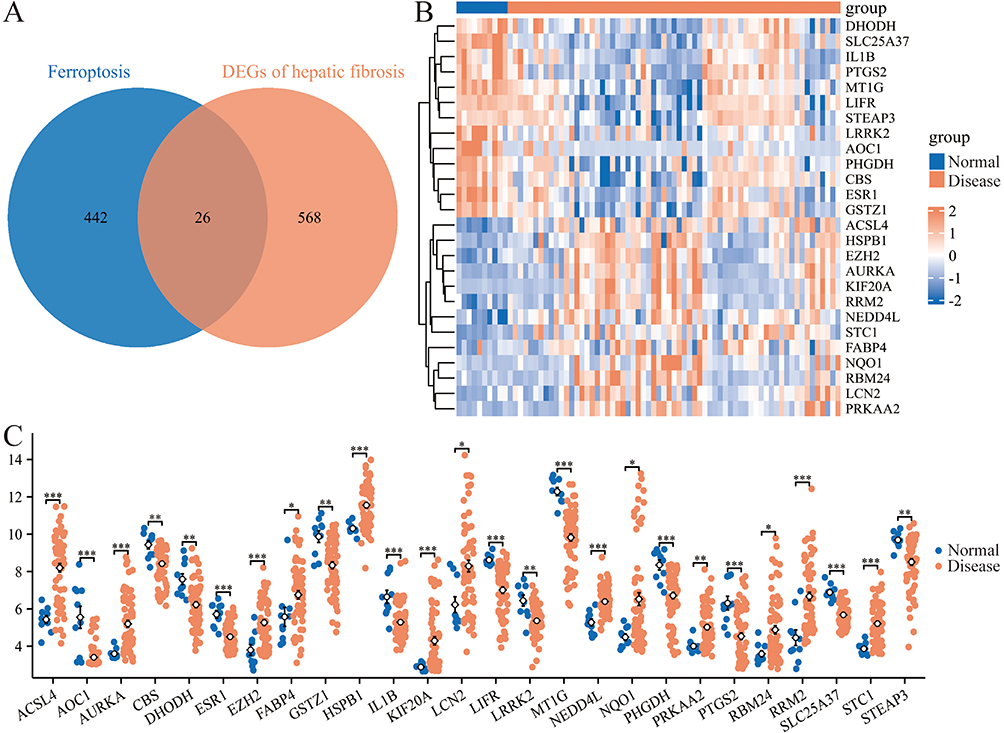 |
Figure 3 Identification of FRDEGs in hepatic fibrosis. (A) Venn diagram of DEGs and ferroptosis-related genes. (B and C) Heat map (B) and group comparison chart (C) displayed the expression levels of FRDEGs between the normal and hepatic fibrosis groups. *P<0.05, **P<0.01 and ***P<0.001. |
Machine Learning Screening Core Genes in Liver Fibrosis
After the soft thresholding power exceeded 11, the curve tended to become parallel. Hence, we selected 11 as the optimal value (Figure 4A). Furthermore, the co-expression matrix modules were constructed, and similar modules were merged (Figure 4B). From the module correlation analysis, the pink module with the strongest positive correlation with hepatic fibrosis and the blue module with the strongest negative correlation with this disease were selected, and the genes from these two modules were extracted (Figure 4C and D). Genes that were both module-related and present in the FRDEGs list included IL1B, GSTZ1, LIFR, SLC25A37, PTGS2, MT1G, HSPB1, ESR1, and PHGDH, which were identified as the core genes in this study.
 |
Figure 4 WGCNA analysis of the data. (A) Determination of the optimal soft thresholding power. (B) Construction of co-expression matrix and visualization of the modules. (C) Correlation analysis between modules. (D) Correlation analysis between modules and liver fibrosis. |
Machine Learning Validating the Core Genes in Liver Fibrosis
After identifying the nine core genes, we further validated them using both RF and SVM machine learning methods. Firstly, the RF method was used to construct a model based on these nine genes (Figure 5A and B). The model exhibited significant differential expression between the liver fibrosis and normal groups, while also demonstrating a good ability to predict the occurrence of this disease (Figure 5C and D). In addition, the model built by the SVM method using these nine genes also showed good diagnostic performance (Figure 5E and F). More importantly, the individual AUC values for each of these nine genes were all greater than 0.8, indicating that each gene individually showed considerable potential for diagnosing liver fibrosis (Figure 6). Thus, the nine core genes, IL1B, GSTZ1, LIFR, SLC25A37, PTGS2, MT1G, HSPB1, ESR1, and PHGDH deserve significant attention in the context of hepatic fibrosis.
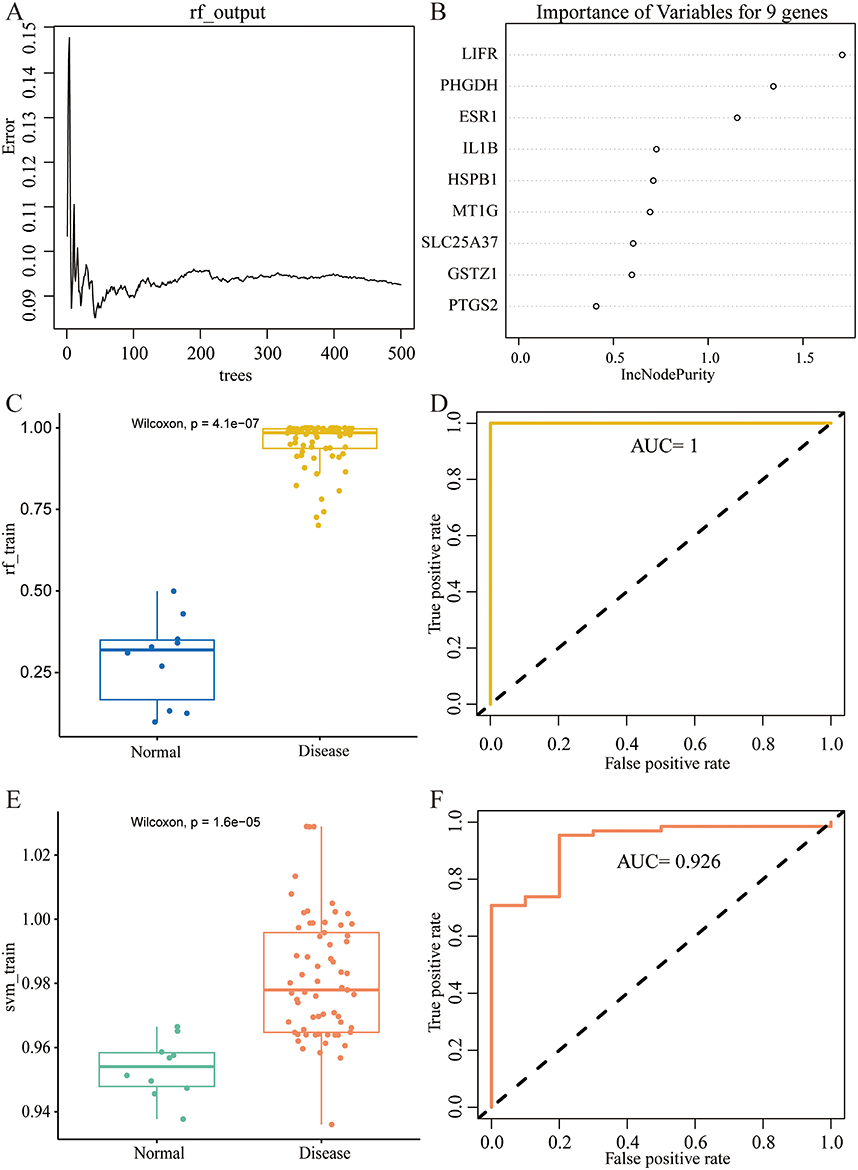 |
Figure 5 RF and SVM analysis. (A) RF prediction error curves based on 10-fold cross-validation. (B) The significance of the nine core genes determined by the RF model. (C and D) The boxplot and ROC of the model constructed by RF. (E and F) The boxplot and ROC of the model constructed by SVM. |
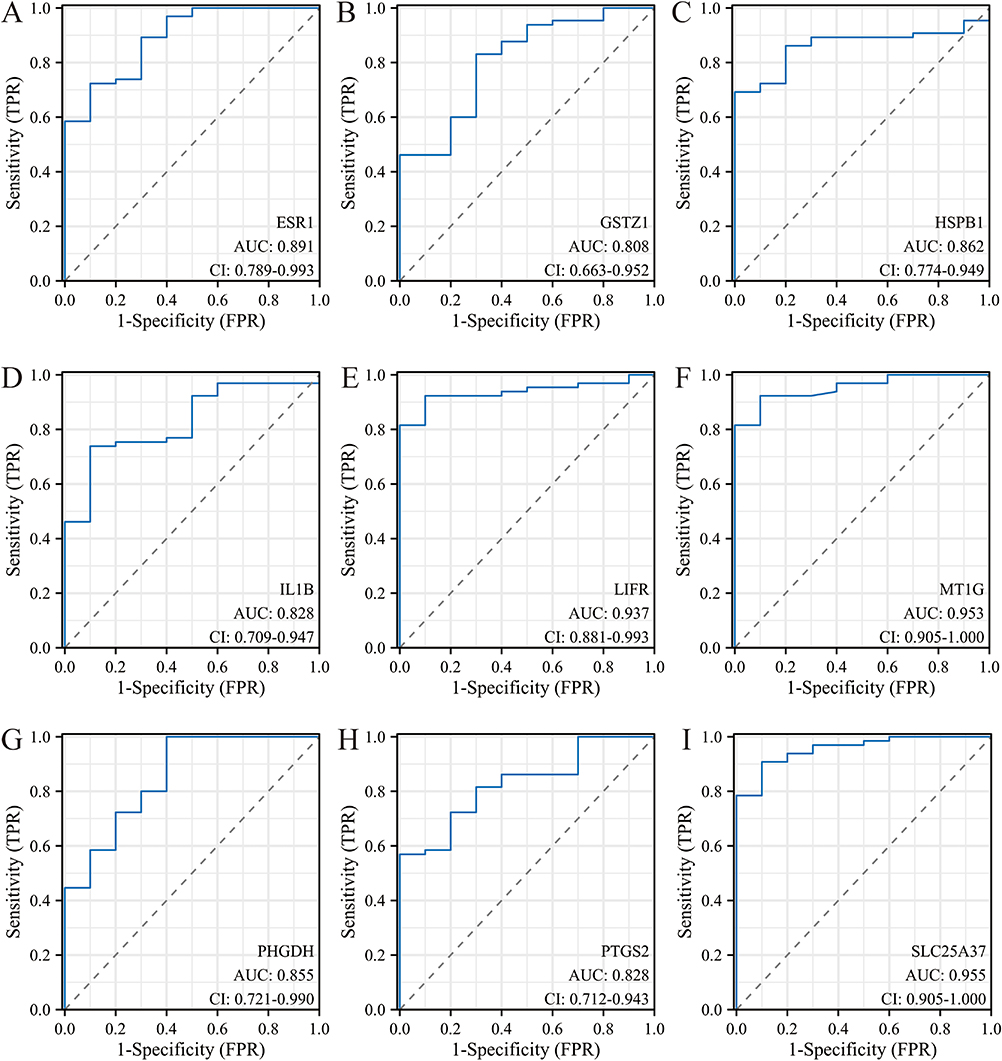 |
Figure 6 ROC analysis of the core genes. (A–I) The AUC of nine core genes include ESR1 (A), GSTZ1 (B), HSPB1 (C), IL1B (D), LIFR (E), MT1G (F), PHGDH (G), PTGS2 (H), and SLC25A37 (I). |
Immune Analysis of DEGs Between the Normal and Liver Fibrosis Groups
The liver is a vital immune organ in the human body, and the progression of liver fibrosis undoubtedly involves the collaborative effects of many immune cells. Previously, GSEA performed on DEGs revealed that many of the enriched biological processes were immune-related pathways, further emphasizing the significance of immunity. In this part, we further analyzed the immune cell infiltration in the normal and disease groups. As shown in Figure 7A, the proportion of immune cell infiltration in each sample of the dataset was displayed, with macrophages constituting a significant portion in each sample. The correlation analysis between immune cells indicated that there was a close relationship among immune cells, which collectively contribute to liver fibrosis (Figure 7B). Among them, the notable correlations included the positive correlation between macrophages M0 and activated mast cells (r = 0.529, P < 0.001) and the positive correlation between activated mast cells and resting mast cells (r = 0.717, P < 0.001) (Figure 7C). Compared to the normal group, the disease group exhibited higher infiltration abundances of macrophages M1, plasma cells, and T cells CD4 memory resting, and lower abundances of macrophages M2, activated mast cells, neutrophils, T cells follicular helper, and monocytes (Figure 7D).
 |
Figure 7 Immune analysis of DEGs between the normal and liver fibrosis groups. (A) Immune cell infiltration for each sample in GSE6764. The x-axis represents each sample, and the y-axis indicates the percentage of immune cell infiltration. (B) Heatmap of the correlation analysis between immune cells. (C) Lollipop plot of the correlation analysis between activated mast cells and other immune cells. (D) Differential expression of immune cells between the normal and liver fibrosis groups. *P<0.05, **P<0.01 and ***P<0.001. |
Immune Analysis of the Core Genes and Immune Cells
The nine core genes are crucial for the ferroptosis-related signaling in hepatic fibrosis. To explore their interactions with immune cells, a series of correlation analyses were performed. The core genes were closely associated with many immune cells and based on a cutoff of r > 0.500 and P < 0.001, several groups with strong correlations were identified (Figure 8A). Among them, activated mast cells showed positive correlations with ESR1, IL1B, GSTZ1, and MT1G; macrophages M0 exhibited a positive correlation with HSPB1; neutrophils demonstrated positive correlations with both IL1B and MT1G (Figure 8B–H). Thus, the core genes interact with immune cells, including activated mast cells, macrophages M0, and neutrophils, thereby influencing the liver’s immune response.
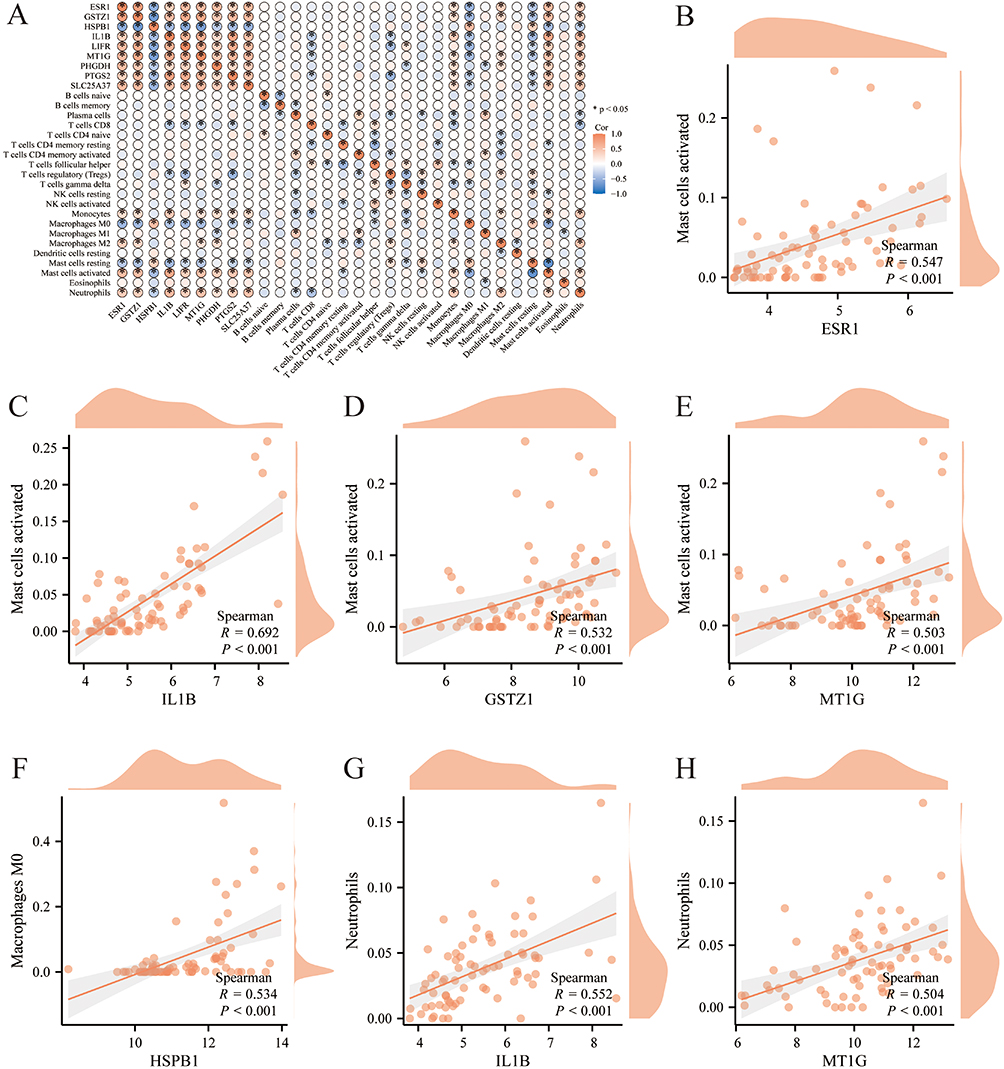 |
Figure 8 Immune analysis of the core genes and immune cells. (A) Heatmap of the correlation analysis between the core genes and immune cells. *P<0.05. (B–H) Matches with high correlation coefficients were selected for display. (B) ESR1 and activated mast cells; (C) IL1B and activated mast cells; (D) GSTZ1 and activated mast cells; (E) MT1G and activated mast cells; (F) HSPB1 and macrophages M0; (G) IL1B and neutrophils; (H) MT1G and neutrophils. |
Expressions of the Core Genes in Mice with Hepatic Fibrosis
To validate the bioinformatics results, we conducted in vivo experiments. As shown in Figure 9A, in the normal group, the liver boundary was clear and the surface was smooth, while in the disease group, the sample surface was rough with many granules. Meanwhile, compared to the normal group, the liver fibrosis group exhibited a higher abundance of collagen fiber bundles, thus confirming the successful establishment of the fibrosis model (Figure 9B). AST, ALT, and inflammatory markers are also key indicators for assessing hepatic fibrosis. The model group exhibited higher AST, ALT activities, and IL-6 and IL-1β levels, suggesting a greater degree of liver damage in the model group (Figure 9E and F). GPX4 and SLC7A11 are characteristic markers of ferroptosis. Compared to the normal group, the levels of GPX4 and SLC7A11 were lower in the liver fibrosis group, suggesting an increased degree of hepatocyte ferroptosis during liver fibrosis (Figure 9D). In terms of expression validation, only ESR1 and GSTZ1 among the nine core genes showed significant differential expression (P<0.01) and were identified as protective genes for liver fibrosis (Figure 9C). The protein expression of ESR1 and GSTZ1 mirrored the pattern observed in their mRNA expression (Figure 10E and F). Meanwhile, we also examined the expression levels of ESR1 and GSTZ1 in the test and validation sets. The results showed that ESR1 and GSTZ1 were significantly under-expressed in the liver fibrosis groups of GSE6467 and GSE188604, which is consistent with previous findings (Figure 10A–D). After literature review, it was found that ESR1 and GSTZ1 have not been reported in liver fibrosis, indicating that ESR1 and GSTZ1 are worth further investigation.
 |
Figure 9 Expressions of the core genes in mice with hepatic fibrosis. (A) Appearance of mouse liver tissue. (B) Sirius red staining of mouse liver tissue (40X). (C) The mRNA levels of the nine core genes in mouse liver tissue. (D) The mRNA levels of GPX4 and SLC7A11 in mouse liver tissue. (E) The activities of AST and ALT in mouse serum. (F) The levels of IL-6 and IL-1β in mouse liver tissue. **P<0.01 and ***P<0.001. |
 |
Figure 10 Expressions of the core genes in test set and validation set. (A and B) The mRNA levels of ESR1 and GSTZ1 in GSE6467, respectively. (C and D) The mRNA levels of ESR1 and GSTZ1 in GSE188604, respectively. (E and F) The protein levels of ESR1 and GSTZ1 in mouse liver tissue, respectively. **P<0.01 and ***P<0.001. |
Analysis of the Core Genes in HCC
Liver fibrosis is difficult to diagnose and is prone to progress into malignant tumors, with patients often discovering their illness when it has already advanced to HCC. We discovered that these two innovative core genes, ESR1 and GSTZ1, not only showed differential expression in liver fibrosis but also had diagnostic significance in HCC. Compared to normal human liver tissue, the HCC group exhibited low expression of GSTZ1 and ESR1 (P<0.001), and this was also validated in paired samples (Figure 11A, B, E and F). In terms of protein expression, when compared to the normal group, the protein expression levels of GSTZ1 and ESR1 were lower in the tumor group, which is consistent with the mRNA results of GSTZ1 and ESR1 (Figure 11D and H). These results suggested that ESR1 and GSTZ1 may serve as protective markers in HCC. ROC analysis showed that the area under the curve for GSTZ1 and ESR1 was 0.901 and 0.916, respectively, demonstrating high diagnostic accuracy in HCC (Figure 11C and G). In cellular experiments, the levels of ESR1 and GSTZ1 were lower in cancer cells than in normal cells (Figure S1). Therefore, the above results show that the abnormal expression of GSTZ1 and ESR1 can indicate the progression of hepatic fibrosis in patients, and they can also serve as diagnostic markers for HCC, which holds significant clinical guidance.
 |
Figure 11 Analysis of the core genes in HCC. (A) Differential expression of GSTZ1 in HCC. (B) Analysis of GSTZ1 in paired samples in HCC. (C) ROC curve of GSTZ1. (D) Expression of GSTZ1 protein levels in human tissue samples. (E) Differential expression of ESR1 in HCC. (F) Analysis of ESR1 in paired samples in HCC. (G) ROC curve of ESR1. (H) Expression of ESR1 protein levels in human tissue samples. ***P<0.001. |
Discussion
Over the recent several decades, the incidence of liver disease has seen a sharp rise, emerging as a predominant factor contributing to global mortality and morbidity.27 Liver fibrosis is one of the common liver diseases and can easily progress to cirrhosis, making early intervention crucial.28 It has long been suggested that increased iron levels contribute to the risk of hepatic fibrosis, and recent findings have provided direct support for the role of ferroptosis in the pathogenesis of liver damage and fibrosis resulting from iron overload.29 Recent researches indicate the feasibility of triggering ferroptosis in hepatic stellate cells using magnesium isoglycyrrhizinate, artesunate, or artemether as a therapeutic strategy designed to alleviate the progression of hepatic fibrosis.30,31 Furthermore, specific regulators of ferroptosis within hepatic stellate cells, such as p53, ELAVL1, and ZFP36, have been identified as promising targets for the prevention of hepatic fibrosis32,33 (Table S3). These studies suggest that triggering ferroptosis in hepatic stellate cells could be a promising approach for both treating and preventing liver fibrosis. If detected and intervened in a timely manner, liver fibrosis is a reversible process,34 indicating that early diagnosis is of great importance. Ferroptosis plays a significant role in liver fibrosis;29 however, the genetic characteristics of ferroptosis in hepatic fibrosis have not been studied until now. This research can fill this gap.
Firstly, the FRDEGs were obtained, and enrichment analysis suggested that these genes were primarily enriched in processes related to collagen deposition and immune infiltration. Subsequently, multiple machine learning methods were employed to identify and validate the core genes among the FRDEGs that play significant roles in liver fibrosis. After constructing a mouse model of hepatic fibrosis, the differential expression of the core genes was further validated within the model, and two genes, GSTZ1 and ESR1, were further identified as potential biomarkers for this disease. Notably, more in-depth research has found that GSTZ1 and ESR1, similar to their role in hepatic fibrosis, also exhibit a good diagnostic performance in HCC. This study not only identifies the characteristics of ferroptosis-related genes in liver fibrosis but also, given the high likelihood of hepatic fibrosis progressing to HCC, establishes a bridge for sensitive diagnostics between liver fibrosis and HCC.
The immune cell landscape in liver fibrosis is complex and involves various immune cell subtypes that play critical roles in the progression and resolution of the disease. The immune analysis conducted in this study revealed significant differences in immune cell infiltration between the normal and liver fibrosis groups, primarily involving macrophages, neutrophils, and mast cells, which is consistent with previous findings that immune cells play a crucial role in the progression of hepatic fibrosis. Following liver damage, a considerable number of mast cells migrate to the liver, and blocking mast cell accumulation can mitigate liver fibrosis.35 Neutrophils, the most plentiful type of granulocyte in the bloodstream, are a critical connection between innate and adaptive immune responses. They contribute to the development of liver fibrosis through processes including degranulation, the production of ROS, and the secretion of various cytokines and chemokines.36 Macrophages, which can be classified into M1 and M2 subtypes, also play significant roles in liver fibrosis. M1 macrophages are involved in immune surveillance, and the polarization towards M1 and the associated inflammation can promote the progression of hepatic fibrosis.37 M2 macrophages exert an anti-inflammatory effect, and an imbalance between M1 and M2 macrophages can affect the extent of fibrosis.38 Macrophages and hepatic stellate cells have a close interaction that jointly promotes fibrosis and HCC. Specifically, macrophages can stimulate the proliferation of hepatic stellate cells and their migration to lesion sites, producing ECM and increasing the degree of liver fibrosis. At the same time, macrophages and ECM promote cancer-associated fibroblasts to secrete cytokines and growth factors, which facilitate tumor growth.39 The association of core genes, ESR1 and GSTZ1, with immune cell infiltration indicates their potential role in regulating the immune response during fibrosis, thereby providing further evidence for the participation of immune regulation in the development of liver fibrosis.
Estrogen receptor 1 (ESR1) is a gene encoding the estrogen receptor, which is a nuclear hormone receptor involved in the regulation of various physiological processes, including reproductive and metabolic functions. Thus far, no research has been published examining the involvement of ESR1 in liver fibrosis. Actually, sex hormones play a crucial role in liver metabolism, and variations in sex hormone levels are identified as significant factors contributing to the occurrence of hepatic disease.40 Despite the lack of investigations into ESR1’s role in liver fibrosis, the gene has been examined in the context of other liver pathologies. ESR1 has been found to modulate hepatocyte apoptosis and inflammation41 and is considered a therapeutic target for addressing liver fat metabolism and endocrine regulation through the use of combined traditional Chinese herbal preparations.42,43 Additionally, another study discovers that ESR1 gene polymorphisms could influence the response to antiviral therapy in HCV patients, further highlighting its potential role in liver disease.44 In the present study, both bioinformatics analysis and animal experiments confirm that ESR1 is significantly downregulated in hepatic fibrosis. Given that liver fibrosis can easily progress to malignant tumor, further research has indicated that ESR1 also acts as a protective gene in HCC. Published research has indicated that ESR1 modulates the obesity- and metabolism-associated gene MMAA to suppress the onset and progression of HCC,45 a finding that further validates our research outcomes. The above indicates that the expression of this gene is consistent in both diseases, and a persistent decrease in ESR1 in patients may signal the progression from liver fibrosis to HCC.
In addition to ESR1, GSTZ1 is also a novel gene newly discovered in this study to be associated with liver fibrosis. Glutathione S-transferase zeta 1 (GSTZ1) is a member of the glutathione transferase family and is involved in the detoxification of a variety of endogenous and exogenous compounds. The liver exhibits a high expression of GSTZ1, and when this gene is not properly regulated, it can result in the impairment of normal liver function.46 A study by Chen et al identifies GSTZ1 as one of the immune-related protective genes in the progression of HCV,47 which supports the role of GSTZ1 in liver immunity as found in our research. In the current investigation, GSTZ1 not only exhibits a good predictive role for disease progression in liver fibrosis but also demonstrates significant diagnostic value in HCC. The tumor-suppressing role of GSTZ1 in HCC has been confirmed by many studies,48,49 which is consistent with our research findings. Concurrently, GSTZ1 increases the vulnerability of HCC cells to sorafenib-induced ferroptosis by suppressing the NRF2/GPX4 pathway,50 illustrating the critical role of the ferroptosis pathway in the liver-protective effects of GSTZ1. These findings provide new insights into the molecular mechanisms underlying liver fibrosis and highlight GSTZ1 as a potential target for future therapeutic strategies.
Heat shock protein family B (small) member 1 (HSPB1) belongs to the small heat shock protein family and is involved in a variety of biological processes, including thermotolerance, inhibition of apoptosis, regulation of cell development and differentiation, as well as signal transduction. Hepatocytes expose to ethanol stress release HSPB1 into the extracellular milieu, triggering inflammation that subsequently leads to alcoholic hepatitis.51 HSPB1 can alleviate liver damage induced by chronic liver failure in vivo and inhibit LPS-induced hepatocyte injury in vitro, suggesting that HSPB1 may be a novel target for the treatment of chronic liver failure.52 HSPB1 has been found to restore immune dysregulation in hepatocytes in HCC.53 HSPB1 can alleviate hepatocyte EMT, which may be a potential mechanism by which HSPB1 reduces liver fibrosis and HCC, and this warrants more comprehensive research in the future.54 IL1B encodes the Interleukin-1β (IL1β) protein, which is a regulatory molecule of liver inflammation. Hepatic stellate cells cause an increase in IL-1β secretion and α-smooth muscle actin expression by phagocytosing extracellular NLRP3 inflammasome particles, further exacerbating the damage to the fibrotic liver.55,56 IL1β is considered to regulate various forms of cell death, including ferroptosis, and as an important player, it controls the complex crosstalk involved in ECM deposition during the progression and regression of liver fibrosis.57,58
Despite the comprehensive approach and significant findings, this study has several limitations. On the one hand, future research will need to be conducted within large, multicenter datasets or populations affected by liver fibrosis; on the other hand, the lack of clinical validation further restricts the practical application of our findings in real-world scenarios.
In summary, this study is the first to investigate the ferroptosis-related gene signature in liver fibrosis and has identified two novel protective genes, ESR1 and GSTZ1, providing new insights into the pathogenesis of this disease. Furthermore, the good diagnostic performance of ESR1 and GSTZ1 in both HCC and liver fibrosis highlights their clinical value and potential for further applications in liver diseases. This study suggests that targeting ESR1 and GSTZ1 to regulate ferroptosis may be a potential approach for the treatment of hepatic fibrosis. In the future, more clinical samples will be used to further validate the correlation between ferroptosis and liver fibrosis, and to verify the protective effects of these two genes on liver fibrosis and HCC.
Data Sharing Statement
The datasets presented in this study can be found in online repositories. The names of the repository/repositories and accession number(s) can be found in the article.
Ethics Approval and Consent to Participate
The present study using the TCGA and GEO databases was approved by the Ethics Committee of Liuzhou Workers Hospital. The ethical statement number is KY2024556. The animal study was approved by the Animal Care & Welfare Committee of Guangxi Medical University. The study was conducted in accordance with the “Guiding Opinions on the Kind Treatment of Laboratory Animals” issued by the Ministry of Science and Technology of the People’s Republic of China and the national standard of the People’s Republic of China GB/T35892-2018 “Guidelines for Ethical Review of Laboratory Animal Welfare”.
Funding
This work was supported by the National Natural Science Foundation of China (No. 81960767), the Natural Science Foundation of Guangxi (No. 2023GXNSFBA026334) and the Liuzhou Science and Technology Project (No. 2024YB0101A010).
Disclosure
This research was conducted in the absence of any commercial or financial relationships that could be construed as a potential conflict of interest.
References
1. Bao YL, Wang L, Pan HT. et al. Animal and organoid models of liver fibrosis. Front Physiol. 2021;12:666138. doi:10.3389/fphys.2021.666138
2. Younossi ZM, Wong G, Anstee QM, Henry L. The global burden of liver disease. Clin Gastroenterol Hepatol. 2023;21:1978–1991. doi:10.1016/j.cgh.2023.04.015
3. Moon H, Cho K, Shin S, Kim DY, Han KH, Ro SW. High risk of hepatocellular carcinoma development in fibrotic liver: role of the Hippo-YAP/TAZ signaling pathway. Int J Mol Sci. 2019;20:581. doi:10.3390/ijms20030581
4. Li S, Hu X, Yu S, et al. Hepatic stellate cell-released CXCL1 aggravates HCC malignant behaviors through the MIR4435-2HG/miR-506-3p/TGFB1 axis. Cancer Sci. 2023;114:504–520. doi:10.1111/cas.15605
5. Ballestri S, Mantovani A, Baldelli E, et al. Liver fibrosis biomarkers accurately exclude advanced fibrosis and are associated with higher cardiovascular risk scores in patients with NAFLD or viral chronic liver disease. Diagnostics. 2021;11:98. doi:10.3390/diagnostics11010098
6. Lee YS, Seki E. In vivo and in vitro models to study liver fibrosis: mechanisms and limitations. cellular and molecular gastroenterology and hepatology. CMGH. 2023;16:355–367. doi:10.1016/j.jcmgh.2023.05.010
7. Zhou Z, Gao A, Zhang Q, Wu W, Wu S, Tsui PH. Ultrasound backscatter envelope statistics parametric imaging for liver fibrosis characterization: a review. Ultrason Imaging. 2020;42:92–109. doi:10.1177/0161734620907886
8. Zhang YN, Fowler KJ, Ozturk A, et al. Liver fibrosis imaging: a clinical review of ultrasound and magnetic resonance elastography. J Magn Reson Imaging. 2020;51:25–42. doi:10.1002/jmri.26716
9. Tamber SS, Bansal P, Sharma S, Singh RB, Sharma R. Biomarkers of liver diseases. Molecular Biol Rep. 2023;50:7815–7823. doi:10.1007/s11033-023-08666-0
10. Liu G, Wei C, Yuan S, et al. Wogonoside attenuates liver fibrosis by triggering hepatic stellate cell ferroptosis through SOCS1/P53/SLC7A11 pathway. Phytother Res. 2022;36:4230–4243. doi:10.1002/ptr.7558
11. Yu Y, Yan Y, Niu F, et al. Ferroptosis: a cell death connecting oxidative stress, inflammation and cardiovascular diseases. Cell Death Discovery. 2021;7:193. doi:10.1038/s41420-021-00579-w
12. Li C, Deng X, Xie X, Liu Y, Friedmann Angeli JP, Lai L. Activation of glutathione peroxidase 4 as a novel anti-inflammatory strategy. Front Pharmacol. 2018;9:1120. doi:10.3389/fphar.2018.01120
13. Li L, Zhu Z. Pharmacological modulation of ferroptosis as a therapeutic target for liver fibrosis. Front Pharmacol. 2022;13:1071844. doi:10.3389/fphar.2022.1071844
14. Wu A, Feng B, Yu J, et al. Fibroblast growth factor 21 attenuates iron overload-induced liver injury and fibrosis by inhibiting ferroptosis. Redox Biol. 2021;46:102131. doi:10.1016/j.redox.2021.102131
15. Su W, Gao W, Zhang R, et al. TAK1 deficiency promotes liver injury and tumorigenesis via ferroptosis and macrophage cGAS-STING signalling. JHEP Rep. 2023;5:100695. doi:10.1016/j.jhepr.2023.100695
16. Liu Y, Tingart M, Lecouturier S, Li J, Eschweiler J. Identification of co-expression network correlated with different periods of adipogenic and osteogenic differentiation of BMSCs by weighted gene co-expression network analysis (WGCNA). BMC Genomics. 2021;22:254. doi:10.1186/s12864-021-07584-4
17. Xu M, Zhou H, Hu P, et al. Identification and validation of immune and oxidative stress-related diagnostic markers for diabetic nephropathy by WGCNA and machine learning. Front Immunol. 2023;14:1084531. doi:10.3389/fimmu.2023.1084531
18. Jiang H, Zhang X, Wu Y, et al. Bioinformatics identification and validation of biomarkers and infiltrating immune cells in endometriosis. Front Immunol. 2022;13:944683. doi:10.3389/fimmu.2022.944683
19. Davis S, Meltzer PS. GEOquery: a bridge between the Gene Expression Omnibus (GEO) and BioConductor. Bioinformatics. 2007;23:1846–1847. doi:10.1093/bioinformatics/btm254
20. Ritchie ME, Phipson B, Wu D, et al. limma powers differential expression analyses for RNA-sequencing and microarray studies. Nucleic Acids Res. 2015;43:e47. doi:10.1093/nar/gkv007
21. Zhou N, Yuan X, Du Q, et al. FerrDb V2: update of the manually curated database of ferroptosis regulators and ferroptosis-disease associations. Nucleic Acids Res. 2023;51:D571–d582. doi:10.1093/nar/gkac935
22. Chang K, Yuan C, Liu X. Ferroptosis-related gene signature accurately predicts survival outcomes in patients with clear-cell renal cell carcinoma. Front Oncol. 2021;11:649347. doi:10.3389/fonc.2021.649347
23. Zhang B, Horvath S. A general framework for weighted gene co-expression network analysis. Statistical applications in genetics and molecular biology. Stat Appl Gen Mol Biol. 2005;4:Article17. doi:10.2202/1544-6115.1128
24. Yu G, Wang LG, Han Y, He QY. clusterProfiler: an R package for comparing biological themes among gene clusters. Omics. 2012;16:284–287. doi:10.1089/omi.2011.0118
25. Huang Y, Luo W, Yang Z, Lan T, Wei X, Wu H. Machine learning and experimental validation identified autophagy signature in hepatic fibrosis. Front Immunol. 2024;15:1337105. doi:10.3389/fimmu.2024.1337105
26. Bell HN, Stockwell BR, Zou W. Ironing out the role of ferroptosis in immunity. Immunity. 2024;57:941–956.
27. Han B, Li J, Li S, Liu Y, Zhang Z. Effects of thiacloprid exposure on microbiota-gut-liver axis: multiomics mechanistic analysis in Japanese quails. J Hazard Mater. 2023;442:130082. doi:10.1016/j.jhazmat.2022.130082
28. Li J, Guo C, Liu Y, et al. Chronic arsenic exposure-provoked biotoxicity involved in liver-microbiota-gut axis disruption in chickens based on multi-omics technologies. J Adv Res. 2024.
29. Chen J, Li X, Ge C, Min J, Wang F. The multifaceted role of ferroptosis in liver disease. Cell Death Differ. 2022;29:467–480.
30. Sui M, Jiang X, Chen J, Yang H, Zhu Y. Magnesium isoglycyrrhizinate ameliorates liver fibrosis and hepatic stellate cell activation by regulating ferroptosis signaling pathway. Biomed Pharmacother. 2018;106:125–133. doi:10.1016/j.biopha.2018.06.060
31. Kong Z, Liu R, Cheng Y. Artesunate alleviates liver fibrosis by regulating ferroptosis signaling pathway. Biomed Pharmacother. 2019;109:2043–2053. doi:10.1016/j.biopha.2018.11.030
32. Zhang Z, Yao Z, Wang L, et al. Activation of ferritinophagy is required for the RNA-binding protein ELAVL1/HuR to regulate ferroptosis in hepatic stellate cells. Autophagy. 2018;14:2083–2103. doi:10.1080/15548627.2018.1503146
33. Zhang Z, Guo M, Li Y, et al. RNA-binding protein ZFP36/TTP protects against ferroptosis by regulating autophagy signaling pathway in hepatic stellate cells. Autophagy. 2020;16:1482–1505. doi:10.1080/15548627.2019.1687985
34. Kisseleva T, Brenner D. Molecular and cellular mechanisms of liver fibrosis and its regression. Nat Rev Gastroenterol Hepatol. 2021;18:151–166.
35. Kyritsi K, Kennedy L, Meadows V, et al. Mast cells induce Ductular reaction mimicking liver injury in mice through mast cell-derived transforming growth factor beta 1 signaling. Hepatology. 2021;73:2397–2410. doi:10.1002/hep.31497
36. Huang C, Fan X, Shen Y, Shen M, Yang L. Neutrophil subsets in noncancer liver diseases: cellular crosstalk and therapeutic targets. Eur J Immunol. 2023;53:e2250324. doi:10.1002/eji.202250324
37. Rao J, Wang H, Ni M, et al. FSTL1 promotes liver fibrosis by reprogramming macrophage function through modulating the intracellular function of PKM2. Gut. 2022;71:2539–2550. doi:10.1136/gutjnl-2021-325150
38. Wang Z, Du K, Jin N, Tang B, Zhang W. Macrophage in liver Fibrosis: identities and mechanisms. Int Immunopharmacol. 2023;120:110357. doi:10.1016/j.intimp.2023.110357
39. Matsuda M, Seki E. Hepatic stellate cell-macrophage crosstalk in liver fibrosis and carcinogenesis. Semin Liver Dis. 2020;40:307–320.
40. Kur P, Kolasa-Wołosiuk A, Misiakiewicz-Has K, Wiszniewska B. Sex hormone-dependent physiology and diseases of liver. Int J Environ Res Public Health. 2020;17. doi:10.3390/ijerph17082620
41. Wu K, Ma L, Xu T, et al. Transcription factor YY1 ameliorates liver ischemia-reperfusion injury through modulating the miR-181a-5p/ESR1/ERBB2 axis. Transplantation. 2023;107:878–889. doi:10.1097/TP.0000000000004356
42. Jia Z, Yang F, Liu X, Zhang X, Hu W, Sheng Z. The n-butanol fraction of the Xiao-Chai-Hu decoction alleviates the endocrine disturbance in the liver of mice exposed to lead. J Ethnopharmacol. 2021;279:114381.
43. Cao Z, Zeng Z, Wang B, et al. Identification of potential bioactive compounds and mechanisms of GegenQinlian decoction on improving insulin resistance in adipose, liver, and muscle tissue by integrating system pharmacology and bioinformatics analysis. J Ethnopharmacol. 2021;264:113289. doi:10.1016/j.jep.2020.113289
44. Xie J, Ding Y, Li X, et al. Association of ESR1 gene polymorphisms with the susceptibility to Hepatitis B virus infection and the clinical outcomes. J med virol. 2023;95:e28510. doi:10.1002/jmv.28510
45. Zhang Y, Cheng J, Zhong C, et al. ESR1 regulates the obesity- and metabolism-differential gene MMAA to inhibit the occurrence and development of hepatocellular carcinoma. Front Oncol. 2022;12:899969. doi:10.3389/fonc.2022.899969
46. Stacpoole PW. Clinical physiology and pharmacology of GSTZ1/MAAI. Biochem Pharmacol. 2023;217:115818.
47. Chen C, Cai H, Shen J, et al. Exploration of a hypoxia-immune-related microenvironment gene signature and prediction model for hepatitis C-induced early-stage fibrosis. J Transl Med. 2024;22:116.
48. Yang F, Li J, Deng H, et al. GSTZ1-1 deficiency activates NRF2/IGF1R axis in HCC via accumulation of oncometabolite succinylacetone. EMBO J. 2019;38:e101964.
49. Li J, Wang Q, Yang Y, et al. GSTZ1 deficiency promotes hepatocellular carcinoma proliferation via activation of the KEAP1/NRF2 pathway. J Exp Clin Cancer Res. 2019;38:438. doi:10.1186/s13046-019-1459-6
50. Wang Q, Bin C, Xue Q, et al. GSTZ1 sensitizes hepatocellular carcinoma cells to sorafenib-induced ferroptosis via inhibition of NRF2/GPX4 axis. Cell Death Dis. 2021;12:426. doi:10.1038/s41419-021-03718-4
51. Overstreet AC, Burge M, Bellar A, et al. Evidence that extracellular HSPB1 contributes to inflammation in alcohol-associated hepatitis. medRxiv Preprint Server Health Sci. 2024.
52. Zhang Z, Guo J, Zhu J. HSPB1 alleviates acute-on-chronic liver failure via the P53/Bax pathway. Open Life Sci. 2024;19:20220919. doi:10.1515/biol-2022-0919
53. Long S, Peng F, Song B, Wang L, Chen J, Shang B. Heat Shock Protein Beta 1 is a Prognostic Biomarker and Correlated with Immune Infiltrates in Hepatocellular Carcinoma. Int J Gene Med. 2021;14:5483–5492. doi:10.2147/IJGM.S330608
54. Zhang XL, Zhang XY, Ge XQ, Liu MX. Mangiferin prevents hepatocyte epithelial-mesenchymal transition in liver fibrosis via targeting HSP27-mediated JAK2/STAT3 and TGF-β1/Smad pathway. Phytother Res. 2022;36:4167–4182. doi:10.1002/ptr.7549
55. Gaul S, Leszczynska A, Alegre F, et al. Hepatocyte pyroptosis and release of inflammasome particles induce stellate cell activation and liver fibrosis. J Hepatol. 2021;74:156–167. doi:10.1016/j.jhep.2020.07.041
56. Lv T, Fan X, He C, et al. SLC7A11-ROS/αKG-AMPK axis regulates liver inflammation through mitophagy and impairs liver fibrosis and NASH progression. Redox Biol. 2024;72:103159. doi:10.1016/j.redox.2024.103159
57. Schuppan D, Surabattula R, Wang XY. Determinants of fibrosis progression and regression in NASH. J Hepatol. 2018;68:238–250. doi:10.1016/j.jhep.2017.11.012
58. Li H, Wang X, Pan H, et al. The mechanisms and functions of IL-1β in intervertebral disc degeneration. Exp Gerontology. 2023;177:112181. doi:10.1016/j.exger.2023.112181
 © 2024 The Author(s). This work is published and licensed by Dove Medical Press Limited. The
full terms of this license are available at https://www.dovepress.com/terms.php
and incorporate the Creative Commons Attribution
- Non Commercial (unported, 3.0) License.
By accessing the work you hereby accept the Terms. Non-commercial uses of the work are permitted
without any further permission from Dove Medical Press Limited, provided the work is properly
attributed. For permission for commercial use of this work, please see paragraphs 4.2 and 5 of our Terms.
© 2024 The Author(s). This work is published and licensed by Dove Medical Press Limited. The
full terms of this license are available at https://www.dovepress.com/terms.php
and incorporate the Creative Commons Attribution
- Non Commercial (unported, 3.0) License.
By accessing the work you hereby accept the Terms. Non-commercial uses of the work are permitted
without any further permission from Dove Medical Press Limited, provided the work is properly
attributed. For permission for commercial use of this work, please see paragraphs 4.2 and 5 of our Terms.
Recommended articles
Identification of Ferroptosis-Related Biomarkers for Diagnosis and Molecular Classification of Staphylococcus aureus-Induced Osteomyelitis
Shi X, Tang L, Ni H, Li M, Wu Y, Xu Y
Journal of Inflammation Research 2023, 16:1805-1823
Published Date: 26 April 2023
Programmed Cell Death in Liver Fibrosis
Gao R, Tang H, Mao J
Journal of Inflammation Research 2023, 16:3897-3910
Published Date: 1 September 2023