")
Back to Journals » Journal of Inflammation Research » Volume 18
Machine Learning and Experimental Validation Reveal MYH11 as a Novel Prognostic Biomarker and Therapeutic Target in Bladder Cancer
Authors Tan Z , Chen X, Fu S, Huang Y, Li H, Gong C, Lv D, Yang C, Wang J, Ding M, Wang H
Received 16 February 2025
Accepted for publication 5 June 2025
Published 25 June 2025 Volume 2025:18 Pages 8357—8387
DOI https://doi.org/10.2147/JIR.S519719
Checked for plagiarism Yes
Review by Single anonymous peer review
Peer reviewer comments 2
Editor who approved publication: Dr Subhasis Chattopadhyay
Zhiyong Tan,1– 3,* Xiaorong Chen,4,* Shi Fu,1– 3,* Yinglong Huang,1– 3,* Haihao Li,1– 3,* Chen Gong,1– 3 Dihao Lv,1– 3 Chadanfeng Yang,1– 3 Jiansong Wang,1– 3 Mingxia Ding,1– 3 Haifeng Wang1– 3
1Department of Urology, The Second Affiliated Hospital of Kunming Medical University, Kunming, Yunnan, People’s Republic of China; 2Urological Disease Clinical Medical Center of Yunnan Province, The Second Affiliated Hospital of Kunming Medical University, Kunming, Yunnan, People’s Republic of China; 3Scientific and Technological Innovation Team of Basic and Clinical Research of Bladder Cancer in Yunnan Universities, The Second Affiliated Hospital of Kunming Medical University, Kunming, Yunnan, People’s Republic of China; 4Department of Kidney Transplantation, The Third Hospital of Sun Yat-Sen University, Guangzhou, People’s Republic of China
*These authors contributed equally to this work
Correspondence: Mingxia Ding, Department of Urology, The Second Affiliated Hospital of Kunming Medical University, Kunming, Yunnan, People’s Republic of China, Email [email protected] Haifeng Wang, Department of Urology, The Second Affiliated Hospital of Kunming Medical University, Kunming, Yunnan, People’s Republic of China, Email [email protected]
Introduction: Bladder cancer (BCa) is one of the top ten most common cancers, yet its underlying mechanisms remain unclear. This study aimed to explore the potential molecular mechanisms of BCa using multi-omics and single-cell analysis.
Methods: First, differential analysis of transcriptome data related to BCa from public databases was performed, and a risk model was then developed using 101 different machine learning algorithms to determine prognostic genes, followed by independent prognostic analysis to construct a nomogram. Immune infiltration analysis was performed to explore the impact of prognostic genes on the tumor microenvironment. Metabolomics, proteomics, and post-translational modification data from BCa tumor and adjacent non-tumor tissues were used to explore the relationships between prognostic genes and various omics levels. Finally, single-cell analysis identified key cells involved in BCa pathogenesis, and in vitro experiments validated the expression and function of key genes.
Results: The risk model constructed by 8 prognostic genes identified using 101 algorithms effectively predicted the survival outcomes of BCa patients. Furthermore, risk scores, pathological T stage, and pathological N stage were confirmed as independent prognostic factors for the nomogram construction. Interestingly, high-risk patients showed a significantly lower response to PD-L1 treatment, with higher TIDE scores. Omics analysis revealed a close relationship between prognostic genes and proteomics, metabolomics, and post-translational modifications. Specifically, FLNC and MYH11 may influence BCa progression through phosphorylation and succinylation. Single-cell analysis identified fibroblasts as key cells in BCa. Functional experiments showed that MYH11 knockdown promoted cell proliferation, migration, and invasion.
Conclusion: This study identified 8 prognostic genes to construct a risk model, and suggest that MYH11 is a potential diagnostic and prognostic biomarker for BCa.
Keywords: bladder cancer, MYH11, multi-omics, single-cell sequencing analysis, therapeutic target
Introduction
Bladder cancer (BCa) is the 10th most common malignant tumor, and its morbidity and mortality are positively associated with tobacco use.1 Approximately 75% of patients initially diagnosed with non-muscle invasive bladder cancer (NMIBC) have 5-year survival rates of >90%, and>50% of patients with NMIBC present with recurrence or progression to muscle-invasive bladder cancer (MIBC) after localized treatment,2 and the 5-year survival rate for localized MIBC is approximately 60%. At the same time, the 5-year survival rate for distant metastatic MIBC is less than 10%.3 In recent years, besides surgery, chemotherapy, and radiotherapy, immunotherapy has been widely accepted as a first-line adjuvant therapy for MIBC patients, reducing the mortality rate of BCa patients.4 However, despite significant advances, these treatments often fail to address challenges such as recurrence, metastasis, and drug resistance, leaving a substantial unmet clinical need for novel therapeutic approaches and biomarkers for improved patient management. Exploring the molecular mechanisms of BCa and developing new prognostic models and personalized treatment plans are of great significance for improving treatment strategies and enhancing patient prognosis. A clear understanding of the molecular landscape of BCa can provide the foundation for tailored interventions, ensuring better therapeutic responses and patient outcomes.
It has been demonstrated that integrated genoproteomic analyses contribute to a more profound understanding of the molecular subtypes and genetic mutational features of BCa, while combined with phosphorylated proteomic analyses revealed the novel key mechanisms driving the development of BCa.5 Lindskrog et al identified four molecular subtypes of NMIBC with significant differences in various aspects of genomic alterations, cell signaling pathways, and interventional therapeutic measures, following an integrated multigenomic analysis of the transcriptome, spatial proteomics, and single-cell RNA-seq.6 Moreover, Ossoliński found that serum metabolomics analysis can also provide a rationale for noninvasive diagnosis, staging, and grading of BCa patients.7 Combined multi-omics analysis integrates multiple dimensions of biological information to reveal complex molecular interactions and signaling pathways. scRNA-seq technology greatly improves the resolution and accuracy of the data, enabling the disclosure of cellular heterogeneity and the observation of dynamic changes in cellular status during the disease process. These cutting-edge technologies enable researchers to transition from descriptive analyses of tumor biology to mechanistic insights, allowing for the identification of actionable therapeutic targets and predictive biomarkers. The marriage of the two allows in-depth exploration of biological issues from phenotype to molecular mechanism with holistic information, providing new perspectives for investigating the mechanisms of disease and individual differences in therapeutic response. However, while many studies have focused on identifying molecular subtypes and key pathways, there remains a need for comprehensive models that integrate these findings to translate them into clinical applications.
In the present work, critical genes associated with BCa prognosis were screened and a risk model was established based on transcriptomics analysis of public datasets and 101 machine learning algorithms, with comprehensive analyses indicating remarkable differences in immune infiltration, immunotherapy, and targeted drug intervention therapy in BCa patients with different risk stratification. The application of 101 combinations of 10 machine learning algorithms enabled robust feature selection and model construction, which significantly improved the accuracy and reliability of the risk model, addressing limitations of prior studies that relied on fewer algorithms or simpler methods. The metabolomic, proteomic, and protein modification data of critical prognostic genes were consolidated by a multi-omics approach to extend their functions and regulatory mechanisms at various biological layers. Detailed cell type-specific expression and distribution patterns of these genes in BCa were depicted in combination with scRNA-seq technology. This integration of multi-omics and single-cell technologies bridges the gap between large-scale molecular data and cellular-level precision, providing actionable insights into tumor biology. These findings provided a solid foundation for an insightful comprehension of the molecular mechanisms of BCa and the development of new therapeutic strategies, which are expected to facilitate the revolution of BCa therapeutic approaches.
Materials and Methods
Sample Collection and Sequencing
Between February 2024 to May 2024, we collected 10 tumor tissue samples and 10 adjacent non-tumor tissue samples as controls from patients diagnosed with BCa in the Department of Urology at our hospital. Each participant signed an informed consent form prior to sample collection, and the project adhered strictly to the regulations and requirements set by the Ethics Review Committee. Before the study commenced, we submitted a detailed research protocol to the Ethics Review Committee and received formal approval (Ethics Committee approval document number: FEY-BG-38-1.2). Following collection, comprehensive biological analyses were performed on these samples, encompassing both metabolomics and proteomics sequencing. In metabolomics, chromatographic separations were executed using ultra-performance liquid chromatography (UPLC). LC-MS analysis was performed on a high-resolution TripleTOF5600plus tandem mass spectrometer. Data acquisition was executed in information-dependent acquisition (IDA) mode and calibrated using appropriate parameters. In proteomics, DDA data were processed to build spectral libraries using Spectronaut (v 17.0) coupled with the Pulsar search engine. Tandem mass spectra were matched to the Homo_sapiens_9606_SP_20230103.fasta database, which includes 20,389 entries and features a reverse decoy database to boost accuracy. Variable modifications were applied, including methionine oxidation, protein N-terminus acetylation, succinylation, lactylation, or phosphorylation of lysine, serine, threonine, and tyrosine. Missed cleavage sites varied between experiments, totaling either four or two. The false discovery rate (FDR) for proteins, peptides, and peptide-spectrum matches (PSM) was kept under 1%. The library was then imported into Spectronaut (v.17.0) for retention time prediction via nonlinear correction and utilized in DIA data analysis.
Data Collection
Gene expression profiles, clinical data, and survival details for the TCGA-BLCA were obtained from the UCSC Xena database (https://xena.ucsc.edu/), available in HTSeq-FPKM and HTSeq-Counts formats.8 The TCGA-BLCA dataset comprised 411 BCa along with 108 normal tissue samples. After using the “na.omit()” function to exclude patients without complete survival information, 406 samples with survival information were retained (death: survival = 180:226). In addition, the single-cell transcriptome dataset for BCa (GSE135337, n=8) and bulk transcriptome datasets including GSE13507 (n=165), GSE31684 (n=93), GSE3167 (n=49), and GSE32548 (n=130) were sourced from the Gene Expression Omnibus (GEO) database (https://www.ncbi.nlm.nih.gov/geo/). These datasets encompass detailed survival data and clinical information.9–12 To eliminate differences in gene expression levels, a custom function “scaleData()” was used to standardize the expression profiles of TCGA-BLCA and the transcriptome dataset obtained from GEO based on the different cohorts. Specifically, the mean and standard deviation of each gene were adjusted to 0 and 1, respectively.
Differential Expression Analysis
To identify the differentially expressed genes (DEGs) between BCa and normal samples within the TCGA-BLCA, the “DESeq2” R package was utilized (v 1.38.0).13 The selection criteria applied were adj.p<0.05 and absolute log2FC greater than 2.5. A volcano plot was created using the R package “ggplot2”to visualize differentially expressed genes, and the top 10 up-regulated genes and top 10 down regulated genes were labeled in the volcano plot according to the difference multiplier log2 (FoldChange). Then, the R package “ComplexHeatmap”was used to create a heatmap of the expression levels of these 20 differentially expressed genes.
Weighted Gene Co-Expression Network Analysis
The “WGCNA” R package (v 1.71) was employed to pinpoint genes within modules highly associated with BCa.14 Hierarchical clustering of all samples using the Euclidean distance of the sample expression profiles was used to identify and exclude outliers. Subsequently, we set R2 = 0.85 to screen for soft thresholds (β) above the red cut line. Gene adjacency was then calculated, which led to computing gene similarity, from which a gene dissimilarity coefficient was derived to create a hierarchical clustering tree of genes. The minimum gene count per module was set to 100 according to the standards of the dynamic tree-cutting algorithm. Subsequently, critical modules were pinpointed through the assessment of correlations between module characteristics and phenotypic traits. Ultimately, key module genes were identified through an analysis within the module. Genes demonstrating a module membership (MM) greater than 0.8 and gene significance (GS) exceeding 0.2 were selected as key module genes.
Identification and Analysis of Hub Genes
To select candidate genes, we overlapped DEGs with key module genes. Subsequently, human GTF files were obtained from the GENCODE website (https://www.gencodegenes.org/) to establish the chromosomal positions of these candidate genes. Visualization of these results was carried out using the “RCircos” R package (v 1.2.2).15 Subcellular localization analysis of up-and down-regulated candidate genes using the Metascape website. Meanwhile, Kyoto Encyclopedia of Genes and Genomes (KEGG) and Gene Ontology (GO) analyses were executed for candidate genes via “clusterProfiler” R package (v 4.2.2) (adj.p<0.05) to investigate the functions of candidate genes.16 Furthermore, candidate genes were examined through a protein-protein interaction (PPI) network, utilizing high-confidence data (>0.7) from the STRING database (https://string-db.org/). We calculated the degree scores of these genes using the CytoHubba plugin within the Cytoscape software.17 Candidate genes with a degree greater than 2 were designated as hub genes.
Construction of a Risk Model
In TCGA-BLCA, hub genes were analyzed using univariate Cox regression via the “survival” R package (v 3.3–1) (https://cran.r-project.org/package=survival), focusing on those with hazard ratios not equal to one and p-values less than 0.05. A consensus prediction model was then developed using ten machine learning algorithms: Random Survival Forests (RSF), Elastic Networks (Enet), LASSO, Ridge, Step-by-Step Cox, Cox boost, Cox Partial Least Squares Regression (plsRcox), Supervised Principal Components (SuperPC), Generalized Augmented Regression Models (GBM), and Survival Support Vector Machines (survival-SVM). In the training set (TCGA-BLCA), the leave one out cross validation (LOOCV) method was used to fit the algorithm combination in 101 to match the prediction model. The Harrell’s concordance index (C-index) of each model in the validation set (GSE13507, GSE31684, GSE32548) was further calculated. Then, the algorithm with high C-index and good subsequent KM curve and ROC curve validation performance was selected to construct the risk model, which was used to derive prognostic genes for the risk model formula:

Furthermore, receiver operating characteristic (ROC) curves for individual prognostic genes were generated using the “pROC” R package (v 1.18.5) to evaluate their predictive power for the prognosis of BCa patients in the TCGA-BLCA, GSE13507, GSE31684, and GSE32548 datasets.18 Patients in the TCGA-BLCA dataset were categorized into high- and low-risk groups based on the median risk score. Kaplan-Meier (K-M) survival and risk curves were generated using the “survminer” package (v 0.4.9) to evaluate the prognostic effectiveness of the risk model (p<0.05).19 Additionally, the model’s predictive accuracy was evaluated using ROC curves generated with the “timeROC” package (v 0.4).20 Calibration curves and DCA curves were used to further assess the predictive ability of the risk model for 2, 3, and 5 years. Finally, the model’s reliability was also confirmed in the GSE13507, GSE31684, and GSE32548 datasets.
In order to investigate whether a single prognostic gene can effectively predict the survival status of patients, the median expression level of each prognostic gene in the BCa samples of the training set was calculated based on the constructed risk model. According to the median, the training set samples were divided into two groups: 0 (High Risk) and 1 (Low Risk). Kaplan Meier survival analysis was used to compare the survival status between high and low groups.
Independent Prognostic Analysis
To assess the risk model as an independent prognostic factor, we conducted univariate Cox regression incorporating variables such as risk score, age, gender, and pathological stages T, M, and N (p<0.05), ensuring adherence to the proportional hazards (PH) assumption (p>0.05). This was followed by a multivariate Cox regression to further investigate the influences of these factors (p<0.2). Subsequently, the predictive performance of the nomogram was assessed in TCGA-BLCA by plotting calibration curves, DCA curves, and ROC curves of 2, 3, and 5 years.
Unsupervised Clustering of Prognostic Genes
In TCGA-BLCA, based on the expression profiles of prognostic genes, a consistency clustering analysis was executed using the “ConsensusClusterPlus” package (v- 1.62.0)21 to identify BCa-associated subtypes. To confirm the stability of the clustering, the process was repeated 1000 times to establish the optimal “k” value (number of clusters). This determination was based on the relative change in the cumulative distribution function (CDF) curve and the area under the consensus matrix. Following this, K-M survival curves were generated using the “survminer” package (v 0.4.9).22
Gene Set Enrichment Analysis
To investigate the biological functions and pathway distinctions between two risk groups, the “DESeq2” R package (v 1.38.0) was employed to explore gene expression differences between two risk groups within TCGA-BLCA samples, calculating and ranking log2FC.13 Subsequently, The “clusterProfiler” R package (v 4.2.2) was used to execute GSEA to identify relevant GO functions and KEGG pathways.16 The gene sets for GO:BP, GO:CC, GO:MF, and KEGG from the “msigdbr” package (v 7.5.1) were utilized as reference sets.22 Visualization of the results was accomplished using the “enrichplot” R package (v 1.18.3).23
Immune Microenvironment Analysis and Prediction of Immunotherapy Response
We used the R package “IOBR” (v 0.99.9) and analyzed the infiltration of immune cells by various algorithms, such as TIMER, EPIC, MCP-COUNTER, ESTIMATE, and CIBERSORT.24 Based on the literature, we selected 68 immune checkpoints and compared the differences in the expression of these immune checkpoints between high and low-risk groups in TCGA-BLCA.25 In addition, we used the R package “psych” (v 2.2.9) for correlation analysis of prognostic genes with immune cells and differential immune checkpoints.26 In the TCGA-BLCA dataset, the R package “estimate” (v 1.0.13) was used to calculate the StromalScore and ImmuneScore of the samples and the differences in these scores were compared between two risk groups.27 IMvigor210 data were obtained from the “IMvigor210CoreBiologies” package (v 1.0.0) (https://github.com/SiYangming/IMvigor210CoreBiologies) to explore differences in response to PD-L1 therapy in BCa patients between two risk groups. The response to immunotherapy was categorized into four types: complete remission (CR), partial remission (PR), stable disease (SD), and disease progression (PD). Finally, we analyzed the correlation between TIDE scores and risk scores in TCGA-BLCA, GSE13507, GSE32548, and GSE31684 datasets, and the differences in TIDE scores between two risk groups.
Mutation Analysis and Drug Sensitivity Prediction
Somatic mutation data for TCGA-BLCA was retrieved through the “TCGAmutations” package (v 0.3.0) (https://github.com/PoisonAlien/TCGAmuta-tions), and the mutations were examined across both two risk groups. Additionally, we gathered the IC50 values for 198 drugs from the GDSC databases (https://www.cancerrxgene.org/) and compared these values across the risk groups to pinpoint drugs with noteworthy differences. The relationship between common chemotherapeutic agents (Dasatinib, Erlotinib, Lapatinib, Savolitinib) and prognostic genes and risk scores was further visualized. In addition, correlations between prognostic genes and FDA-approved chemotherapeutic agents, classical therapeutic targets, and signaling pathways were explored.
In the TCGA-BLCA dataset, we first screened out tumor-related drug targets by comparing the differences between normal and BCa tissues using the Wilcoxon test (p<0.05). Subsequently, by analyzing the K-M survival curves of the target high and low expression groups and using the Log rank test (p<0.05), we further identified drug targets that were significantly associated with patient prognosis. By conducting an intersection analysis, we pinpointed the crucial targets of our research. We then explored the expression of these targets across various human tissues using the HPA database, aiming to understand their biological functions and potential therapeutic applications.
Prognostic Genes Expression Validation and Human Protein Atlas Analysis
Comparison of prognostic genes between BCa and control in TCGA-BLCA, GSE3167, and GSE13507 datasets. Next, we analyzed the protein expression levels of prognostic genes in BCa compared to controls using the HPA database (https://www.proteinatlas.org/).
Metabolomics and Proteomic Analysis
The inter-sample reproducibility and consistency were comprehensively assessed by applying three statistical methods, such as Pearson correlation coefficient (PCC), principal component analysis (PCA), and relative standard deviation (RSD). Firstly, we conducted metabolite content analyses to compare the differences in metabolite compositions between BCa and control groups, using an orthogonal partial least squares discriminant analysis (OPLS-DA) to delve into inter- and intra-group disparities. Differentially expressed metabolites (DEMs) were identified based on thresholds set at a variable importance in projection (VIP) of at least 1.0, p<0.05, and a log2FC of at least 1.5 for up-regulation or less than 1/1.5 for down-regulation. The DEMs were then subjected to KEGG pathway enrichment analysis to identify significantly impacted biological pathways. Similarly, we identified differentially expressed proteins (DEPs) using thresholds of p<0.05 and log2FC values corresponding to up- or down-regulation. These proteins underwent GO and KEGG pathway enrichment analyses, alongside assessments of their subcellular and chromosomal localizations. A PPI network was established using the STRING database (https://string-db.org) (confidence score>0.7). Additionally, based on the motif-x algorithm, we performed motif characterization of peptide sequences in the vicinity of the modification site using the MoMo analysis tool (p<0.000001). Finally, the same methods described above were used to screen for differentially expressed modified proteins as well as differentially expressed modified sites and to perform relevant functional analyses.
Lactylation, Phosphorylation, and Succinylation Modification Histology and Proteomics
A joint analysis of DEPs and differentially expressed lactate-modified proteins (DE-LMPs) was first performed to identify lactylation-modified proteins by taking intersections. Next, PPI networks were established using the STRING database (high confidence>0.7) and visualized using Cytoscape software.17 In addition, KEGG enrichment analysis was performed by the Metascape website, which functionally clustered the lactylation-modified proteins and visualized the most prominent pathways. The same approach was applied to phosphorylation and succinylation-modified proteins (DE-PMPs and DE-SMPs) to identify proteins common to these modifications. Ultimately, we identified proteins undergoing single or multiple post-translational modifications by comparing the intersection and concatenation of DE-LMPs, DE-PMPs, and DE-SMPs.
Conjoint Analysis of Proteomic and Metabolomics
Spearman correlation analysis was executed using the “Hmisc” function to analyze the correlation between DEPs and various types of post-translationally modified proteins (DE-LMPs, DE-PMPs, and DE-SMPs) and DEMs (|cor|>0.95, p<0.05) to obtain candidate DEPs, LMPs, PMPs, and SMPs. In addition, metabolites associated with different post-translationally modified proteins were analyzed using the “VennDiagram” R package (v 1.7.1).28
Joint Proteomic and Transcriptomic Analysis
Candidate genes were evaluated in conjunction with DEPs as well as DE-LMPs, DE-PMPs, and DE-SMPs. Initially, intersections genes (proteins) were identified between both upregulated and downregulated candidate genes and their corresponding post-translational modifications. These genes and proteins were subsequently subjected to GO and KEGG enrichment analysis via the “clusterProfiler” package (v 4.2.2).16 In the TCGA-BLCA dataset, samples were categorized into high and low-expression groups using median expression values of certain genes (proteins). Subsequently, we analyzed the association between expression levels and patient survival outcomes using K-M survival curves and Log rank tests.
Single-Cell Sequencing Analysis
The “Seurat” package (v 5.0.1) was utilized to systematically process and analyze single-cell transcriptome sequencing data from GSE135337.29 First, we constructed Seurat objects and filtered out data that appeared in fewer than 3 cells or detected fewer than 200 genes per cell. Subsequently, quality control was performed to filter out cells with nFeature_RNA less than 500 or more than 6000, nCount_RNA more than 40,000, and percent.mt higher than 10%. Data normalization was performed using the “NormalizeData” function, then the selection of the top 3,000 highly variable genes via the “FindVariableFeatures” function, based on their mean-variance relationship. Data normalization was performed using the “ScaleData” function. To eliminate the batch effect, we used the “FindIntegrationAnchors” and “IntegrateData” functions to process the data. Then the “NormalizeData” function, “FindVariableFeatures” function, and “ScaleData” function perform data normalization and normalization to verify the effectiveness of removing batch effect (resolution=0.1, principal component=30). Finally, the cell clustering analysis was executed by the UMAP method and the cells were annotated using marker genes from the published literature.9 The “FindAllMarkers” function was used to obtain differentially expressed genes in different cell types (only.pos=TRUE, min.pct=0.25, logfc.threshold=0.25). Subsequently, functional enrichment analyses were executed on these marker genes of annotated cells to explore their potential functions in cellular functions and pathological processes. We employed the inferCNV algorithm of the R package “inferCNV” (v 1.1400) (https://github.com/broadinstitute/inferCNV) to analyze the copy number variation (CNV) of the clusters with the highest cellular content in the BCa samples. In addition, we calculated the CNV scores for each cluster to quantify the potential impact of copy number variation on cell populations. Pseudo-time trajectory analysis was then performed using “Monocle 2”.
Identification and Analysis of Key Cells
Crucial cells were pinpointed by confirming the expression of prognostic genes in each annotated cell type. After these cells were identified, we performed data normalization using the “ScaleData” function. Subsequently, clustering of key cells was executed via UMAP analysis (resolution=0.1). To explore the developmental trajectories of key cells, simulation analysis was executed using the “monocle” package (v 2.14.0).30 Finally, cell communication between the key cells and other annotated cell types was analyzed via the “CellChat” package (v 1.6.1) (https://link.springer.com/article/10.1007/s13238-020-00762-6).
Immunohistochemistry (IHC) Staining
Paraffin-embedded tissue samples were sectioned at a thickness of 4 μm. The sections were pretreated in an oven at 65°C for 2 h. Dewaxing was performed using xylene, followed by soaking in 100%, 95%, and 80% ethanol for about 5 min each. The sections were then gently rinsed with deionized water. Antigen retrieval was carried out using citrate buffer, followed by blocking. MYH11 antibody (1:1000, Abcam) was applied to the sections and incubated overnight at 4°C. The following day, a secondary antibody was applied, and the sections were incubated for 30 min at room temperature. The sections were then rinsed with PBS, stained with DAB, and counterstained with hematoxylin.
Cell Culture and Transfection
The BCa cell lines RT4, T24, 5637, SW780, J82, and the normal bladder uroepithelial SV-HUC-1 were all purchased from Shanghai Fuheng Cell Biology Co., Ltd. and cultured according to standard procedures. Lipid-mediated shRNA transfection was performed using the lipo 3000 reagent (Invitrogen) according to the shRNA product instructions.
Cell Proliferation, Migration and Invasion Assay
Cells were seeded into a 6-well plate at a density of 1000 cells per well and incubated for 2 weeks at 37°C in a 5% CO2 atmosphere. After incubation, the cells were fixed with 4% paraformaldehyde for 20 min and stained with 0.5% crystal violet solution for another 20 min. For the cell invasion assay, 5000 cells were seeded into the upper chamber containing serum-free medium (Corning), with the lower chamber coated with Matrigel (BD Biosciences). After approximately 24 h, they were fixed with 4% paraformaldehyde for 20 min and stained with 0.1% crystal violet for 15 min. The migratory capacity of the cells was assessed using a wound-healing assay. Cells were seeded in 6-well plates at a density of 1×10⁴ cells per well and allowed to grow to 80–90% confluence. A thin wound was created using a sterile 200 μL pipette tip, and the gap between the wound edges was imaged at 0 and 24 h. To evaluate changes in cell proliferative capacity, 3000 cells per well were seeded into 96-well plates, each containing 100 µL of complete growth medium. After the cells had adhered, 10 µL of CCK-8 solution (Dojindo, Kumamoto) was added to each well. Following a 2 h incubation, the absorbance was measured at 450 nm.
Western Blot
The entire experimental procedure was carried out on ice. Total protein was initially extracted from cells and tissue using RIPA lysis buffer. Sodium dodecyl sulfate-polyacrylamide gels (SDS-PAGE) were prepared according to the molecular weights of the target proteins, and approximately 30 μg of protein sample was loaded into each well. The proteins were separated by electrophoresis, transferred onto PVDF membranes, and subsequently blocked with 5% milk for 2 h at room temperature. The membranes were then incubated overnight at 4°C with the MYH11 antibody (1:5000, Abcam). After primary antibody incubation, the membranes were washed three times in TBST buffer for 5 min each. GAPDH antibody (1:1000, Proteintech) was prepared in 5% milk and incubated with the membranes for 1 h at room temperature. Finally, the membranes were washed rapidly in TBST buffer three times for 10 min each. Protein bands were visualized using enhanced chemiluminescence (ECL, Bain-marie) on a GE Healthcare imaging system.
Statistical Analysis
Bioinformatics analyses were conducted using R programming language (v 4.2.2). The Wilcoxon rank sum test evaluated differences between groups, while Fisher’s exact test determined the significance with a p-value < 0.05 for statistical significance. Supplementary File 1 presented the bioinformatics analysis process of this study.
Remark Criteria Statement
Our research adheres to the Reporting Recommendations for Tumor Marker Prognostic Studies (REMARK) criteria, ensuring transparency and comprehensive reporting of our study findings.31
Results
Fifteen Hub Genes Were Screened
Through differential expression analysis in the TCGA-BLCA dataset, 1226 DEGs were identified, including 692 upregulated genes and 534 downregulated genes. (Figure 1A, B and Supplementary Table S1). The WGCNA method was used to cluster all samples, and the optimal soft threshold β=5 was selected to identify 17 co expressed modules. Further, modules with high positive/negative correlation with BCa were selected, resulting in 221 module genes associated with BCa (Figure 1C, D and Supplementary Figure S1a–c). Through DEG and module genes, ultimately determined 119 candidate genes (Figure 1E). The analysis of these genes’ specific locations on chromosomes and subcellular localization showed that they played a crucial role in cellular functions (Figure 1F and G). Additionally, enrichment analysis indicated that the candidate genes primarily participated in biological functions including muscular system processes, muscle contraction, and the calcium signaling pathway (Figure 1H and I). Subsequently, through PPI network analysis, we highlighted the central role of 15 hub genes in BCa (Figure 1J).
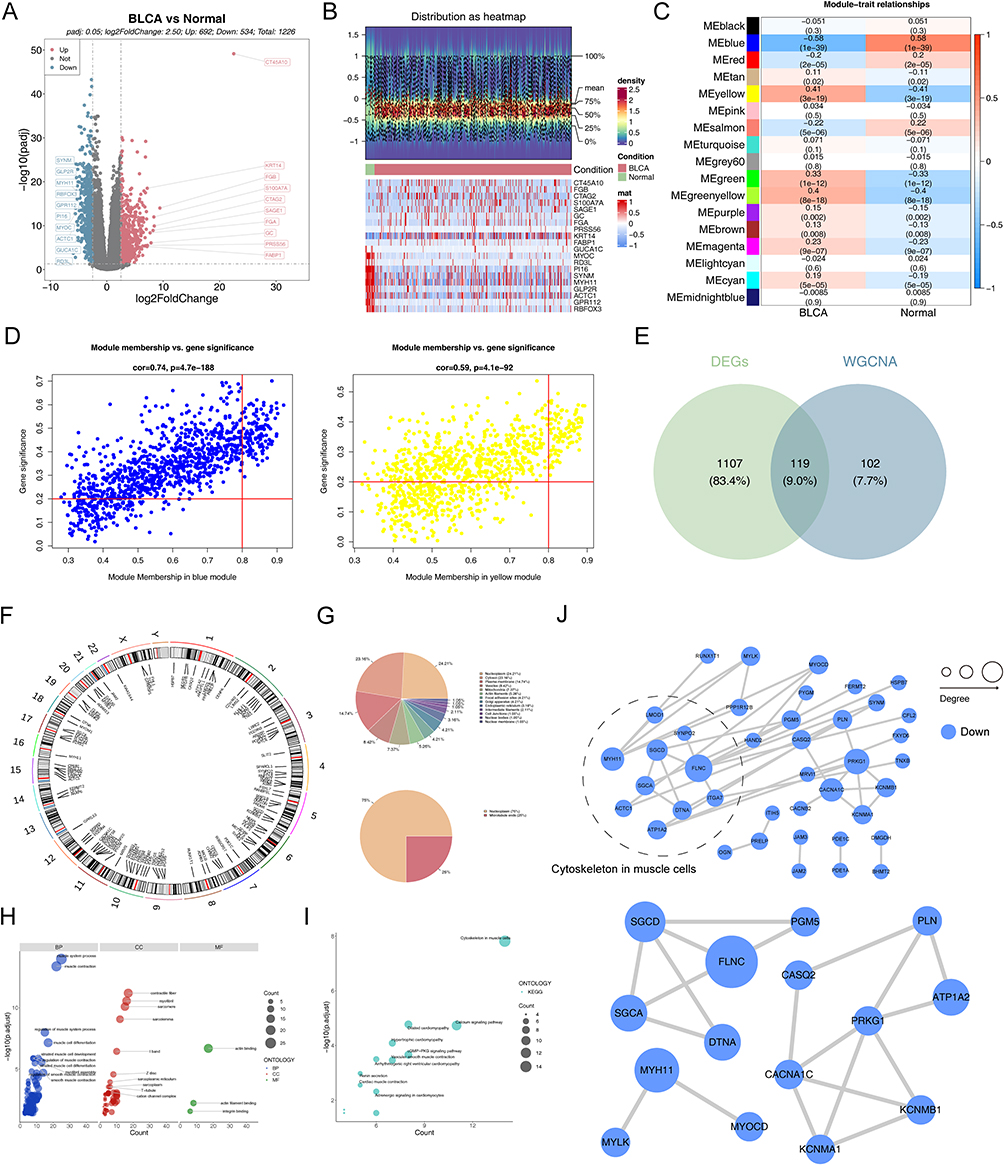 |
Figure 1 Identification of hub genes. (A) Volcano plot of DEGs between BCa and Normal tissues. (B) Heatmap of DEGs between BCa and Normal tissues. (C) Heatmap of correlation between modules and phenotypes. (D) Scatter plot of 221 BCa-associated module genes. (E) Venn plot of DEGs and BCa-associated module genes. (F) Circos plot depicting the locations of 119 candidate genes. (G) Pie chart of subcellular localization of 119 candidate genes. (H) GO enrichment analysis showing the cellular component (CC), biological processes (BP), and molecular function (MF) involved in candidate genes. (I) KEGG enrichment analysis showing the signaling pathways involved in candidate genes. (J) PPI network of candidate genes and 15 hub genes. |
Construction of Prognostic Gene Signatures by Machine Learning Algorithms
Next, we developed prognostic genes from 15 hub genes through an integrated approach of univariate Cox regression analysis and machine learning algorithms. The univariate analysis identified 8 genes noticeably associated with prognosis (Figure 2A). In four datasets, the LOOCV framework was used to develop 101 predictive models, and the c-index was calculated for each model (Figure 2B). The top 10 models with the highest c-indexes are displayed in Figure 2C. We chose to use the RSF+SuperPC algorithm to build a risk model, identifying CASQ2, DTNA, FLNC, KCNMA1, MYH11, PLN, PRKG1, and SGCD as prognostic genes. The specific formula for our risk model was: RiskScore = 1.1980066*CASQ2 + 1.4268389*DTNA + 1.5547541*FLNC + 0.9854694*KCNMA1 + 1.1265762*MYH11 + 1.0659459*PLN + 1.6518046*PRKG1 + 1.3311954*SGCD. Subsequent ROC analysis demonstrated the high diagnostic value of these prognostic genes (Supplementary Figure S2a–d). Figure 2D presents the functional annotation of the proteins encoded by these prognostic genes, providing insights into their biological roles.
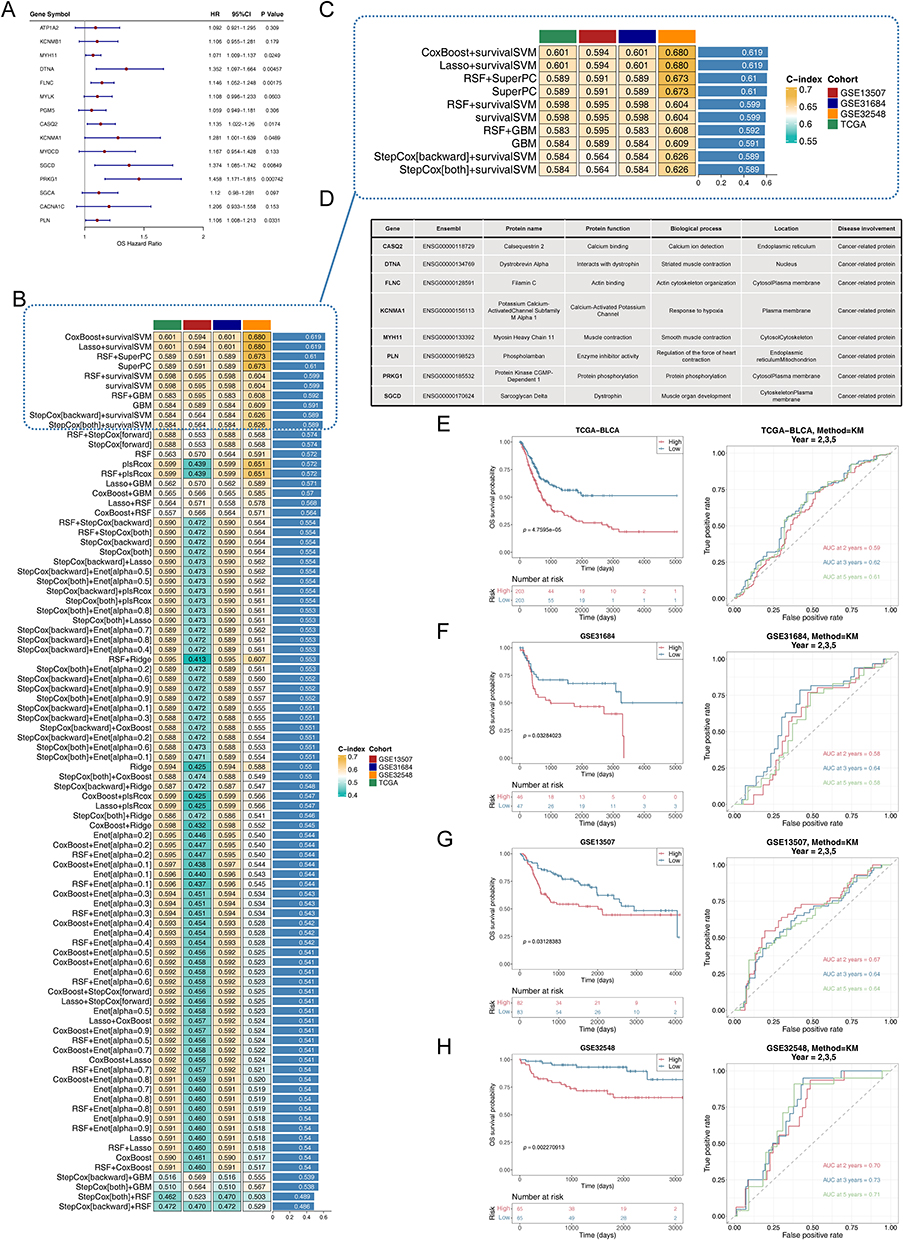 |
Figure 2 Machine learning screening for prognostic genes. (A) A total of 8 prognosis-related genes were identified via univariate cox analysis. (B) A total of 101 prediction models via LOOCV further r calculated the C index of each model. (C) C-index top10 prediction models. (D) The information and functions of the 8 prognostic genes encoded proteins. (E–H) Kaplan-Meier curves and ROC curves for 2.3.5 years in high and low-risk groups. (E) TCGA-BLCA cohort, (F) GSE31684 testing set, (G) GSE13507 testing set, and (H) GSE32548 testing set. |
Subsequently, TCGA-BLCA samples were categorized into high- and low-risk groups based on the median risk score. The KM curve revealing that the survival rate of the high-risk group was much lower than that of the low-risk group, and the reliability of the risk model was further validated via ROC analysis, forecasting the survival of BCa patients at 2, 3, and 5 years (Figure 2E). As the risk score increased, the survival time decreased (Supplementary Figure S3a). The model’s predictive accuracy was confirmed using calibration curves and DCA (Supplementary Figure S3b–c). Furthermore, the prognostic significance of these genes was confirmed using the GSE31684, GSE13507, and GSE32548 datasets (Figure 2F–2H and Supplementary Figure S3d–l). The expression levels of prognostic genes were markedly elevated in the high-risk group, underscoring their likely impact on disease progression, as shown in Supplementary Figure S3m–p. In the TCGA-BLCA dataset, the KM curves of eight genes showed that the survival rate of the high-risk group was significantly lower than that of the low-risk group (Supplementary Figure S4)
To investigate the potential biological distinctions between the two risk groups, we conducted GSEA, with the results presented in the Supplementary Figure S5a–d. Our findings indicated that the two risk groups exhibited significant enrichment in distinct biological functions and signaling pathways. Notably, pathways involved included muscular system processes, regulation of cardiac contraction, RHO protein signaling, neuroactive ligand-receptor interactions, and MAPK signaling pathways. These analyses enhanced our understanding of the biological foundations underlying risk stratification in patients. Supplementary Figure S5e–h illustrated the expression profiles of the prognostic genes between BCa and normal in multiple datasets (TCGA-BLCA, GSE3167, and GSE13507) as well as their protein expression levels in the HPA. The expression levels of prognostic genes in Normal samples were significantly higher than those in BCa samples, all of which were downregulated genes with consistent and significant expression trends. Immunohistochemical analysis showed that MYH11 exhibited significantly higher staining at the protein level in normal tissues. This comprehensive demonstration aimed to confirm the robustness of prognostic genes across different platforms and their clinical relevance.
Prognostic Nomogram for BCa Based on Independent Risk Factors
Independent prognostic analyses are essential for establishing robust clinical decision support systems. Hence, in the TCGA-BLCA dataset, RiskScore, pathologic_T, and pathologic_N were identified as independent prognostic factors (Figure 3A–C). These independent prognostic indicators were employed to create a nomogram that illustrated the survival probabilities for BCa patients at 2, 3, and 5 years (Figure 3D). Calibration curves, ROC curves, and DCA analyses further substantiated the accuracy of the nomograms in forecasting BCa patient outcomes. The calibration curve’s slope nearing 1 signifies the nomogram’s high predictive precision (Figure 3E). Additionally, the ROC curves demonstrated the nomogram’s accurate predictive capabilities. The true positive rate of the nomogram surpassed that of any single predictor (Figure 3F). The DCA curves showed that patients benefit more from the nomogram than from the individual variables (Figure 3G).
 |
Figure 3 Prognostic nomogram construction and evaluation. (A) Univariate analysis of the clinicopathologic characteristics and risk score in the TCGA-BLCA cohort. (B) PH assumption testing for multivariate analysis for risk scores and clinicopathologic characteristics. (C) Multivariate analysis of the clinicopathologic characteristics and risk score in the TCGA-BLCA cohort. (D) A nomogram was established to predict the prognosis of TCGA-BLCA patients. (E) Calibration plots showing the probability of 2-, 3-, and 5-year overall survival in the TCGA-BLCA cohort. (F) Receiver operator characteristic (ROC) of a nomogram predicting 2-, 3- and 5-year overall survival. (G) Decision curve analysis (DCA) of a nomogram. |
Relationship of Risk Model with Clinical Characteristics in BCa Patients
In addition, detailed comparisons of clinical characteristics such as age, gender, pathological TMN, and stage were carried out (Figure 4A–F), and expression heat maps of prognostic genes in different clinical indicators were plotted (Figure 4G). Further analysis involved consensus clustering based on the expression levels of prognostic genes, and BCa samples could be well classified into two subtypes (Cluster1, Cluster2) at k=2 (Figure 4H). KM survival analysis showed that patients in cluster1 had a higher survival rate (Figure 4I). The corresponding relationships between different clinical indicators, different survival states, and different subtypes of BCa samples were shown in Figure 4J, further confirmed the higher survival rates of patients in cluster1. The final analysis showed a high correlation between prognostic genes and pathologic N (Figure 4K), highlighting the importance of these genes in the progression of BCa.
 |
Figure 4 Relationship between clinical features and risk model. (A–F) Violin plots of the relationship between risk score and age, gender, pathologic_T, pathologic_M, pathologic_N, and stage in TCGA-BLCA cohort. (G) Heatmap of 8 prognostic genes and clinical factors. (H) TCGA-BLCA cohort patients were grouped into two molecular clusters when k=2 based on the prognostic genes profile. (I) Kaplan-Meier analysis of the prognosis of TCGA-BLCA cohort patients in the two clusters. (J) Alluvial diagram showing the interrelationship between the risk group, molecular clusters, clinical status, and survival status in BCa patients. (K) Heatmap of correlation between prognostic genes and clinical indicators. (ns not significant, *P<0.05, ***P<0.001, ****P<0.0001). |
Association of Prognostic Genes with the Immune Profile of BCa Patients
Then, we examined the mutational profiles of the two risk groups. In the high-risk group, the TP53 exhibited the highest mutation frequency at 51%, characterized predominantly by missense mutations (Supplementary Figure S6a and Figure 5A). Conversely, in the low-risk group, the TTN showed the highest mutation frequency, also at 49%, with mutations of the missense type (Supplementary Figure S6b and Figure 5B). We employed multiple algorithms to comprehensively study the immune cell infiltration in BCa samples within the TCGA-BLCA. We observed positive correlations between prognostic genes and anticancer immune-related cells, such as CD8+ T cells and myeloid dendritic cells. Additionally, these genes also showed positive correlations with cancer-associated fibroblasts (CAFs), fibroblasts, macrophages, and neutrophils (Figure 5C). In the high-risk group, both Stromalscore and Immunescore were elevated (Figure 5D). We also explored differences in immune checkpoints between two risk groups, finding disparities in 49 immune checkpoints, most of which were positively correlated with prognostic genes (Supplementary Figure S6c and Figure 5E). These results offered important perspectives on the intricate workings of the immune microenvironment in BCa.
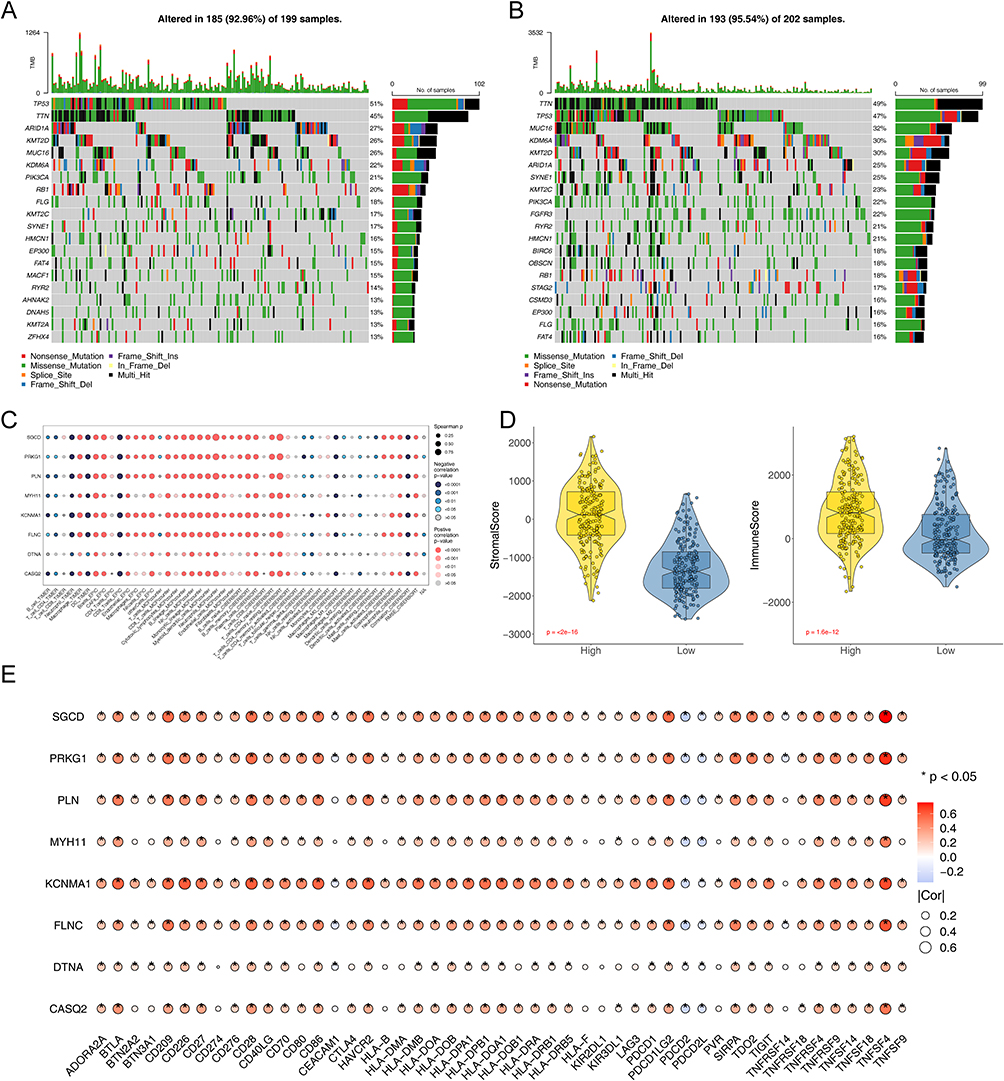 |
Figure 5 Genomic and TIME characteristics of the two risk groups. Waterfall plot showing the 10 most frequently mutated genes in high risk group (A) and low risk (B). Genes are ordered by mutation frequency, which is displayed in the right. The color coding represents the mutation types. The top shows the tumor mutation burden. (C) Bubble plot of the relationship between immune cells, and prognostic based on the TIMER, EPIC, MCP-COUNTER, ESTIMATE, and CIBERSORT algorithms. (D) Violin plots of the comparison of Stromalscore and Immunescore between high- and low-risk groups in TCGA-BLCA. (E) Bubble plot of the relationship between immune checkpoint genes and prognostic genes. (*P<0.05). |
Prediction of Risk Models in Immunotherapy
Immunotherapy leverages the body’s immune system to combat cancer, utilizing various mechanisms to boost or stimulate immune functions, enabling the recognition and elimination of cancer cells.3 Thus, in four BCa datasets, we assessed the link between TIDE scores and risk scores and compared TIDE scores across two risk groups. The data revealed that TIDE scores of the high-risk group was significantly higher than that of the low-risk group, implying a more favorable response to immunotherapy in the low-risk group (Figure 6A and B). Using the IMvigor210 cohort data, we examined how high and low-risk BCa patients responded differently to PD-L1 therapy. Patients with high risk showed reduced survival rates compared to their low-risk counterparts (Figure 6C). Patients who did not respond to treatment exhibited notably higher risk scores compared to responders (Figure 6D). Additionally, a smaller proportion of high-risk patients responded to anti-PD-L1 therapy, whereas a larger proportion of non-responders were found in the high-risk group (Figure 6E and F). This comprehensive analysis underscored the critical role of risk stratification in predicting and enhancing the effectiveness of immunotherapeutic interventions in BCa.
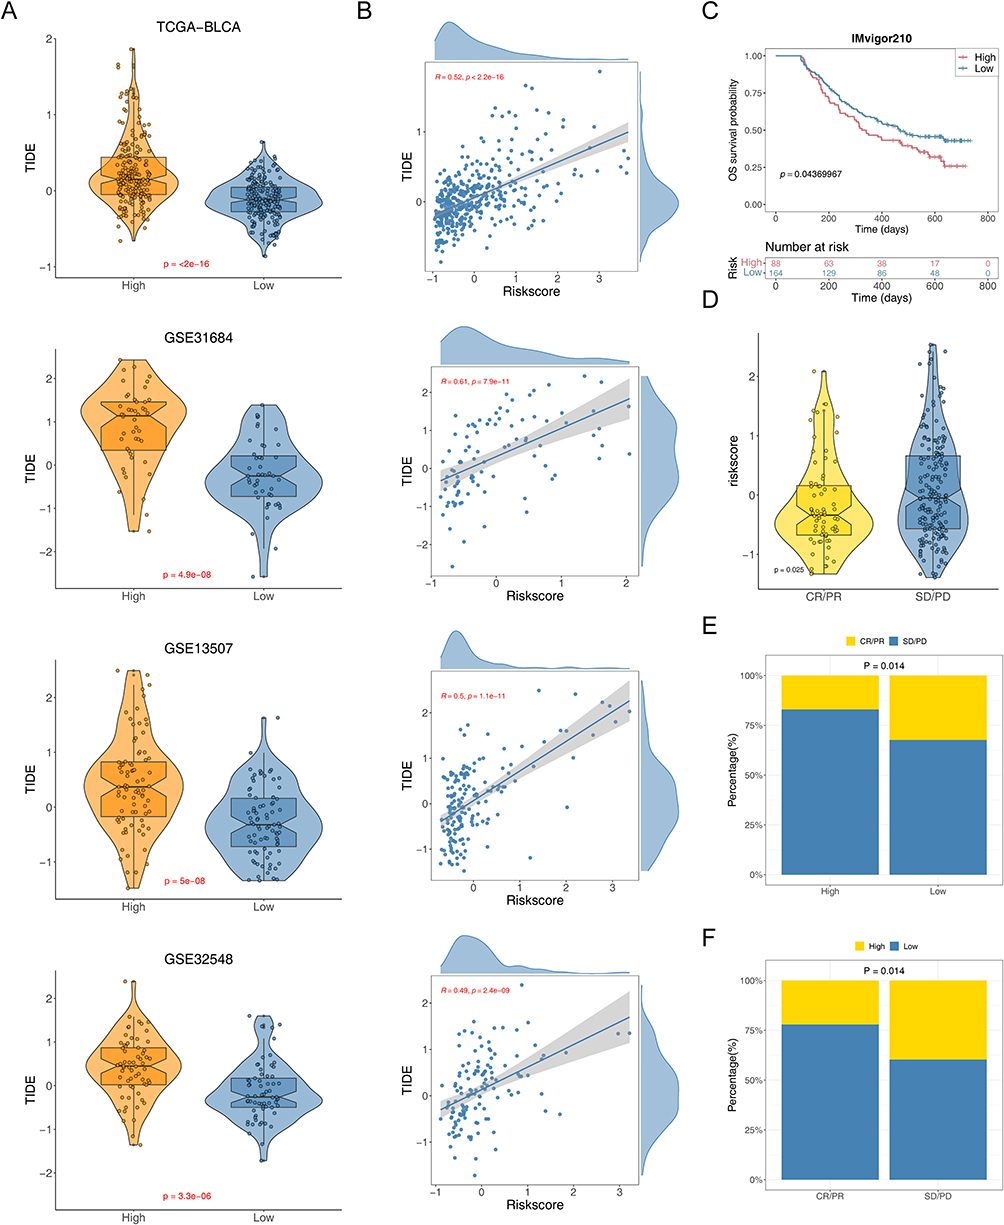 |
Figure 6 Predictive effect of risk model in immunotherapy. (A) Violin plots of the comparison of TIDE scores between high- and low-risk groups in TCGA-BLCA, GSE31684, GSE13507, and GSE32548 patients. (B) The correlation between the TIDE score and risk score in TCGA-BLCA, GSE31684, GSE13507, and GSE32548 patients. (C) Kaplan-Meier curve for overall survival of the low-risk group and high-risk group in IMvigor210 cohort. (D) Violin plots of the risk score of between sensitive (CR/PR) and resistant (SD/PD) groups. (E and F) The proportions of ICIs sensitive (CR/PR) and resistant (SD/PD) populations in the two risk groups from IMvigor210 cohort. |
Risk Model Correlated with Targeted Therapy Response in BCa Patients
In exploring individualized therapeutic strategies for oncological diseases, differential analysis of IC50 has become a key tool for evaluating drug sensitivity. The IC50 value indicates the drug concentration needed to inhibit tumor cell growth, with a lower IC50 value typically suggesting greater drug sensitivity.32 By comparing the IC50 values of 198 drugs between two risk BCa patients, we successfully identified 119 drugs with statistically significant differences (p<0.05) (Supplementary Table S2). Figure 7A demonstrates the correlation between IC50 and prognostic genes for various drugs. For further analysis, we selected several commonly used FDA-approved chemotherapeutic agents based on the literature,26 particularly those that displayed significant differences between two risk groups (Dasatinib, Erlotinib, Lapatinib, and Savolitinib). By examining the performance of these drugs in patients in two risk groups, we could better understand the responsiveness of different patients to chemotherapeutic drugs, thus providing a basis for personalized treatment. We found that Erlotinib had a higher IC50 value in the low-risk group (Figure 7B–E). We also investigated the relationships among prognostic genes, FDA-approved chemotherapy drugs, classical therapeutic targets, and signaling pathways (Figure 7F). Our results indicated a possible link between these prognostic genes and drug sensitivity.
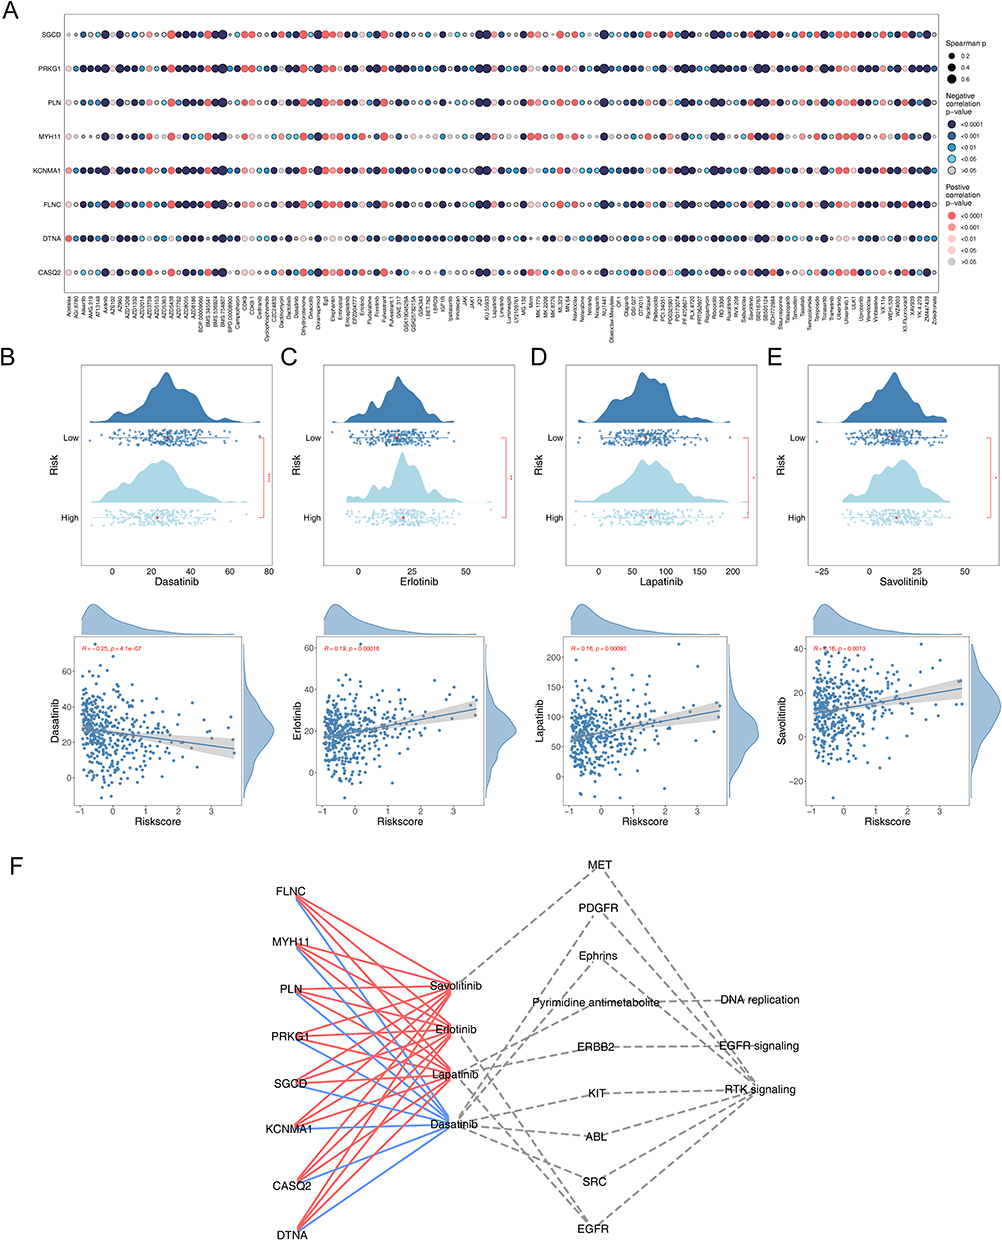 |
Figure 7 Efficacy of prognostic genes in predicting drug sensitivity. (A) Bubble plot of the relationship between drugs and prognostic genes (B–E) Boxplots of the comparison of IC50 of drugs used for treating BCa between high- and low-risk groups and correlation between the IC50 and risk score in the TCGA-BLCA cohort. (F) The correlation between prognostic genes, drugs, classical therapeutic targets, and pathways in TCGA-BLCA. |
Chemotherapy Target Selection and SRC Expression Analysis in BCa
Next, to enhance the selection of key targets for chemotherapeutic agents, we conducted the following screening process (Figure 8A). We examined the expression levels of traditional therapeutic targets in both BCa and normal tissue samples (Figure 8B and Supplementary Figure S7a–f). Then, by plotting K-M curves based on the expression levels of these targets, we identified SRC as a critical target (Figure 8C and Supplementary Figure S7g–l). We analyzed SRC expression in different human tissues and found that the highest level of SRC expression was found in the stomach and higher in the urinary bladder (Figure 8D). Additionally, we observed SRC expression across various cancers (Figure 8E). A crucial finding was that SRC expression levels were significantly higher in Asian BCa patients, suggesting that patients of Asian descent might benefit more from Dasatinib treatment (Figure 8F). Immunohistochemistry revealed significantly elevated SRC protein expression in BCa, indicated by more intense staining (Figure 8G). These results enhanced our understanding of therapeutic targets for BCa.
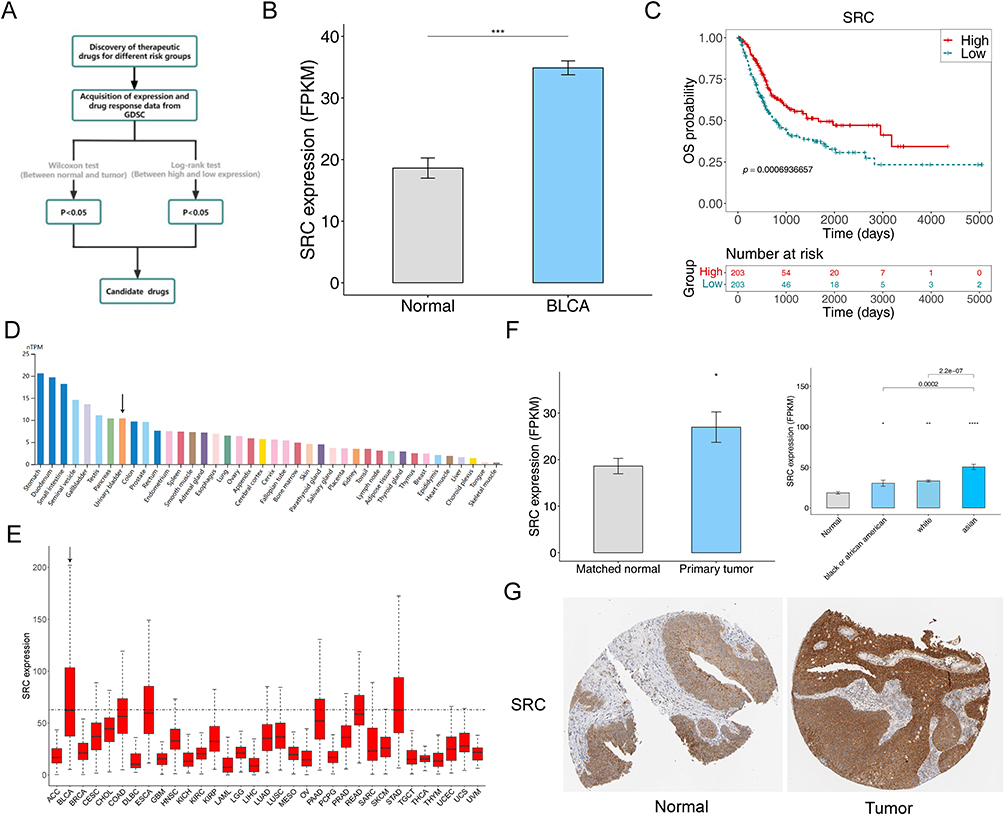 |
Figure 8 Screening of chemotherapeutic drug targets SRC in BCa. (A) The schematic outlines the strategy for key target screening. (B) The expression of SRC between BCa and normal groups. (C) Kaplan-Meier curve of SRC in BCa. (***P<0.001). (D) The expression of SRC in different human tissues from HPA database. (E) The expression of SRC in 33 types of cancer from TCGA database (F) The expression of SRC in different races. (*P<0.05, **P<0.01, ****P<0.0001). (G) The immunohistochemically stained images from HPA database showing the protein expression of SRC in the BCa and normal tissues. |
Comprehensive Metabolomic and Proteomic Profiling Revealed Key Molecular Changes in BCa
Based on transcriptomic data, we utilized machine learning to construct a risk model and selected genes associated with prognosis while also an analyzing the immune characteristics of BCa. However, to fully decipher the molecular mechanisms of BCa, we need to examine a broader range of biomolecular changes. Therefore, by integrating metabolomic and proteomic data, we revealed key molecular alterations in BCa patients, which may be closely related to the disease’s progression, treatment response, and prognosis. After performing quality control analysis on metabolomics, proteomics, and protein modification data (lactylation, phosphorylation, and succinylation) for BCa samples and control samples, significant differences were observed between the groups with good reproducibility, providing a reliable foundation for further analysis (Supplementary Figure S8a–e). In metabolomics, building an OPLS-DA model showed that differences between groups were notably larger than those within groups, with further validation affirming the model’s dependability (Figure 9A). The differential analysis identified 211 significantly altered metabolites between BCA and PBCA samples, with 79 upregulated and 132 downregulated DEMs (Figure 9B and C). These DEMs were primarily enriched in biochemical and cellular metabolic pathways including chemical carcinogenesis of reactive oxygen species, glutathione metabolism, and amino acid biosynthesis (Figure 9D). In proteomics, a sum of 3,985 DEPs were identified, with 2,556 upregulated and 1,429 downregulated (Figure 9E and F). Enrichment analyses revealed that these DEPs were markedly enriched in RNA processing, RNA metabolic processes, and the complement and coagulation cascade pathways (Figure 9G and H). Upregulated DEPs were predominantly located in the nucleus, while downregulated DEPs were mainly located in the extracellular matrix (Figure 9I). We also displayed the chromosomal locations of these upregulated and downregulated DEPs and presented a PPI network map of the upregulated DEPs (Figure 9J and K).
 |
Figure 9 Identification and analysis of DEMs and DEPs. (A) OPLS-DA score plots for BCA and PBCA and the plot of OPLS-DA model validation. Volcano plot of DEMs (B) and DEPs (E) between BCA and PBCA groups. Heatmap of DEMs (C) and DEPs (F) between BCA and PBCA groups. (D) The DEMs involved in 15 KEGG pathways. (G and H) DEPs involved in GO function and KEGG pathway. (I) Pie chart of subcellular localization of up- and down-regulated DEPs. (J) Positional distribution of DEPs on chromosomes. (K) PPI network of the top 30 most closely interrelated DEPs. |
To identify and understand specific modification sites on proteins, we conducted a Motif analysis. Supplementary Figure S9a–c and Supplementary Tables S3–S5 illustrated the changes in the frequency of amino acids around the modification sites for lactylation, phosphorylation, and succinylation, along with the corresponding motifs. Subsequently, we identified differential expression of lactated, phosphorylated, and succinylated modified proteins (DE-LMPs, DE-PMPs, and DE-SMPs) (Supplementary Tables S6–S8). Supplementary Figure S10–S12a-b showed the expression and related functions of the differentially modified sites of DE-LMP, DE-PMP, and DE-SMP between BCA and PBCA samples. Supplementary Figures S10–S12c-e respectively displayed the subcellular localization, chromosomal localization, and PPI network analysis results of the differentially modified proteins, revealing their roles in cellular processes.
Combined Analysis of Proteomics, Protein Modification Proteomics, and Metabolomics
Through the joint analysis of proteomics and protein modification proteomics, it was found that there were 508 common proteins with lactylation modifications, 1,098 common proteins with phosphorylation modifications, and 344 common proteins with succinylation modifications (Supplementary Tables S9–S11 and Supplementary Figure S13a–c). These proteins were notably prevalent in multiple KEGG signaling pathways, including essential functions like spliceosome activity, adhesion, ATP-dependent chromatin remodeling, the role of proteoglycans in cancer, and platelet activation (Supplementary Figure S13d–f). Supplementary Figure S13g–i displayed the interaction relationships of these common proteins. Additionally, 163 proteins undergo three types of post-translational modifications (PTMs) simultaneously (Supplementary Table S12 and Supplementary Figure S13j), revealing their important roles in regulating cellular functions and cancer progression.
In exploring the correlation between proteins and metabolites, we analyzed the associations between DEPs, DE-LMPs, DE-PMPs, DE-SMPs, and DEMs. The results showed that 10 DEPs, 17 DE-LMPs, 44 DE-PMPs, and 9 DE-SMPs are highly correlated with DEMs (Supplementary Figure S14a–d). Moreover, the analysis revealed a complex interaction network between proteins and metabolites (Supplementary Figure S14e–i), providing an important foundation for further research.
Combined Analysis of Protein, Metabolome, and Transcriptome to Obtain Key Proteins
In the analysis of BCa samples from the TCGA-BLCA dataset, through the correlation analysis of 8 prognostic genes and DEP, LMPs, PMPs, SMPs, which were highly correlated with DEMs, multiple key proteins were identified. These included DEPs such as CCR6 and APTX, DE-LMPs such as PAICS, TNFAIP2, PRPF38B, and DAZAP1, DE-PMPs such as PCDH7, MICAL2, F13A1, PPIA, PLCB4, GRHL2, NFXL1, PPP1R13L, APBB2, and CMKLR1, and DE-SMPs such as ACAT1 (Figure 10A, D and Supplementary Figure S15a-d). Additionally, the upstream kinases of these key proteins were predicted (Figure 10E–H). These findings provided an important basis for further investigation of the mechanism of action of post-translational modification of proteins in BCa.
 |
Figure 10 Joint analysis of proteins, metabolomes and transcriptomes (A–D) Bubble plots depicting metabolism-associated DEPs, LMPs, PMPs, and SMPs with strong prognostic gene correlations. (E–H) Upstream kinase network map of metabolism-related DEPs, LMPs, PMPs and SMPs. |
Integrated Transcriptomic and Proteomic Analysis Reveals Regulatory Gene Changes Associated with Survival in BCa Patients
To gain insight into how prognostic genes influence the progression of BCa, we performed a comprehensive analysis of 119 candidate genes involved in interactions with DEPs, DE-LMPs, DE-PMPs, and DE-SMPs. The analysis revealed that 49 DEPs showed a down-regulation trend (Supplementary Figure S16a), of which 7 were prognostic genes: CASQ2, DTNA, FLNC, KCNMA1, MYH11, PRKG1, and SGCD. These DEPs were mainly enriched in biological pathways such as cytoskeleton construction of muscle cells and vascular smooth muscle contraction (Figure 11A, B and Supplementary Tables S13–S14), which were significantly linked with the overall survival of patients (Supplementary File 2). Analysis against DE-PMPs revealed that CENPA showed positive regulation at the transcriptional and protein levels, while 18 other genes showed negative regulation (Supplementary Figure S16b). These downregulated genes included two prognostic genes, FLNC and MYH11, which were enriched in graphene oxide function and KEGG pathways associated with muscle contraction and cytoskeletal regulation (Figure 11C, D and Supplementary Tables S15 and S16). Notably, these genes had a significant correlation with patient overall survival (Supplementary File 3). When analyzing DE-SMPs, no positively regulated genes were identified, but negative regulation of MYH11 was observed to have a significant effect on overall survival in BCa patients (Supplementary Figure S16c and Figure 11E). This finding highlighted the important role of protein modifications in cancer development, especially the function of phosphorylation and succinylation modifications in regulating protein activity and stability, and further revealed the critical position of proteomics and proteomics of protein modifications in cancer prognostic studies.
 |
Figure 11 Joint analysis of proteomics and protein modificationomics Identification of GO and KEGG entries involved by 49 DEPs (A–B) and DE-PMPs (C–D). (E) Kaplan-Meier curves between high and low MYH11 expression groups. |
A Comprehensive Single-Cell Sequencing Analysis Revealed Cellular Dynamics and Molecular Variations in BCa
To investigate the expression and distribution of prognostic genes at the single-cell level, we employed the GSE135337 dataset for an in-depth analysis. After stringent quality control measures, our study included 42,823 cells and 21,489 genes that met the specified criteria (Supplementary Figure S17a). We effectively eliminated batch effects (Supplementary Figure S17b) and used UMAP clustering to identify eight distinct cell populations (Supplementary Figure S17c). Based on marker genes, five cell types were distinguished: uroepithelial cells, myeloid/macrophages, T cells, fibroblasts, and endothelial cells (Supplementary Figure S17d–f and Supplementary Table S17). In comparative analyses between samples, uroepithelial cells were notably more abundant in the BCa group (Figure 12A, B and Supplementary Figure S17g). Additionally, we noted significant variations in the expression levels of marker genes among the various cell types (Figure 12C, D and Supplementary Figure S17h). The pathways enriched with these marker genes in various cell types are depicted in Figure 12E. CNV variant analysis underscored significant copy number variations specifically in uroepithelial cells (Figure 12F–H). Through pseudo-temporal trajectory analysis, we discovered a gradual transformation of low-malignancy uroepithelial tumors into high-malignancy forms over time (Figure 12I and J), shedding light on the dynamic nature of tumor progression and providing insights into potential therapeutic targets.
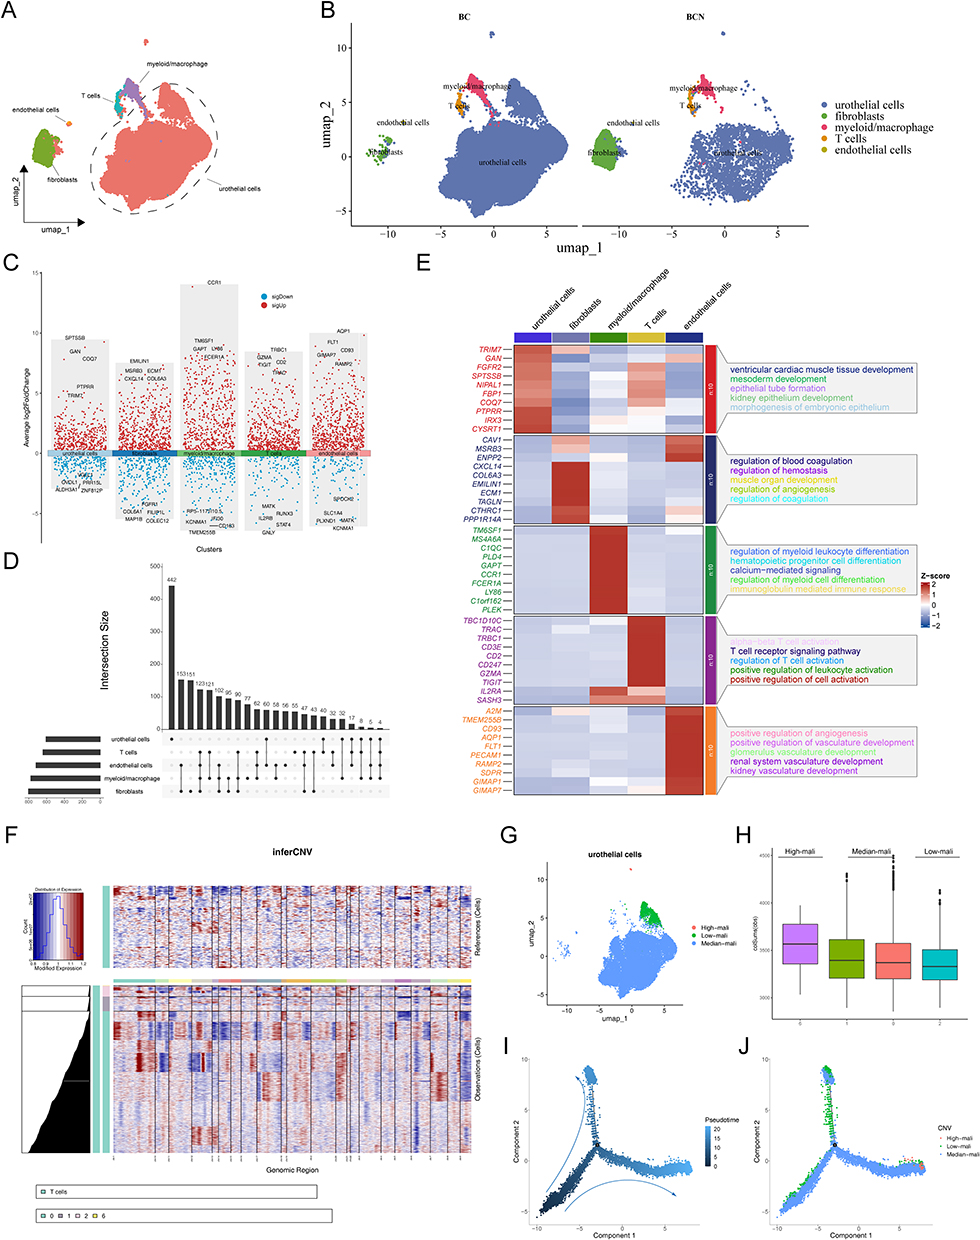 |
Figure 12 Single-cell transcriptome analysis in BCa. (A) UMAP plots for 42,823 cells in BCa single-cell datasets. (B) Distribution of cell clusters in BC and BCN. (C and D) Distribution of differential marker genes between cells. (E) Heatmap showing the highest differential marker genes and functional pathways in each cell type. (F) The heatmap shows the CNV signaling of each cluster of T cells. (G) U-MAP plot showing the three subclusters of uroepithelial cells. (H) Box plots of the score for each uroepithelial cluster. (I and J) The trajectory of the differentiation process is colored by state and cell type. |
Fibroblasts as Critical Cells
By comparing the expression of prognostic genes across five major cell types, we found that fibroblasts exhibit relatively higher expression of these genes, especially in BCN samples compared to BCa samples, suggesting that fibroblasts play a critical role in disease progression (Figure 13A and B). Fibroblasts have been shown to play multiple roles in tumor development.33 Hence, we conducted dimensionality reduction clustering on these key cells, identifying four subtypes of cells (0, 1, 2, 3) (Figure 13C). Through pseudo-temporal analysis, we identified five different differentiation states in fibroblasts (state1-5) (Figure 13D). The distribution of different subtypes in these differentiation states was shown in Figure 13E, with subtype 0 mainly found in state2 and state5, subtype 1 predominantly in state1, and subtypes 2 and 3 primarily in state4. Further examination showed that MYH11 and PLN had high expression levels in the later differentiation stages, particularly in state4 and subtype 3 (Figure 13F and Supplementary Figure S18a). Additionally, cell communication analysis revealed interactions between fibroblasts and other cell types. In both BCa and BCN samples, uroepithelial cells exhibited the highest number and intensity of interactions with other cell types (Figure 13G and H). Supplementary Figure S18b-c showed the ligand-receptor pairs involved in cell communication in BCa and BCN samples.
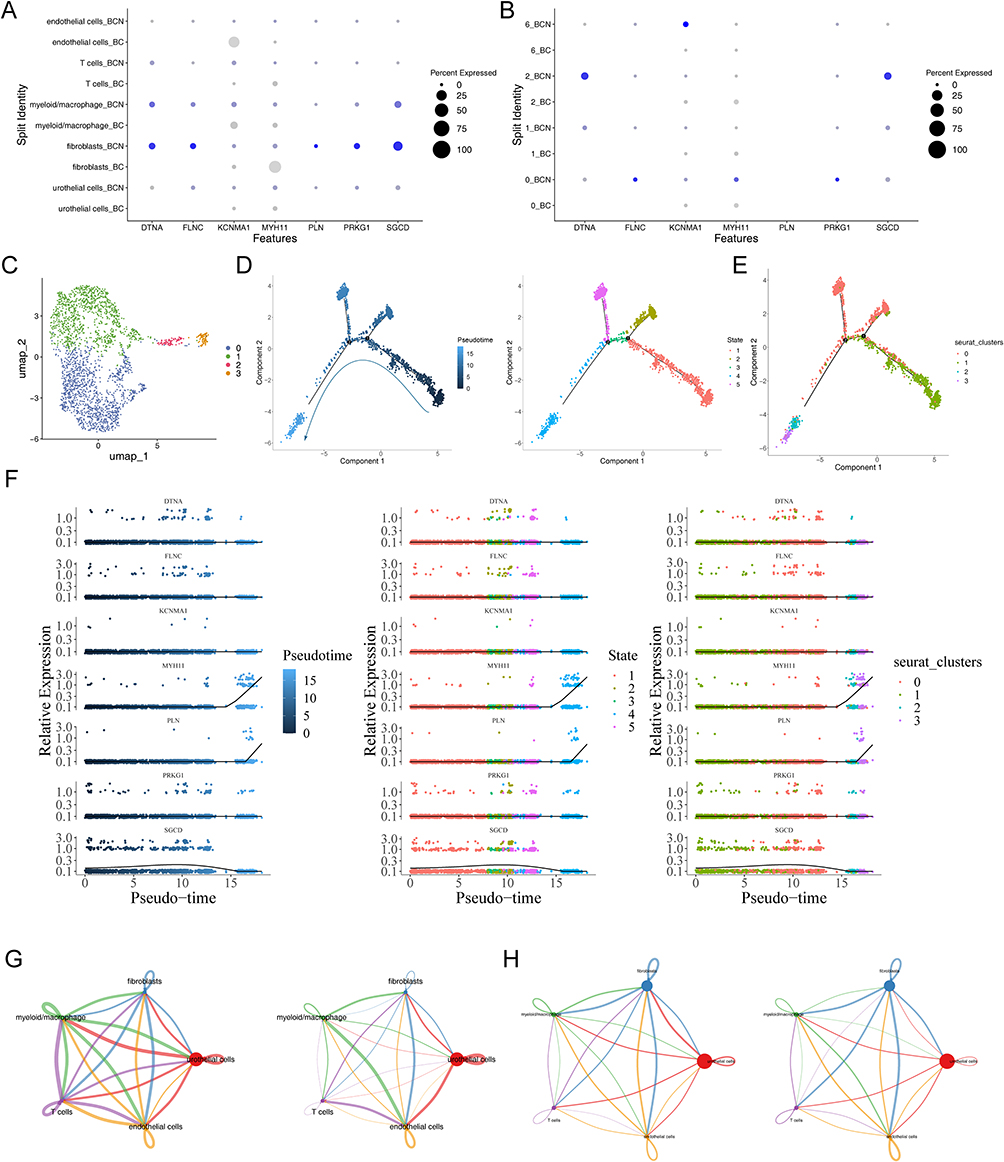 |
Figure 13 Analysis of prognostic genes and key cells. (A and B) The expression of prognostic genes in BC and BCN groups of key cells and uroepithelial cells. (C) UMAP map of fibroblasts subtypes. (D and E) Pseudo-temporal analysis of fibroblasts, colored by subtype and differentiation status. (F) Prognostic gene expression in subtypes across different differentiation states. (G and H) Interaction numbers and weight between 5 cell types in BC and BCA samples. |
Finally, we observed particularly strong interactions between fibroblasts and endothelial cells in both BCa and BCN samples (Supplementary Figure S18d-e). This could be crucial in the disease’s development and pathology.
MYH11 Is Lowly Expressed in BCa Patients
To validate the role of MYH11 in the development and progression of BCa, IHC staining, and Western blot analyses were performed on clinical BCa tumor samples and adjacent normal tissues, both of which consistently showed that MYH11 expression was significantly lower in BCa tumor tissues compared to peri-tumoral tissues (Figure 14A and B).
 |
Figure 14 Validation of MYH11 expression levels and knockdown of MYH11 significantly inhibits BCa proliferation, invasion, and migration. (A and B) MYH11 was downregulated in BCa tissues compared to adjacent non-tumor tissues. (C) MYH11 was upregulated in normal bladder uroepithelial cell lines. (***P<0.001). (D and E) Knockdown and overexpression efficiency of MYH11 in T24 and 5637 cells. (F and G) Colony formation assay and CCK8 assays indicate that MYH11 knockdown increased the proliferation capacity of BCa cells. (*P<0.05, **P<0.01, ***P<0.001). (H and I) Transwell assays show that MYH11 depletion enhanced the invasion capacity of BCa cells. (***P<0.001). (J and K) Wound healing assays indicate that the decreased expression of MYH11 promoted the rate of wound healing. (***P<0.001). |
Overexpression of MYH11 Inhibits Proliferation, Migration, and Invasion of BCa Cells
To further explore the role of MYH11 in BCa development, we examined its expression levels in various BCa and normal bladder uroepithelial cell lines, followed by knockdown and overexpression experiments in cells with differing MYH11 expression levels (Figure 14C). Specifically, 5637 cells with low MYH11 expression were transfected with the oe-MYH11 plasmid (Figure 14D) to induce overexpression, while T24 cells with high MYH11 expression were transfected with the sh-MYH11 plasmid (Figure 14E) to achieve knockdown. We then assessed the impact of MYH11 expression on the proliferation of these cells. CCK8 assay results revealed that MYH11 overexpression significantly inhibited BCa cell growth (Figure 14G). Additionally, the colony formation assay showed a marked reduction in colony-forming ability (Figure 14F), and wound healing and Transwell assays indicated a significant decrease in the migration and invasion capabilities of BCa cells following MYH11 overexpression (Figure 14H–K). Collectively, these results reaffirm that MYH11 plays an essential role in the development of BCa.
Discussion
BCa is a frequently occurring urological tumor, despite intensive treatment and advanced research in the past decades, the prognosis of patients has not been substantially improved, with a median OS of about 14 months.34 In the current study, we combined transcriptomic data and machine learning algorithms to identify eight critical genes strongly associated with the prognosis and treatment of BCa patients and established a prognosis model. In parallel, aiming to discover the molecular mechanisms behind the phenotypic differences, we further conducted comparative analyses of proteomics, post-translational modification data, metabolomics, and single-cell data. Our results exhibited that the eight critical prognostic genes were regulated by multi-layered pathological activities, involved in diverse cellular signaling pathways such as cytoskeleton construction and muscle contraction, and performed important roles in the cellular trajectory of fibroblasts, a pivotal cell type that contributes to the development of BCa. We believe that to some extent these results will shed some valuable light on the future treatment of BCa. These findings underscore the complexity of BCa biology and provide novel insights into the interplay between gene expression, post-translational modifications, and cellular phenotypes. By elucidating these relationships, our study offers a valuable resource for identifying potential therapeutic targets and advancing precision medicine for BCa.
Among the recognized prognostic critical genes, they are mainly categorized into two types, starting with ion channel-associated proteins, including CASQ2, PRKG1, KCNMA1, and PLN, which are localized in the endoplasmic reticulum and cytoplasmic membranes,35 and function as regulators of cell proliferation, apoptosis, hypoxia, and the immune microenvironment and other essential roles,36–38 but the role in BCa development has not been clarified. The other category is cytoskeleton construction-associated proteins, including DTNA, SGCD, FLNC, and MYH11. The cytoskeleton is a complex and dynamic network of protein fibers in eukaryotic cells, which determines cellular morphology and regulates normal cellular activities and can influence cellular adhesion when aberrantly expressed, promoting the invasion of hepatocellular carcinoma cells and glioblastoma multiforme.39,40 MYH11, a cytoskeleton-associated protein that encodes a key contractile element in smooth muscle cells, exhibits cancer type-dependent functional diversity. In hematologic malignancies such as acute myeloid leukemia, MYH11 frequently participates in chromosomal translocations, leading to the formation of fusion proteins that disrupt normal gene regulatory networks.41 However, in solid tumors, the role of MYH11 appears to be more context-dependent. In colorectal cancer, reduced MYH11 expression has been correlated with poor clinical outcomes,42 suggesting a potential tumor-suppressive function. Conversely, in gastric cancer, MYH11 upregulation has been shown to inhibit tumor growth, possibly through interaction with the DNA methyltransferase DNMT3B via hypermethylation-mediated gene regulation.43 Notably, recent studies have implicated MYH11 as a key gene associated with BCa progression and prognosis.44 Nevertheless, the precise molecular mechanisms underlying its role in BCa remain unclear. These findings collectively indicate that the function of MYH11 in tumorigenesis is highly context-specific and may involve distinct regulatory pathways across different cancer types. Here in our study, we examined the multifaceted roles of MYH11 and revealed that high expression of MYH11 was negatively correlated with OS in patients with BCa, and was also regulated by phosphorylation and succinimidylation modifications, as well as displaying elevated expression during differentiation of fibroblast subpopulations, which may be related to the progression of BCa. However, the in vitro experimental results of this study showed that overexpression of MHY11 can inhibit the proliferation, invasion, and migration capabilities of BCa cells, indicating that MYH11 may exert a dual role in BCa. At the cellular level, MYH11 might function as a tumor suppressor, whereas its high expression within specific tumor microenvironment contexts, particularly in certain fibroblast subpopulations, could promote a more aggressive cancer phenotype. This context-dependent behavior highlights the potential of MYH11 as a biomarker for disease stratification or as a therapeutic target under specific biological conditions. Therefore, further in-depth investigations into the mechanistic role of MYH11 in BCa are warranted, which may provide novel insights for the development of new therapeutic strategies.
In several large-scale clinical trials over the past few years, including CheckMate274, CheckMate901, EV-301, and EV302, the findings suggested that immune checkpoint inhibitors and adjuvant therapy with Antibody-drug conjugates (ADCs) significantly improved the median overall survival and progression-free survival of high-risk, locally-progressive and metastatic BCa patients,45 which demonstrated that immunotherapy would gradually capture the mainstream in the future treatment of BCa. In reality, however, only about 20–40% of patients with progressive BCa significantly benefit from adjuvant immunotherapy,46 so we need more compatible tools for accurate stratification. Here, the critical prognostic genes we screened were positively collocated with the expression levels of multiple anti-tumor immune cell infiltration and immune checkpoints, with higher immune infiltration for patients in the high-risk group but higher response rates to immunotherapy for patients in the low-risk group, so the risk model we developed can be served as a predicting tool for immunotherapy in patients with BCa. Furthermore, we conducted targeted drug testing for patients in the high-risk group, and the significant high expression of SRC, a known target of Dasatinib,47 in BCa patients in the high-risk group implicated that SRC could be used as a potential target for the treatment of patients in the high-risk group of BCa patients. These results highlight the clinical potential of our risk model not only as a stratification tool for immunotherapy but also for guiding personalized treatment regimens for BCa patients, thereby enhancing therapeutic efficacy.
Numerous researchers have developed several BCa prognostic models at the transcriptomics scale,48–50 with a certain degree of consistency in biological characteristics and clinicopathological features. Nevertheless, the regulation between genomic abnormalities and oncogenic proteins is often a vital focus for the mechanism of tumorigenesis,5 whereas the integrated multi-omic analysis precisely compensates for these deficiencies, providing a comprehensive view and unbiased molecular classification of the intricate biological signature of BCa. Similar to previous studies, we initially established transcriptomic categorizers, which can be considered independent prognostic factors for BCa patients and guidelines for treatment. PTMs are deemed to be essential for maintaining genome stability,51 therefore we analyzed PTMs and proteomics intellectually and detected 163 proteins that were regulated by all three PTMs simultaneously, which were significantly enriched in the spliceosome, cellular adhesion, and ATP-dependent chromosome remodeling pathways, suggesting that PTMs may be an important cause of genomic instability in BCa patients. By providing these insights, our study not only enriches the understanding of BCa biology but also highlights the potential of targeting PTM-related pathways as a therapeutic strategy, offering new avenues for precision medicine in BCa. Furthermore, we determined that the crucial pathway for BCa tumorigenesis was cytoskeletal construction after integration of transcriptomics, proteomics, and post-translational modification histology analyses. The invasive capacity of tumor cells has been characterized by loss of intercellular junctions and adhesion, increased motility, and rearrangement of cytoskeletal proteins.52. Our findings suggest that targeting cytoskeletal protein modulation could serve as an effective approach to mitigate BCa progression, emphasizing the translational potential of our multi-omics approach. Finally, we also analyzed intercellular heterogeneity and found that prognostic critical genes were significantly overexpressed in fibroblasts. It has been confirmed that fibroblasts were the main constituents of stroma and played important roles in the tumor microenvironment of patients with BCa, such as promotion of tumor proliferation, drug resistance, and immune evasion,33,53 we speculated that critical prognostic genes might work through regulation of fibroblasts to boosting the onset and progression of BCa. In summary, the multi-omics analysis thoroughly resolved the complex biology of BCa from multiple viewpoints, and the established unbiased molecular categorizer has significant clinical significance and potential to enhance the interpretation and management of BCa.
Together with multi-omics analysis, we mapped the regulatory distribution of BCa at the transcriptomics, proteomics, post-translational modifiers, and metabolomics dimensions in terms of molecular interaction networks, pathway enrichment, and molecular localization, which strengthened our understanding of the etiology of BCa. Despite the advances realized in our study, it is important to note that some limitations need further addressing and in-depth exploration. For one thing, the risk model we developed was primarily based on transcriptomic data; however, the inclusion of multi-omics analysis further enhanced the understanding of gene regulation across different molecular layers. This will contribute to ensuring the reliability and reproducibility of the analysis results and provide a more solid foundation for clinical application in BCa cancer patients. Additionally, our study primarily relied on computational analyses and bioinformatics tools, with only basic experimental verification supporting our preliminary findings. To thoroughly investigate the functions of MYH11 in BCa, further in vivo and in vitro experiments are essential. Expanding this experimental research will provide a more comprehensive and detailed understanding of the specific mechanisms through which MYH11 influences the development and progression of BCa. In addition, we plan to include a larger cohort of clinical samples in future studies to further validate our findings and minimize the potential bias caused by sample heterogeneity and limited sample size. Consequently, future research should focus on broader experimental designs to systematically and comprehensively elucidate the role of MYH11 in BCa biology.
Conclusion
This study provides a comprehensive understanding of BCa by integrating multi-omics data with machine learning to identify key prognostic genes and develop a robust risk model. MYH11 emerges as a critical tumor-inhibiting factor, with significant implications for improving prognostic predictions and therapeutic strategies in BCa. Future research focusing on broader experimental designs will further elucidate the molecular mechanisms underlying BCa, enhancing the clinical management of this disease.
Data Sharing Statement
Derived data supporting the methodology of this study are available from the corresponding author upon reasonable request.
Ethical Approval
All procedures were performed under a protocol approved by the Ethical Committee of The Second Affiliated Hospital of Kunming Medical University and with the principles of the Declaration of Helsinki.
Acknowledgments
We would like to thank the researchers and staff of the above software and databases.
Author Contributions
All authors made a significant contribution to the work reported, whether that is in the conception, study design, execution, acquisition of data, analysis and interpretation, or in all these areas; took part in drafting, revising or critically reviewing the article; gave final approval of the version to be published; have agreed on the journal to which the article has been submitted; and agree to be accountable for all aspects of the work.
Funding
This research is supported by the National Natural Science Foundation of China (grant No. 82060464, grant No. 82260609, grant No.82360603). Yunnan Fundamental Research Projects (grant No. 202001AY070001-163, grant No. 202201AU070220, grant No. 202201AY070001-113, grant No. 202401AU070010). Yunnan Provincial Department of Education Project (grant No. 2024J0225).
Disclosure
The authors declare that they have no known competing financial interests or personal relationships that could have appeared to influence the work reported in this paper.
References
1. Teoh JY, Huang J, Ko WY-K, et al. Global trends of bladder cancer incidence and mortality, and their associations with tobacco use and gross domestic product per capita. Eur Urol. 2020;78:893–906. doi:10.1016/j.eururo.2020.09.006
2. van Hoogstraten LMC, Vrieling A, van der Heijden AG, et al. Global trends in the epidemiology of bladder cancer: challenges for public health and clinical practice. Nat Rev Clin Oncol. 2023;20:287–304. doi:10.1038/s41571-023-00744-3
3. Groeneveld CS, Sanchez-Quiles V, Dufour F, et al. Proteogenomic characterization of bladder cancer reveals sensitivity to apoptosis induced by tumor necrosis factor-related apoptosis-inducing ligand in FGFR3-mutated tumors. Eur Urol. 2024;85:483–494. doi:10.1016/j.eururo.2023.05.037
4. Larroquette M, Lefort F, Domblides C, et al. How Immunotherapy has redefined the treatment paradigm of metastatic or locally advanced muscle-invasive urothelial bladder carcinoma. Cancers. 2024;16:1780. doi:10.3390/cancers16091780
5. Xu N, Yao Z, Shang G, et al. Integrated proteogenomic characterization of urothelial carcinoma of the bladder. J Hematol Oncol. 2022;15:76. doi:10.1186/s13045-022-01291-7
6. Lindskrog SV, Prip F, Lamy P, et al. An integrated multi-omics analysis identifies prognostic molecular subtypes of non-muscle-invasive bladder cancer. Nat Commun. 2021;12:2301. doi:10.1038/s41467-021-22465-w
7. Ossoliński K, Ruman T, Copié V, et al. Metabolomic and elemental profiling of blood serum in bladder cancer. J Pharm Anal. 2022;12:889–900. doi:10.1016/j.jpha.2022.08.004
8. Tan Z, Chen X, Zuo J, et al. Comprehensive analysis of scRNA-Seq and bulk RNA-Seq reveals dynamic changes in the tumor immune microenvironment of bladder cancer and establishes a prognostic model. J Transl Med. 2023;21:223. doi:10.1186/s12967-023-04056-z
9. Lai H, Cheng X, Liu Q, et al. Single-cell RNA sequencing reveals the epithelial cell heterogeneity and invasive subpopulation in human bladder cancer. Int J Cancer. 2021;149:2099–2115. doi:10.1002/ijc.33794
10. Lee JS, Leem S-H, Lee S-Y, et al. Expression signature of E2F1 and its associated genes predict superficial to invasive progression of bladder tumors. J Clin Oncol. 2010;28:2660–2667. doi:10.1200/JCO.2009.25.0977
11. Riester M, Werner L, Bellmunt J, et al. Integrative analysis of 1q23.3 copy-number gain in metastatic urothelial carcinoma. Clin Cancer Res. 2014;20:1873–1883. doi:10.1158/1078-0432.CCR-13-0759
12. Lindgren D, Sjödahl G, Lauss M, et al. Integrated genomic and gene expression profiling identifies two major genomic circuits in urothelial carcinoma. PLoS One. 2012;7:e38863. doi:10.1371/journal.pone.0038863
13. Love MI, Huber W, Anders S. Moderated estimation of fold change and dispersion for RNA-seq data with DESeq2. Genome Biol. 2014;15:550. doi:10.1186/s13059-014-0550-8
14. Langfelder P, Horvath S. WGCNA: an R package for weighted correlation network analysis. BMC Bioinform. 2008;9:559. doi:10.1186/1471-2105-9-559
15. Zhang H, Meltzer P, Davis S. RCircos: an R package for Circos 2D track plots. BMC Bioinform. 2013;14:244. doi:10.1186/1471-2105-14-244
16. Yu G, Wang LG, Han Y, He QY. clusterProfiler: an R package for comparing biological themes among gene clusters. OMICS. 2012;16:284–287. doi:10.1089/omi.2011.0118
17. Liu P, Xu H, Shi Y, Deng L, Chen X. Potential molecular mechanisms of plantain in the treatment of gout and hyperuricemia based on network pharmacology. Evid Based Complement Alternat Med. 2020;2020:3023127. doi:10.1155/2020/3023127
18. Robin X, Turck N, Hainard A, et al. pROC: an open-source package for R and S+ to analyze and compare ROC curves. BMC Bioinform. 2011;12:77. doi:10.1186/1471-2105-12-77
19. Ramsay IS, Ma S, Fisher M, et al. Model selection and prediction of outcomes in recent onset schizophrenia patients who undergo cognitive training. Schizophr Res Cogn. 2017;11:1–5. doi:10.1016/j.scog.2017.10.001
20. Blanche P, Dartigues JF, Jacqmin-Gadda H. Estimating and comparing time-dependent areas under receiver operating characteristic curves for censored event times with competing risks. Stat Med. 2013;32:5381–5397. doi:10.1002/sim.5958
21. Wilkerson MD, Hayes DN. ConsensusClusterPlus: a class discovery tool with confidence assessments and item tracking. Bioinformatics. 2010;26:1572–1573. doi:10.1093/bioinformatics/btq170
22. Liberzon A, Birger C, Thorvaldsdóttir H, et al. The Molecular Signatures Database (MSigDB) hallmark gene set collection. Cell Syst. 2015;1:417–425. doi:10.1016/j.cels.2015.12.004
23. Wang L, Wang D, Yang L, et al. Cuproptosis related genes associated with Jab1 shapes tumor microenvironment and pharmacological profile in nasopharyngeal carcinoma. Front Immunol. 2022;13:989286. doi:10.3389/fimmu.2022.989286
24. Zeng D, Ye Z, Shen R, et al. IOBR: multi-omics immuno-oncology biological research to decode tumor microenvironment and signatures. Front Immunol. 2021;12:687975. doi:10.3389/fimmu.2021.687975
25. Fu S, Tan Z, Shi H, et al. Development of a stemness-related prognostic index to provide therapeutic strategies for bladder cancer. NPJ Precis Oncol. 2024;8:14. doi:10.1038/s41698-024-00510-3
26. Orifjon S, Jammatov J, Sousa C, et al. Translation and adaptation of the Adult Developmental Coordination Disorder/Dyspraxia Checklist (ADC) into Asian Uzbekistan. Sports. 2023;11:135. doi:10.3390/sports11070135
27. Yoshihara K, Shahmoradgoli M, Martínez E, et al. Inferring tumour purity and stromal and immune cell admixture from expression data. Nat Commun. 2013;4:2612. doi:10.1038/ncomms3612
28. Chen H, Boutros PC. VennDiagram: a package for the generation of highly- customizable Venn and Euler diagrams in R. BMC Bioinform. 2011;12:35. doi:10.1186/1471-2105-12-35
29. Satija R, Farrell JA, Gennert D, Schier AF, Regev A. Spatial reconstruction of single-cell gene expression data. Nat Biotechnol. 2015;33:495–502. doi:10.1038/nbt.3192
30. Trapnell C, Cacchiarelli D, Grimsby J, et al. The dynamics and regulators of cell fate decisions are revealed by pseudotemporal ordering of single cells. Nat Biotechnol. 2014;32:381–386. doi:10.1038/nbt.2859
31. Altman DG, McShane LM, Sauerbrei W, Taube SE. Reporting recommendations for tumor marker prognostic studies (REMARK): explanation and elaboration. BMC Med. 2012;10:51. doi:10.1186/1741-7015-10-51
32. Garnett MJ, Edelman EJ, Heidorn SJ, et al. Systematic identification of genomic markers of drug sensitivity in cancer cells. Nature. 2012;483:570–575. doi:10.1038/nature11005
33. Biffi G, Tuveson DA. Diversity and Biology of Cancer-Associated Fibroblasts. Physiol Rev. 2021;101:147–176. doi:10.1152/physrev.00048.2019
34. Witjes JA, Bruins HM, Cathomas R, et al. European Association of Urology guidelines on muscle-invasive and metastatic bladder cancer: summary of the 2020 guidelines. Eur Urol. 2021;79:82–104. doi:10.1016/j.eururo.2020.03.055
35. Ge L, Hoa NT, Wilson Z, et al. Big Potassium (BK) ion channels in biology, disease and possible targets for cancer immunotherapy. Int Immunopharmacol. 2014;22:427–443. doi:10.1016/j.intimp.2014.06.040
36. Kim JH, Lee E-S, Yun J, et al. Calsequestrin 2 overexpression in breast cancer increases tumorigenesis and metastasis by modulating the tumor microenvironment. Mol Oncol. 2022;16:466–484. doi:10.1002/1878-0261.13136
37. Basile MS, Fagone P, Mangano K, et al. KCNMA1 expression is downregulated in colorectal cancer via epigenetic mechanisms. Cancers. 2019;11:245. doi:10.3390/cancers11020245
38. Benvenuto G, Todeschini P, Paracchini L, et al. Expression profiles of PRKG1, SDF2L1 and PPP1R12A are predictive and prognostic factors for therapy response and survival in high-grade serous ovarian cancer. Int J Cancer. 2020;147:565–574. doi:10.1002/ijc.32935
39. Hu ZG, Zhang S, Chen Y-B, et al. DTNA promotes HBV-induced hepatocellular carcinoma progression by activating STAT3 and regulating TGFβ1 and P53 signaling. Life Sci. 2020;258:118029. doi:10.1016/j.lfs.2020.118029
40. Kamil M, Shinsato Y, Higa N, et al. High filamin-C expression predicts enhanced invasiveness and poor outcome in glioblastoma multiforme. Br J Cancer. 2019;120:819–826. doi:10.1038/s41416-019-0413-x
41. Wang S, Liu Y, Zhao X, et al. RUNX1::ETO and CBFβ::MYH11 converge on aberrant activation of BCAT1 to confer a therapeutic vulnerability in core-binding factor-acute myeloid leukaemia. Br J Haematol. 2024;205:552–567. doi:10.1111/bjh.19565
42. Wang R, Wu P, Cai G-X, et al. Down-regulated MYH11 expression correlates with poor prognosis in stage II and III colorectal cancer. Asian Pac J Cancer Prev. 2014;15:7223–7228. doi:10.7314/APJCP.2014.15.17.7223
43. Wang J, Xu P, Hao Y, et al. Interaction between DNMT3B and MYH11 via hypermethylation regulates gastric cancer progression. BMC Cancer. 2021;21:914. doi:10.1186/s12885-021-08653-3
44. Jiang S, Ma J, Wei S, et al. Identification of hub genes associated with progression and prognosis of bladder cancer by integrated bioinformatics analysis. Arch Esp Urol. 2022;75:779–790. doi:10.56434/j.arch.esp.urol.20227509.114
45. Lopez-Beltran A, Cookson MS, Guercio BJ, Cheng L. Advances in diagnosis and treatment of bladder cancer. BMJ. 2024;384:e076743. doi:10.1136/bmj-2023-076743
46. Powles T, Csőszi T, Özgüroğlu M, et al. Pembrolizumab alone or combined with chemotherapy versus chemotherapy as first-line therapy for advanced urothelial carcinoma (KEYNOTE-361): a randomised, open-label, Phase 3 trial. Lancet Oncol. 2021;22:931–945. doi:10.1016/S1470-2045(21)00152-2
47. Leclercq G, Haegel H, Schneider A, et al. Src/lck inhibitor dasatinib reversibly switches off cytokine release and T cell cytotoxicity following stimulation with T cell bispecific antibodies. J Immunother Cancer. 2021;9:e002582. doi:10.1136/jitc-2021-002582
48. Jiang Y, Qu X, Zhang M, et al. Identification of a six-gene prognostic signature for bladder cancer associated macrophage. Front Immunol. 2022;13:930352. doi:10.3389/fimmu.2022.930352
49. Xie T, Peng S, Liu S, et al. Multi-cohort validation of Ascore: an anoikis-based prognostic signature for predicting disease progression and immunotherapy response in bladder cancer. Mol Cancer. 2024;23:30. doi:10.1186/s12943-024-01945-9
50. Jiang Y, Zeng Z, Xiong S, et al. New prognostic gene signature and immune escape mechanisms of bladder cancer. Front Cell Dev Biol. 2022;10:775417. doi:10.3389/fcell.2022.775417
51. Thompson LL, Guppy BJ, Sawchuk L, Davie JR, McManus KJ. Regulation of chromatin structure via histone post- translational modification and the link to carcinogenesis. Cancer Metastasis Rev. 2013;32:363–376. doi:10.1007/s10555-013-9434-8
52. Wang X, Liu J, Azoitei A, et al. Loss of ORP3 induces aneuploidy and promotes bladder cancer cell invasion through deregulated microtubule and actin dynamics. Cell Mol Life Sci. 2023;80:299. doi:10.1007/s00018-023-04959-6
53. Liang T, Tao T, Wu K, et al. Cancer-associated fibroblast-induced remodeling of tumor microenvironment in recurrent bladder cancer. Adv Sci. 2023;10:e2303230. doi:10.1002/advs.202303230
 © 2025 The Author(s). This work is published and licensed by Dove Medical Press Limited. The
full terms of this license are available at https://www.dovepress.com/terms.php
and incorporate the Creative Commons Attribution
- Non Commercial (unported, 4.0) License.
By accessing the work you hereby accept the Terms. Non-commercial uses of the work are permitted
without any further permission from Dove Medical Press Limited, provided the work is properly
attributed. For permission for commercial use of this work, please see paragraphs 4.2 and 5 of our Terms.
© 2025 The Author(s). This work is published and licensed by Dove Medical Press Limited. The
full terms of this license are available at https://www.dovepress.com/terms.php
and incorporate the Creative Commons Attribution
- Non Commercial (unported, 4.0) License.
By accessing the work you hereby accept the Terms. Non-commercial uses of the work are permitted
without any further permission from Dove Medical Press Limited, provided the work is properly
attributed. For permission for commercial use of this work, please see paragraphs 4.2 and 5 of our Terms.
Recommended articles
Comprehensive Analysis of the Expression, Prognosis, and Biological Significance of PLOD Family in Bladder Cancer
Chen R, Jiang M, Hu B, Fu B, Sun T
International Journal of General Medicine 2023, 16:707-722
Published Date: 24 February 2023
Metabolomics Reveals Molecular Signatures for Psoriasis Biomarkers and Drug Targets Discovery
Song Q, Chen Y, Ma J, Zhou W, Song J, Wu C, Liu J
Clinical, Cosmetic and Investigational Dermatology 2023, 16:3181-3191
Published Date: 4 November 2023
circPVT1 Inhibits the Proliferation and Aids in Prediction of the Prognosis of Bladder Cancer
Zhou H, Cui X, Zhu L, Xu Z, Wang Z, Shao J
Pharmacogenomics and Personalized Medicine 2024, 17:1-11
Published Date: 5 January 2024
Analysis and Validation of Critical Signatures and Immune Cell Infiltration Characteristics in Doxorubicin-Induced Cardiotoxicity by Integrating Bioinformatics and Machine Learning
Huang C, Pei J, Li D, Liu T, Li Z, Zhang G, Chen R, Xu X, Li B, Lian Z, Chu XM
Journal of Inflammation Research 2024, 17:669-685
Published Date: 2 February 2024
Predictive Value of the Total Bilirubin and CA50 Screened Based on Machine Learning for Recurrence of Bladder Cancer Patients
Zhang X, Ma L
Cancer Management and Research 2024, 16:537-546
Published Date: 31 May 2024