")
Back to Journals » Journal of Inflammation Research » Volume 18
Metabolomic Profiling Reveals Serum Tryptophan as a Potential Therapeutic Target for Systemic Lupus Erythematosus
Authors Wang K , Zhu R, Xu M, Zhu K, Li J, Li C, Meng D, Chen H, Sun L
Received 7 November 2024
Accepted for publication 1 July 2025
Published 7 July 2025 Volume 2025:18 Pages 8899—8913
DOI https://doi.org/10.2147/JIR.S505306
Checked for plagiarism Yes
Review by Single anonymous peer review
Peer reviewer comments 3
Editor who approved publication: Professor Chaim Putterman
Kai Wang,1,2 Rujie Zhu,1 Min Xu,3 Kexin Zhu,1 Ju Li,2 Chang Li,4 Deqian Meng,2 Hongwei Chen,1,3,5 Lingyun Sun1,5
1Department of Rheumatology and Immunology, Nanjing Drum Tower Hospital Clinical College of Nanjing Medical University, Nanjing, 210008, People’s Republic of China; 2Department of Rheumatology and Immunology, The Affiliated Huai’an No.1 People’s Hospital of Nanjing Medical University, Huai’an, 223001, People’s Republic of China; 3Department of Rheumatology and Immunology, Nanjing Drum Tower Hospital, Clinical College of Nanjing University of Chinese Medicine, Nanjing, 210008, People’s Republic of China; 4Department of Medical Laboratory, The Affiliated Huai’an No.1 People’s Hospital of Nanjing Medical University, Huai’an, 223001, People’s Republic of China; 5Department of Rheumatology and Immunology, Nanjing Drum Tower Hospital, The Affiliated Hospital of Nanjing University Medical School, Nanjing, 210008, People’s Republic of China
Correspondence: Lingyun Sun, Department of Rheumatology and Immunology, Nanjing Drum Tower Hospital Clinical College of Nanjing Medical University, Zhongshan Road 321, Nanjing, 210008, People’s Republic of China, Email [email protected] Hongwei Chen, Department of Rheumatology and Immunology, Nanjing Drum Tower Hospital, The Affiliated Hospital of Nanjing University Medical School, Nanjing, 210008, People’s Republic of China, Email [email protected]
Objective: This study aimed to identify potential diagnostic biomarkers for systemic lupus erythematosus (SLE) using metabolomics approaches and machine learning algorithms, and to evaluate therapeutic targets for SLE treatment.
Methods: Serum samples from 44 SLE patients with lupus nephritis, 40 rheumatoid arthritis patients, 39 primary Sjögren’s syndrome patients, and matched healthy controls were analyzed using ultra-performance liquid chromatography-high resolution mass spectrometry (UPLC-HRMS). Eight machine learning algorithms were employed to establish diagnostic models. Partial least squares discriminant analysis (PLS-DA) and orthogonal PLS-DA (OPLS-DA) were used to identify differential metabolites. The therapeutic potential of identified metabolites was validated in MRL-Faslpr mice through histological examination, flow cytometry, and biochemical analysis.
Results: A total of 129 metabolites were detected, with machine learning models achieving area under the curve (AUC) values > 0.8. The principal component regression model performed best with AUC values of 0.99 and 0.96 for training and test datasets, respectively. Two key metabolites, tryptophan and beta-alanine, showed significantly decreased levels in SLE patients compared to healthy controls (both p< 0.05), while exhibiting opposite patterns in other autoimmune diseases. In the mouse model, tryptophan supplementation improved renal histology, reduced proteinuria, increased naïve T cells and central memory T cells, and decreased effector T cell frequencies in both peripheral blood and spleen.
Conclusion: This study demonstrates the successful application of machine learning algorithms to metabolomics data for SLE classification and identifies tryptophan and beta-alanine as potential SLE-specific biomarkers. Tryptophan supplementation shows therapeutic promise in lupus mouse models through immunomodulatory effects on T cell subsets and renal protection.
Keywords: SLE, metabolomic, tryptophan, beta-alanine
Introduction
Systemic lupus erythematosus (SLE) is a multifactorial autoimmune disease that affects multiple systems throughout the body with an adjusted global prevalence of approximately 50–100 cases per 100,000 adults.1 The etiology of SLE remains unknown, although it is believed to be related to genetic and environmental factors.2,3 Moreover, almost half of SLE patients will develop more severe disease with a single-center study demonstrating that approximately 70% of SLE patients had organ damage, of which approximately 50% were mild to moderate, and around 20% had severe organ damage, showing an increasing linear trend with time.4 Lupus nephritis (LN), a form of glomerulonephritis, is one of the most severe organ manifestations of SLE.5 Most SLE patients develop LN within 5 years of SLE diagnosis, and it is often the initial manifestation of SLE.5 Without timely and effective treatment, SLE can cause irreversible damage to the affected organs and eventually lead to death. Currently, the diagnosis of SLE relies on clinical diagnosis, but a portion of SLE patients may still be serologically negative or mainly suffer from organ damage, making the diagnosis of SLE challenging.6,7 Therefore, finding better diagnostic methods to facilitate the diagnosis of SLE, evaluate disease activity, and improve the prognosis of SLE patients is crucial.
With the increasing need for improved diagnostic methods in SLE, recent technological advances, particularly in single-cell and metabolomics analysis, have provided novel opportunities for understanding the disease. Human immunoassay studies have revealed the cellular and molecular basis of clinical symptoms and disease onset in individual patients.8 Metabolomics is a newly developed “omics” technology that follows genomics, protein genomics, and transcriptomics. This approach is based on the comparative study of changes in small molecule metabolite clusters in body fluids after exogenous stimulation or gene mutation. Various analytical platforms are employed in metabolomics, including nuclear magnetic resonance (NMR) spectroscopy and mass spectrometry (MS)-based approaches such as gas chromatography-mass spectrometry (GC-MS) and liquid chromatography-mass spectrometry (LC-MS). Each method offers unique advantages in terms of metabolite coverage and sensitivity. Serum metabolomics represents a particularly attractive approach for biomarker discovery as it is minimally invasive and can provide comprehensive insights into systemic metabolic alterations. Metabolomics has been utilized to identify potential biomarkers of various autoimmune diseases, including primary Sjogren’s syndrome (pSS), rheumatoid arthritis (RA), systemic sclerosis, primary anti-phospholipid syndrome, mixed connective tissue disease, and SLE.9–11 These studies suggest that small metabolites may play essential roles in the development of autoimmune diseases. However, the metabolic nature of SLE disease heterogeneity remains largely unexplored.
In this study, we analyzed the serum of SLE patients and healthy controls (HCs) using metabolomics technology to identify potential diagnostic biomarkers, reveal the correlation between serum metabolites and the development of SLE and disease activity, and conduct corresponding verification studies in animal models. Our work highlights tryptophan as a potential target for the treatment of SLE.
Materials and Methods
Study Populations and Sample Preparation
The study population included 44 SLE patients with LN admitted to the Department of Rheumatology, the Affiliated Huai’an No.1 People’s Hospital of Nanjing Medical University. Diagnostic criteria refer to the 1997 American College of Rheumatology (ACR) SLE classification standard. Age-, sex-, and body mass index (BMI)-matched 40 healthy subjects were HCs. This study also recruited 40 patients with RA and 39 patients with pSS, as well as 38 age-, sex-, and race-matched healthy subjects as non-SLE controls. This study was approved by the institutional review board of the Affiliated Huai’an No.1 People’s Hospital of Nanjing Medical University (Approval number: YX-Z-2017-005-01). All participants in this study provided written informed consent and were informed about the study’s purpose, in accordance with the Declaration of Helsinki. The clinical data of all SLE patients and HCs are shown in Table 1. All patients and HCs avoided strenuous exercise, drinking alcohol, coffee and strong tea one day before sampling. Early in the morning, 5mL venous blood was collected from biochemical tubes. After standing for 30 min at room temperature, the blood was centrifuged at 3000 rpm for 10 min. Five hundred microliters of supernatant was removed and stored at −80°C for further testing.
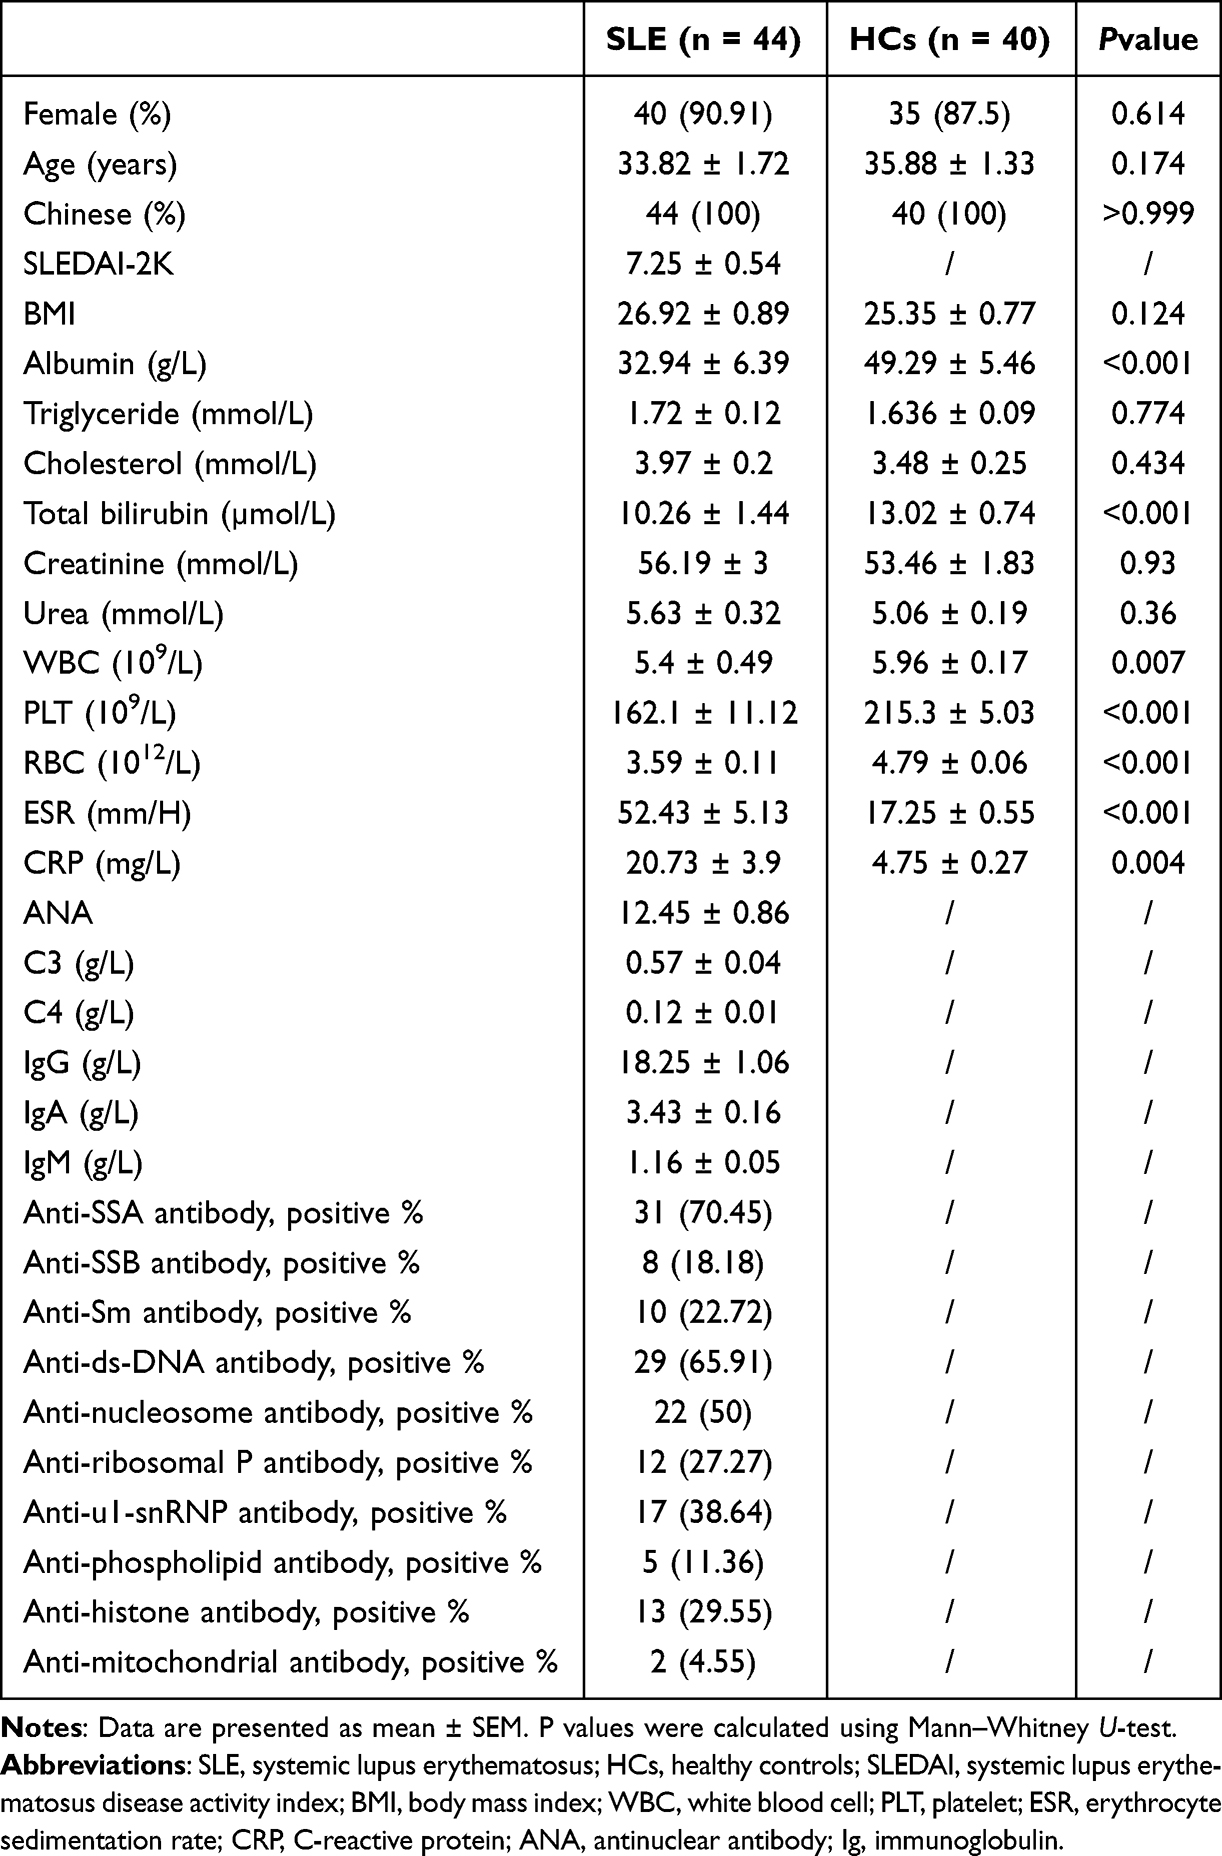 |
Table 1 Demographics and Clinical Characteristics of the Study Participants |
Sample Preparation and Metabolomic Analysis
Serum samples were prepared following Ultra Performance Liquid Chromatography-High Resolution Mass Spectrometry (UPLC-HRMS) protocol. Briefly, 100 μL samples were thawed at 4°C and mixed with 400 μL pre-cooled methanol/acetonitrile solution (1:1, v/v), followed by vortexing and incubation at −20°C for 60 min. After centrifugation (14,000 g, 4°C, 20 min), the supernatant was vacuum-dried and reconstituted in 100 μL acetonitrile/water solution (1:1, v/v). Quality control (QC) samples were prepared by pooling equal aliquots of all samples. Metabolomic analysis was performed on an Agilent 1290 Infinity Liquid Chromatography (LC) system coupled with a Triple Time-Of-Flight (TOF) 5600 mass spectrometer (AB Sciex). Chromatographic separation was achieved using a Hydrophilic Interaction Liquid Chromatography (HILIC) column (1.7 μm, 2.1×100 mm) at 25°C. Mobile phase A (water containing 25 mmol/L ammonium acetate and ammonia) and mobile phase B (acetonitrile) were delivered at 0.3 mL/min. The Mass Spectrometry (MS) analysis was conducted in both positive and negative Electrospray Ionization (ESI) modes with the following parameters: ion source gas1/gas2, 60; curtain gas, 30; source temperature, 600°C; ion spray voltage, ±5500 V; TOF MS scan range, 60–1000 Da; product ion scan range, 25–1000 Da. Information Dependent Acquisition (IDA) was performed in high sensitivity mode with a declustering potential of ±60 V and collision energy of 35±15 eV. Raw data were converted to.mzXML format using ProteoWizard and processed using R package XCMS for peak alignment, retention time correction and peak area extraction. Metabolite identification was performed by accurate mass matching (<25 ppm) and Tandem Mass Spectrometry (MS/MS) spectrum matching against an in-house database. Soft Independent Modeling of Class Analogy-P (SIMCA-P) 14.1 was used for pattern recognition analysis. QC samples were regularly analyzed throughout the analytical run to monitor system stability and data quality.
Data Analysis
The computational analysis was performed using Python (version 3.6.2, Python Software Foundation, Delaware, USA) and R (version 4.0.5, Foundation for Statistical Computing, Vienna, Austria). The “scale” function was used for data standardization. Mann‒Whitney U-tests were used to compare the characteristics of the two groups of subjects. P values less than 0.05 were considered statistically significant.
Machine Learning Approach
Eight different machine learning algorithms implemented in Python were used to establish diagnostic models of SLE. Machine learning models were conducted by Python packages: Bokeh (version 2.3.1), Cimcb (version 2.0.42), Keras (version 2.3.1), Numpy (version 1.19.5), Pandas (version 1.1.5), and Theano (version 1.0.5). Metabolomics data were split into 2/3rd training and 1/3rd testing. The models were trained on the training dataset and tested on the independent test dataset. Fivefold cross-validation was applied to all models. Finally, to create an estimate of the robustness and a measure of generalized predictive ability of these models, we performed bootstrap aggregation with 100 bootstrapped models. This generated a population of 100 model predictions for both the training and holdout test sets from the full dataset. The receiver operating characteristic (ROC) curve displayed the training dataset and the test dataset with 95% confidence intervals.
Identification of the Most Differential Metabolic Biomarkers
Metabolomics data are characterized by many metabolites in a small sample size. There are not only differential variables related to classification variables but also many nondifferential variables that may be related to each other. As a result, if we use the principal component analysis (PCA) model for analysis, the different variables will be dispersed in more principal components due to the influence of related variables. It is impossible to make better visualization and subsequent analysis. Therefore, we adopted partial least squares discriminant analysis methods (PLS-DA) and orthogonal partial least squares discriminant analysis (OPLS-DA) to analyse the metabolomics data. Through PLS-DA or OPLS-DA, orthogonal variables unrelated to classified variables in metabolites can be screened out, and nonorthogonal and orthogonal variables can be analysed to obtain more reliable information about the differences between the metabolome and the correlation between experimental groups. The variable importance in the projection (VIP) parameter was used to evaluate the potential biomarkers, and a value greater than 1 indicated that the variable contributed more to the model. PLS-DA and OPLS-DA models were conducted using the R package “ropls”.12
Biological Functions of Most Differential Metabolites
Metabolic pathways of the most differential metabolites identified using metabolic analysis software (MetaboAnalyst 5.0) were analysed, and the biological significance of the most differential metabolites in the small molecule pathway database (SMPDB)13 and the Kyoto Encyclopedia of Genes and Genomes (KEGG) database14 were further addressed.
Animal Model and Treatment Strategies
In this experiment, MRL-Faslpr mice (#000485, Jackson Laboratories, USA) were randomly divided into 3 groups of 7 mice each as the control group, tryptophan (Trp) group and beta-alanine (β-Ala) group. All mice were maintained on standard laboratory chow manufactured by Jiangsu Synergetic Pharmaceutical Bioengineering Co., Ltd. (Cat. No. 1010013). This diet contains standard levels of nutrients including amino acids (total amino acids 17.93%, including 0.22% Trp), vitamins (eg, Vitamin A 2.06×10⁴ IU/kg, Vitamin D₃ 3.98×10³ IU/kg, Vitamin E 323 IU/kg), and minerals (eg, Fe 238 mg/kg, Zn 131 mg/kg, Se 0.35 mg/kg). From the onset of the disease at 20 weeks, the Trp group was given 12.5 mg/kg Trp (Sigma‒Aldrich, USA) intraperitoneally every 48 hours. The β-Ala group was given 100 mg/kg β-Ala (Sigma‒Aldrich, USA) dissolved in the drinking water for the mice, and the drinking water was changed daily. The control group was given a regular diet and phosphate-buffered salt solution intraperitoneally. Urine and peripheral blood were collected at week 24 for urine protein measurement and serum anti-dsDNA antibody testing. After execution, the kidneys were removed by autopsy and immediately frozen and stored in liquid nitrogen for immunohistochemical staining. The animal experiments were conducted in accordance with the national guidelines for the Care and Use of Laboratory Animals, and the animal study was reviewed and approved by the Animal Ethics and Welfare Committee of the Affiliated Drum Tower Hospital of Nanjing University Medical School (Approval number: 2020AE01041).
Results
Demographics and Clinical Characteristics of the SLE Participants
The demographic characteristics, laboratory examination results, and systemic lupus erythematosus disease activity index (SLEDAI)-2K scores of the included subjects are given in Table 1. As shown in Table 1, there were no significant differences between SLE patients and HCs regarding sex, age or BMI. Albumin, total bilirubin, WBC, RBC, and PLT levels were significantly lower in the patients with SLE than in HCs, whereas ESR and CRP levels were significantly higher in the SLE patients.
Machine Learning Approach and Identification of Significantly Differential Metabolic Biomarkers
After HPLC-HRMS analysis, 129 metabolites were finally detected in the serum samples, which were mainly enriched in sugar, lipid, amino acid, nucleotide, and phenolic metabolism (Figure 1A). To determine whether machine learning algorithms could use metabolomics data to classify patients into SLE or HCs accurately, all metabolites were included in eight machine learning models, all of which had area under the curve (AUC) values over 0.8 in the training and test datasets. The principal component regression (PCR) model performed the best, with AUC values of 0.99 and 0.96 for the test and training datasets, respectively (Figure 1B, Supplementary Table 1).
 |
Figure 1 Heatmap and ROC curve of different machine learning methods for all metabolites (SLE = 44, HCs = 40). (A) Heatmap of all metabolites. (B) ROC curve of eight different machine learning methods for all metabolites. The ROC curve displays the curve for the training dataset (green) and test dataset (yellow) from section 5 with 95% confidence intervals (light green band = IB, light yellow band = OOB). Abbreviations: SLE, systemic lupus erythematosus; HCs, healthy controls; ANN-linear, linear artificial neural network; ANN-nonlinear, nonlinear artificial neural network; SVM-linear, linear kernel support vector machine; SVM-RBF, radial basis function kernel support vector machine; PCLR, principal component logistic regression; PCR, principal component regression; PLS-DA, partial least squares discriminant analysis; RF, random forest; IB, in bag prediction; OOB, out of bag. |
To obtain more reliable information on the degree of correlation between the differences in metabolites and the experimental groups, we first performed PLS-DA of the metabolomics data, and the results of the PLS-DA score plot showed that the two groups of samples were not significantly distinguished. Then, OPLS-DA was used to analyse the dataset again, and the results showed more significant differences between SLE patients and HCs (Supplementary Figure 1A). In the OPLS-DA model, 83 metabolites had FDR < 0.05, 66 metabolites had VIP values > 1.0, and 4 metabolites had VIP values > 1.5 (marked red in Figure 1A). There were no significant differences in the serum concentrations of these four metabolites between SLE patients and HCs (Supplementary Figure 1B). Moreover, there were no significant correlations between these four metabolites and the clinical characteristics of SLE patients (Supplementary Figure 2).
The results in Supplementary Figure 1A show the same six outliers in both the PLS-DA and OPLS-DA models, including 3 HCs and 3 SLE patients. Then, we tried to remove these six outliers and train the dataset again. The heatmap was significantly different for 78 samples compared to 84 samples (Figure 2A), and the AUC values were significantly higher than 0.9 for all models on both the training and test sets (Figure 2B, Supplementary Table 2). The AUC values and R2 values of the test sets of almost all models were increased compared with those of previous models (Figure 3A, Supplementary Table 2). The highest model was still the PCR model, with the AUC values of the training set and the test set being 0.99 and 0.98, respectively (Figure 2B, Supplementary Table 2).
 |
Figure 2 Heatmap and ROC curve of different machine learning methods for all metabolites after removing outliers (SLE = 41, HCs = 37). (A) Heatmap of all metabolites after removing outliers; 2 metabolites had VIP values > 1.5 (Trp and β-Ala, marked red). (B) ROC curve of different machine learning methods for all metabolites after removing outliers. The ROC curve displays the curve for the training dataset (green) and test dataset (yellow) from section 5 with 95% confidence intervals (light green band = IB, light yellow band = OOB). Abbreviations: SLE, systemic lupus erythematosus; HCs, healthy controls; Trp, tryptophan; β-Ala, beta-alanine; ANN-linear, linear artificial neural network; ANN-nonlinear, nonlinear artificial neural network; SVM-linear, linear kernel support vector machine; SVM-RBF, radial basis function kernel support vector machine; PCLR, principal component logistic regression; PCR, principal component regression; PLS-DA, partial least squares discriminant analysis; RF, random forest; IB, in bag prediction; OOB, out of bag; Trp, tryptophan; β-Ala, beta-alanine. |
 |
Figure 3 Identification of key metabolites (SLE = 41, HCs = 37). (A) Heatmap of AUC values and R2 values. The AUC values and R2 values of almost all models’ test sets are increased after removing outliers. (B) Validation of Trp and β-Ala in SLE patients and HCs. Serum concentrations of Trp and β-Ala were significantly lower in SLE patients than in HCs. (C) ROC curve analysis of Trp and β-Ala. (D) OPLS-DA of pSS and RA. The OPLS-DA results showed four and seven outliers for pSS and RA, respectively. (E) Validation of Trp and β-Ala in pSS patients and HCs. Serum concentrations of Trp and β-Ala were significantly higher in pSS patients than in HCs. (F) Validation of Trp and β-Ala in pSS patients and HCs after removing outliers. Serum concentrations of Trp and β-Ala were significantly higher in pSS patients than in HCs. (G) Validation of Trp and β-Ala in RA and HCs. Serum concentrations of Trp and β-Ala were significantly higher in RA patients than in HCs. (H) Validation of Trp and β-Ala in RA patients and HCs after removing outliers. Serum concentrations of Trp and β-Ala were significantly higher in RA patients than in HCs. Abbreviations: SLE, systemic lupus erythematosus; HCs, healthy controls; ROC, receiver operating characteristic; AUC, area under the curve; OPLS-DA, orthogonal partial least squares discriminant analysis; pSS, primary Sjogren’s syndrome; RA, rheumatoid arthritis; Trp, tryptophan; β-Ala, beta-alanine. |
In this OPLS-DA model, 94 metabolites had FDR values <0.05, and 46 metabolites had VIP values >1.0 (Supplementary Table 3). Two metabolites had VIP values >1.5, including Trp and β-Ala, with FDR values <0.05 (Figure 2A). Serum Trp and β-Ala concentrations were significantly lower in SLE patients than in HCs (Figure 3B). The AUC values of Trp and β-Ala were 0.744 and 0.714, respectively (Figure 3C). In addition, Trp exhibited a moderate correlation with SLEDAI-2K scores (r = 0.42, p = 0.013, Supplementary Figure 3).
Validation of Trp and β-Ala in the RA and pSS Cohorts
Although many significantly different metabolites were observed between the patients with SLE and the HCs, it is yet to be determined whether these differential metabolites are specific to SLE. As previous studies of SLE metabolomics have not confirmed the expression of differential metabolites in other rheumatic diseases,15–17 we further validated the distribution of Trp and β-Ala in the serum of RA patients, pSS patients and their corresponding HCs. The levels of both Trp and β-Ala were elevated in the serum of RA patients and pSS patients with or without removal of outliers (Figure 3D–H), which was quite different from the results of the SLE cohort (Figure 3B. Hence, the above results suggest that Trp and β-Ala are likely to be potential targets of SLE.
Biological Functions of Significantly Different Metabolites
We applied MetaboAnalyst to analyse the metabolic pathways of the identified differential metabolites. The results of the KEGG pathway enrichment analysis showed that significantly different metabolites in biological processes were mainly associated with the following aspects: “beta-alanine metabolism”, “histidine metabolism”, “pantothenate and CoA biosynthesis”, “thiamine metabolism”, “taurine and hypotaurine metabolism”, “phenylalanine metabolism”, “glutathione metabolism”, “aminoacyl-tRNA biosynthesis”, “neomycin, kanamycin and gentamicin biosynthesis”, and “cysteine and methionine metabolism” (Figure 4A). The top 10 pathways enriched in the SMPDB pathway were “beta-alanine metabolism”, “histidine metabolism”, “homocysteine degradation”, “ammonia recycling”, “spermidine and spermine biosynthesis”, “ethylhistidine metabolism”, “thyroid hormone synthesis”, “glutathione metabolism”, “lysine degradation”, “glycolysis”, and “methionine metabolism” (Figure 4B).
 |
Figure 4 Summary plot for KEGG and SMPDB. (A) Summary plot for KEGG. (B) Summary plot for SMPDB. Abbreviations: KEGG, Kyoto Encyclopedia of Genes and Genomes; SMPDB, small molecule pathway database. |
Beneficial Effects of Trp and β-Ala Supplementation on MRL-Faslpr Mice
Given that the serum levels of Trp and β-Ala were significantly decreased in SLE patients compared to HCs, we next evaluated the potential therapeutic effect of Trp or β-Ala supplementation on LN in MRL-Faslpr mice. The chemical structures of Trp and β-Ala are shown in Figure 5A. The Trp treatment group was given 12.5 mg/kg Trp intraperitoneally every 48 hours for four weeks (Figure 5B). Compared with the control group, the serum Trp level in the Trp group and the serum β-Ala level in the β-Ala group were both significantly increased (both P < 0.05; Supplementary Figure 4). Both Trp and β-Ala supplementation improved renal pathology. Hematoxylin and eosin (H&E) staining showed glomerular mesangial hyperplasia, renal tubular lumen dilatation and cell swelling and degeneration in the control group mice. Compared with those in the control group, the pathological changes in the glomeruli and renal tubules were significantly reduced in the Trp group (p < 0.01). The β-Ala group showed some improvement in renal histology, although the effect was not statistically significant (p = 0.14). However, both treatment groups still exhibited some degree of renal pathology (Figure 5C, D). The results of Masson staining showed that the glomerular saccules of the mice in the control group were significantly expanded, the basement membrane was significantly thickened, and large areas of blue collagen fibres were deposited in the tubulointerstitium and epithelium. Compared with the control group, the degree of renal interstitial fibrosis in the Trp group and β-Ala group was significantly reduced, especially in the Trp group (Figure 5C, D). The results of periodic acid-Schiff (PAS) staining showed that the glomerular basement membrane of the control group was significantly thickened, tubular atrophy, compensatory enlargement of the lumen, and widening of the interstitial area. Compared with the control group, the glomerular basement membrane of the Trp group and β-Ala group increased slightly, the interstitial area widened slightly, and the pathological changes were significantly reduced, especially in the Trp group (Figure 5C, D).
 |
Figure 5 Effects of Trp and β-Ala supplementation on MRL-Faslpr mice. (A) Chemical structure of Trp and β-Ala. (B) Experimental timeline showing the treatment regimen for MRL-Fas(lpr) mice. The treatment groups included the Trp group (12.5 mg/kg i.p. every 48 h), the β-Ala group (100 mg/kg in drinking water), and the control group (n=7 per group). (C) Representative photomicrograph of renal histology stained with hematoxylin and eosin (H&E), periodic acid-Schiff (PAS), and Masson. (D) Histological scores for renal histology, proteinuria, and anti-dsDNA antibody of MRL-Faslpr mice. (E and F) Flow cytometric analysis of peripheral blood T cells showing the frequencies of naïve T cells, Tcm cells, and Teff cells in the (E) CD4+ and (F) CD8+ populations (n=7 per group). (G and H) Flow cytometric analysis of splenic T cells showing the frequencies of naïve T cells, Tcm cells, and Teff cells in the (G) CD4+ and (H) CD8+ populations (n=7 per group). The data are presented as the means ± SDs; One-way ANOVA with Tukey’s post hoc test. Abbreviations: HE, hematoxylin and eosin; Ctrl, control; Trp, tryptophan; β-Ala, beta-alanine; Tcm, central memory T cells; Teff, effector T cells. |
Although the anti-dsDNA antibody did not differ between the three groups, the urine protein was reduced in Trp group mice compared to controls (Figure 5D). Flow cytometry results from peripheral blood cells showed that in CD4+ T cells, the Trp treatment group exhibited a trend toward increased naïve T cells and central memory T cells (Tcm) frequencies, along with decreased effector T cells (Teff) frequency compared to the control group, although these changes did not reach statistical significance (Figure 5E). In CD8+ T cells, only the Trp group presented significant changes, with increased central memory T cells (Tcm) and decreased frequency of effector T cells (Teff) compared with those of the control and β-Ala groups (p < 0.05, Figure 5F). In spleen cells, Trp treatment significantly increased Tcm and decreased Teff frequencies in CD4+ T cells (p < 0.05, Figure 5G), but also significantly increased naïve T cells and decreased Teff frequencies in CD8+ T cells (p < 0.05, Figure 5H). Although β-Ala treatment resulted in similar directional changes in both blood and spleen T-cell populations, these changes did not reach statistical significance compared with those of the controls.
Taken together, these experiments demonstrate that Trp and β-Ala supplementation may have beneficial effects in this lupus mouse model, with Trp showing more pronounced effects. However, further investigation is needed to fully evaluate their therapeutic potential.
Discussion
In this study, our results reveal many distinct metabolites between SLE patients and HCs. Previous metabolomics studies on SLE only identified differential metabolites between SLE and HCs.15–17 However, are these differential metabolites unique to SLE? To address this, we validated the differential metabolites in patients with RA and pSS, as well as the corresponding HCs. We showed that Trp and β-Ala levels in RA and pSS patients were not consistent with those in SLE patients, indicating that SLE patients have unique metabolic characteristics. Furthermore, we applied multiple machine learning methods to train metabolomics data of SLE patients and HCs for the first time. The results demonstrated that machine learning algorithms could accurately classify SLE patient and HC serum metabolic profiles. Our study also showed that machine learning algorithms presented excellent classification performance with or without removing outliers. After removing the outliers, the dataset was retrained using machine learning algorithms, and the results showed that the AUC values of almost all test sets were higher than before, as were the R2 values. To the best of our knowledge, there is no similar research applying a machine learning algorithm to train metabolomics data of SLE while taking into account the abnormal values in the samples. Therefore, we suggest that strict attention be paid to sample collection, excluding those samples that do not meet the inclusion criteria and using appropriate methods to identify outliers in the samples.18–20 However, this does not imply that all outliers should be removed. In some cases, outliers may have better research value, as has been the focus of some previous studies.21–23
The altered amino acid metabolism observed in SLE patients can be explained through several established molecular mechanisms. First, the inflammatory environment characteristic of SLE involves elevated levels of proinflammatory cytokines, which are known to upregulate IDO expression. This increased IDO activity leads to increased Trp catabolism through the kynurenine pathway.24,25 Second, SLE patients typically experience heightened oxidative stress, which can significantly impact amino acid transport systems.26 The compromised function of these transporters may contribute to the decreased Trp levels observed in our study. Third, immune cell activation in SLE triggers substantial metabolic reprogramming, leading to altered amino acid utilization patterns and changes in cellular energy metabolism.27,28 This metabolic shift affects not only immune cell function but also overall amino acid homeostasis, potentially explaining the broad changes in amino acid profiles we observed in SLE patients.
The OPLS-DA model, based on 78 samples, identified that β-Ala and Trp were the two metabolites that contributed the most to the model. Serum levels of Trp and β-Ala were significantly lower in patients with SLE compared to HCs. In contrast, Trp and β-Ala levels increased in the serum of patients with RA and pSS compared to HCs, suggesting that the decrease in Trp and β-Ala levels may be unique to SLE. β-Ala is a naturally occurring beta-amino acid formed in vivo from the degradation of dihydrouracil and myostatin.29 It is currently one of the most widely used exercise supplements worldwide, and its use as a nutritional strategy in other populations is increasing.30 β-Ala has not been explicitly studied in SLE serum metabolomics. A study on SLE urine metabolomics revealed a decrease in β-Ala concentrations in the urine of SLE patients compared to that of controls, and the decrease was more pronounced in patients with LN.17 β-Ala supplementation within the dose range used in the current study design does not adversely affect those who consume it.30,31 Next, we will discuss the findings related to Trp.
Trp is one of the essential amino acids for the human body. Early studies have shown enhanced degradation of Trp in SLE, no significant relationship between serum Trp and SLEDAI, and immune activation as a cause of Trp degradation in SLE patients.32 Trp was significantly enriched in the feces of SLE patients and positively correlated with SLEDAI-2K.16 Mood disorders in SLE caused by anti-ribosomal P protein antibodies were also associated with reduced serum and brain Trp, and supplementation with Trp restores serum Trp levels and prevents behavioral disturbances.33 Importantly, the relationship between Trp and SLE is complex and context-dependent. While our study revealed that Trp treatment significantly reduced serum anti-dsDNA antibody levels, decreased renal immune complex deposition, and ameliorated lupus-like symptoms in MRL-Faslpr mice, other studies reported that high dietary Trp could accelerate disease progression and T cell activation in lupus-prone mice. These apparent discrepancies might be explained by differences in the timing of the intervention, dosage, administration route, or specific disease stage. Additionally, Trp metabolism involves multiple pathways, including the kynurenine and serotonin pathways, which may have distinct or even opposing effects on immune responses. Understanding these complex interactions and identifying the optimal therapeutic window for Trp intervention will be crucial for its potential clinical application.
Most Trp (over 90%) is catabolized via the kynurenine pathway, which is mediated by indoleamine 2,3-dioxygenase (IDO), and the resulting Trp metabolites are involved in fundamental biological processes such as immunomodulation, energy metabolism, and the enzymatic cofactor for antibody production - nicotinamide adenine dinucleotide (NAD). Many studies have concluded that Trp metabolites such as kynurenine are critical regulators of immune cell behavior and that Trp acts primarily as a precursor to metabolites.34 However, recent studies have proposed a different view that the relative ratio of Trp to kynurenine will affect the amount of kynurenine entering T cells. Thus, Trp concentration could be considered a variable blocker that regulates the entry of kynurenine into T cells and leads to immunosuppression.35–37 In addition to T cells, the Trp molecular pathway also affects B cells. Scott and colleagues used 1-methyltryptophan (1-MT), an inhibitor of IDO, to treat an RA mouse model and found that 1-MT alleviated RA by reducing autoreactive B-cell responses, resulting in lower autoantibody titers and reduced inflammatory cytokine levels.38 Shinde and his colleagues demonstrated that IDO1 is a key feedback controller limiting B-cell proliferation and antibody responses after lipopolysaccharide stimulation while promoting apoptosis.39 The MRL-Faslpr mice supplemented with Trp and β-Ala showed lower disease activity in the Trp group than in the β-Ala and control groups. This result can be explained by the metabolomics results, which showed that although there were significant differences in both Trp and β-Ala levels in SLE and HC serum, the differences were more significant for Trp, with the mean Trp level for HC being approximately 11.8 times higher than the mean Trp level for SLE, while the mean β-Ala level for HC was 1.8 times higher than the mean β-Ala level for SLE.
The decision to remove outliers was based on careful statistical and biological considerations. The removed outliers (3 SLE patients and 3 HCs) did not show any consistent clinical characteristics that would suggest they represent a distinct patient subgroup. While removing outliers improved model performance, with the AUC values and R² values of almost all models’ test sets increasing, we acknowledge that this approach could potentially exclude biologically relevant variations. Therefore, we have presented results both with and without outliers to ensure transparency and comprehensive analysis. This dual approach allows readers to evaluate the robustness of our findings and highlights the importance of careful data preprocessing in metabolomics studies.
The mechanisms by which Trp ameliorates SLE symptoms appear to be multifaceted. Recent studies have demonstrated significant disruption of the Trp biosynthesis pathway in SLE patients, providing crucial insight into the metabolic basis of SLE pathogenesis.40,41 On the basis of these findings, we propose several mechanisms through which Trp supplementation may exert therapeutic effects. Trp metabolism through the kynurenine pathway generates immunoregulatory metabolites that can modulate T-cell responses. Our findings of increased naïve T cells and decreased effector T cells following Trp supplementation suggest that this pathway is important for immune regulation. Previous studies have shown that Trp metabolism affects B cell responses and autoantibody production.38,39,42 This finding aligns with our observation of reduced renal inflammation and proteinuria in treated mice, possibly through decreased autoantibody-mediated tissue damage. The enzyme indoleamine 2,3-dioxygenase (IDO) plays a crucial role in Trp metabolism and immune regulation.43,44 Altered IDO activity in SLE affects both T-cell responses and B-cell function, suggesting that Trp supplementation may help restore normal IDO-mediated immune regulation.45,46
Based on our findings and previous studies, we propose a comprehensive model of Trp metabolism in SLE pathogenesis (Supplementary Figure 5). In SLE patients, abnormal T cell function, excessive B cell activation, and enhanced inflammatory responses lead to decreased serum Trp levels. This reduction affects both the serotonin and kynurenine pathways. As illustrated in Supplementary Figure 5, Trp supplementation can help restore these pathways, promoting immune regulation and improving clinical outcomes through multiple mechanisms. The left panel shows the disrupted Trp metabolism in SLE, characterized by decreased levels of both serotonin and kynurenine pathway metabolites. The right panel demonstrates how Trp supplementation can restore these pathways, leading to improved immune regulation and clinical performance through neuro-endocrine-immune modulation and reduction of abnormal T cell function and excessive immune activation.
Several limitations of our study should be acknowledged. Our study design did not include non-SLE nephritis patients or SLE patients without nephritis as controls, making it difficult to determine whether the observed decreases in Trp and β-Ala are specific to SLE or represent a general feature of renal disease. The different administration routes used for Trp (intraperitoneal injection) and β-Ala (drinking water) may have introduced confounding factors in comparing their therapeutic effects. Additionally, our cohort size of 44 SLE patients, while standard for metabolomics studies, may limit result generalizability. We did not systematically document patient treatment regimens, which could affect amino acid metabolism interpretation. While our machine learning models showed promising results, they require external validation with independent datasets. Lastly, we did not monitor Trp conversion efficiency or analyze double-negative T cells in our animal studies, which could provide additional mechanistic insights.
Future studies should address these limitations through: (1) inclusion of appropriate disease control groups; (2) standardized drug administration protocols; (3) validation in larger, diverse patient cohorts; (4) systematic analysis of treatment effects; (5) external validation using multicenter data; and (6) comprehensive analysis of immune cell subsets and metabolic pathways. Further investigation of dose-response relationships, optimal treatment duration, and long-term safety will be crucial for evaluating the therapeutic potential of Trp supplementation.
In conclusion, our study revealed significantly decreased serum levels of Trp and β-Ala in SLE patients and demonstrated potential therapeutic benefits of Trp supplementation in a lupus mouse model. The successful application of machine learning algorithms to metabolomics data suggests their potential utility in SLE diagnosis and prognosis. These findings provide new insights into SLE pathogenesis and potential therapeutic strategies, though further validation and mechanistic studies are needed before clinical implementation. Our results lay the groundwork for future investigations into metabolite-based therapies and machine learning applications in SLE management.
Data Sharing Statement
The datasets analysed during the current study are available from the corresponding author upon request.
Patient Consent Statement
Informed consent for publication was obtained.
Funding
This work was supported by the National Key R&D Program of China (2020YFA0710804), Project and Key Program of National Natural Science Foundation of China (grant no. 82271843, 81930043), the Major International (Regional) Joint Research Project of China (grant no. 81720108020) and Key Project supported by Medical Science and Technology Development Foundation, Nanjing Department of Health (ZKX20019).
Disclosure
The authors declare no conflicts of interest.
References
1. Gergianaki I, Fanouriakis A, Repa A, et al. Epidemiology and burden of systemic lupus erythematosus in a Southern European population: data from the community-based lupus registry of Crete, Greece. Ann Rheum Dis. 2017;76(12):1992–2000.
2. Wang Y, Zhang Y, Lin Z, et al. Identification of 38 novel loci for systemic lupus erythematosus and genetic heterogeneity between ancestral groups. Nat Commun. 2021;12(1):772. doi:10.1038/s41467-021-21049-y
3. Jog N, Young K, Munroe M, et al. Association of Epstein-Barr virus serological reactivation with transitioning to systemic lupus erythematosus in at-risk individuals. Ann Rheum Dis. 2019;78(9):1235–1241. doi:10.1136/annrheumdis-2019-215361
4. Taraborelli M, Cavazzana I, Martinazzi N, et al. Organ damage accrual and distribution in systemic lupus erythematosus patients followed-up for more than 10 years. Lupus. 2017;26(11):1197–1204. doi:10.1177/0961203317693096
5. Anders H, Saxena R, Zhao M, Parodis I, Salmon J, Mohan C. Lupus nephritis. Nat Rev Dis Primers. 2020;6(1):7. doi:10.1038/s41572-019-0141-9
6. Lee E, Yeo M, You S, Kim Y, Ryu S, Lee J. An unusual pediatric case of seronegative systemic lupus erythematosus presented with acute abdominal pain and gross hematuria. Pediatr Emerg Care. 2021;37(1):e55–e57. doi:10.1097/PEC.0000000000001527
7. Anyfantakis D, Symvoulakis E, Barbounakis E, et al. A fatal case of seronegative, late-onset systemic lupus erythematosus presenting with motor sensory axonal polyneuropathy. Mod Rheumatol. 2014;24(5):858–861. doi:10.3109/14397595.2013.874743
8. Nagafuchi Y, Shoda H, Fujio K. Immune profiling and precision medicine in systemic lupus erythematosus. Cells. 2019;8(2):140. doi:10.3390/cells8020140
9. Fernández-Ochoa Á, Brunius C, Borrás-Linares I, et al. Metabolic disturbances in urinary and plasma samples from seven different systemic autoimmune diseases detected by HPLC-ESI-QTOF-MS. J Proteome Res. 2020;19(8):3220–3229. doi:10.1021/acs.jproteome.0c00179
10. Bellocchi C, Fernández-Ochoa Á, Montanelli G, et al. Identification of a shared microbiomic and metabolomic profile in systemic autoimmune diseases. J Clin Med. 2019;8(9):1291.
11. Zhang Q, Li X, Yin X, et al. Metabolomic profiling reveals serum L-pyroglutamic acid as a potential diagnostic biomarker for systemic lupus erythematosus. Rheumatology. 2021;60(2):598–606. doi:10.1093/rheumatology/keaa126
12. Thévenot EA, Roux A, Xu Y, Ezan E, Junot C. Analysis of the human adult urinary metabolome variations with age, body mass index, and gender by implementing a comprehensive workflow for univariate and OPLS statistical analyses. J Proteome Res. 2015;14(8):3322–3335.
13. Jewison T, Su Y, Disfany F, et al. SMPDB 2.0: big improvements to the small molecule pathway database. Nucleic Acids Res. 2014;42(Database issue):D478–484. doi:10.1093/nar/gkt1067
14. Pang Z, Chong J, Li S, Xia J. MetaboAnalystR 3.0: toward an optimized workflow for global metabolomics. Metabolites. 2020;10(5):186.
15. Zhang Q, Yin X, Wang H, et al. Fecal metabolomics and potential biomarkers for systemic lupus erythematosus. Front Immunol. 2019;10:976. doi:10.3389/fimmu.2019.00976
16. Yan R, Jiang H, Gu S, et al. Fecal metabolites were altered, identified as biomarkers and correlated with disease activity in patients with systemic lupus erythematosus in a GC-MS-based metabolomics study. Front Immunol. 2020;11:2138. doi:10.3389/fimmu.2020.02138
17. Kalantari S, Chashmniam S, Nafar M, Zakeri Z, Parvin M. Metabolomics approach reveals urine biomarkers and pathways associated with the pathogenesis of lupus nephritis. Iran J Basic Med Sci. 2019;22(11):1288–1295. doi:10.22038/ijbms.2019.38713.9178
18. Sondag P, Zeng L, Yu B, et al. Effect of a statistical outlier in potency bioassays. Pharm Stat. 2018;17(6):701–709. doi:10.1002/pst.1893
19. Sheng Y, Ge Y, Yuan L, Li T, Yin F, Wu Q. Outlier identification in radiation therapy knowledge-based planning: a study of pelvic cases. Med Phys. 2017;44(11):5617–5626. doi:10.1002/mp.12556
20. Chen X, Zhang B, Wang T, Bonni A, Zhao G. Robust principal component analysis for accurate outlier sample detection in RNA-Seq data. BMC Bioinf. 2020;21(1):269. doi:10.1186/s12859-020-03608-0
21. Cabrera Torres E, García Iglesias M, Santos Jiménez M, González Hierro M, Diego Domínguez M. Outlier patient admissions and their relationship with the emergence of clinical complications and prolonged hospital stays. Gac Sanit. 2019;33(1):32–37. doi:10.1016/j.gaceta.2017.07.012
22. Lawson E, Roberts P, Francone T, Marcello P, Read T, Ricciardi R. Should classification as an ACS-NSQIP high outlier be used to direct hospital quality improvement efforts? Am J Surg. 2018;216(2):213–216. doi:10.1016/j.amjsurg.2017.07.026
23. Zhao S, Evans J, Kothari V, et al. The landscape of prognostic outlier genes in high-risk prostate cancer. Clin Cancer Res. 2016;22(7):1777–1786. doi:10.1158/1078-0432.CCR-15-1250
24. McGaha TL, Huang L, Lemos H, et al. Amino acid catabolism: a pivotal regulator of innate and adaptive immunity. Immunol Rev. 2012;249(1):135–157. doi:10.1111/j.1600-065X.2012.01149.x
25. Wang Q, Liu D, Song P, Zou MH. Tryptophan-kynurenine pathway is dysregulated in inflammation, and immune activation. Front Biosci. 2015;20(7):1116–1143. doi:10.2741/4363
26. Yang J, Yang X, Zou H, Li M. Oxidative stress and Treg and Th17 dysfunction in systemic lupus erythematosus. Oxid Med Cell Longev. 2016;2016:2526174. doi:10.1155/2016/2526174
27. Yin Y, Choi SC, Xu Z, et al. Normalization of CD4+ T cell metabolism reverses lupus. Sci Transl Med. 2015;7(274):274ra218. doi:10.1126/scitranslmed.aaa0835
28. Morel L. Immunometabolism in systemic lupus erythematosus. Nat Rev Rheumatol. 2017;13(5):280–290. doi:10.1038/nrrheum.2017.43
29. Everts B, Amiel E, Huang S-C-C, et al. TLR-driven early glycolytic reprogramming via the kinases TBK1-IKKɛ supports the anabolic demands of dendritic cell activation. Nat Immunol. 2014;15(4):323–332. doi:10.1038/ni.2833
30. Dolan E, Swinton P, Painelli V, et al. A systematic risk assessment and meta-analysis on the use of oral β-alanine supplementation. Adv Nutr. 2019;10(3):452–463. doi:10.1093/advances/nmy115
31. Saunders B, Franchi M, de Oliveira L, et al. 24-Week β-alanine ingestion does not affect muscle taurine or clinical blood parameters in healthy males. Eur J Nutr. 2020;59(1):57–65. doi:10.1007/s00394-018-1881-0
32. Widner B, Sepp N, Kowald E, et al. Enhanced tryptophan degradation in systemic lupus erythematosus. Immunobiology. 2000;201(5):621–630. doi:10.1016/S0171-2985(00)80079-0
33. Cho T, Sato H, Wakamatsu A, et al. Mood disorder in systemic lupus erythematosus induced by antiribosomal P protein antibodies associated with decreased serum and brain tryptophan. J Immunol. 2021;206(8):1729–1739. doi:10.4049/jimmunol.2000260
34. Badawy A, Namboodiri A, Moffett J. The end of the road for the tryptophan depletion concept in pregnancy and infection. Clin Sci. 2016;130(15):1327–1333.
35. Schramme F, Crosignani S, Frederix K, et al. Inhibition of tryptophan-dioxygenase activity increases the antitumor efficacy of immune checkpoint inhibitors. Cancer Immunol Res. 2020;8(1):32–45. doi:10.1158/2326-6066.CIR-19-0041
36. Kim M, Tomek P. Tryptophan: a rheostat of cancer immune escape mediated by immunosuppressive enzymes IDO1 and TDO. Front Immunol. 2021;12:636081. doi:10.3389/fimmu.2021.636081
37. Höglund E, Overli O, Winberg S. Tryptophan metabolic pathways and brain serotonergic activity: a comparative review. Front Endocrinol. 2019;10:158. doi:10.3389/fendo.2019.00158
38. Scott G, DuHadaway J, Pigott E, et al. The immunoregulatory enzyme IDO paradoxically drives B cell-mediated autoimmunity. J Immunol. 2009;182(12):7509–7517. doi:10.4049/jimmunol.0804328
39. Shinde R, Shimoda M, Chaudhary K, et al. B cell-intrinsic IDO1 regulates humoral immunity to T cell-independent antigens. J Immunol. 2015;195(5):2374–2382. doi:10.4049/jimmunol.1402854
40. Rojo-Sánchez A, Carmona-Martes A, Díaz-Olmos Y, et al. Urinary metabolomic profiling of a cohort of Colombian patients with systemic lupus erythematosus. Sci Rep. 2024;14(1):9555. doi:10.1038/s41598-024-60217-0
41. Eryavuz Onmaz D, Tezcan D, Yilmaz S, Onmaz M, Unlu A. Altered kynurenine pathway metabolism and association with disease activity in patients with systemic lupus. Amino Acids. 2023;55(12):1937–1947. doi:10.1007/s00726-023-03353-7
42. Merlo L, DuHadaway J, Montgomery J, et al. Differential roles of IDO1 and IDO2 in T and B cell inflammatory immune responses. Front Immunol. 2020;11:1861. doi:10.3389/fimmu.2020.01861
43. Mellor AL, Munn DH. IDO expression by dendritic cells: tolerance and tryptophan catabolism. Nat Rev Immunol. 2004;4(10):762–774. doi:10.1038/nri1457
44. Badawy AA. Tryptophan metabolism, disposition and utilization in pregnancy. Biosci Rep. 2015;35(5). doi:10.1042/BSR20150197
45. Perl A. Review: metabolic control of immune system activation in rheumatic diseases. Arthritis Rheumatol. 2017;69(12):2259–2270. doi:10.1002/art.40223
46. Filippini P, Del Papa N, Sambataro D, Del Bufalo A, Locatelli F, Rutella S. Emerging concepts on inhibitors of indoleamine 2,3-dioxygenase in rheumatic diseases. Curr Med Chem. 2012;19(31):5381–5393. doi:10.2174/092986712803833353
 © 2025 The Author(s). This work is published and licensed by Dove Medical Press Limited. The
full terms of this license are available at https://www.dovepress.com/terms.php
and incorporate the Creative Commons Attribution
- Non Commercial (unported, 4.0) License.
By accessing the work you hereby accept the Terms. Non-commercial uses of the work are permitted
without any further permission from Dove Medical Press Limited, provided the work is properly
attributed. For permission for commercial use of this work, please see paragraphs 4.2 and 5 of our Terms.
© 2025 The Author(s). This work is published and licensed by Dove Medical Press Limited. The
full terms of this license are available at https://www.dovepress.com/terms.php
and incorporate the Creative Commons Attribution
- Non Commercial (unported, 4.0) License.
By accessing the work you hereby accept the Terms. Non-commercial uses of the work are permitted
without any further permission from Dove Medical Press Limited, provided the work is properly
attributed. For permission for commercial use of this work, please see paragraphs 4.2 and 5 of our Terms.