")
Back to Journals » Journal of Inflammation Research » Volume 18
Network Analysis of Multidimensional Symptoms and Inflammatory Biomarkers in Chinese Patients with Glioma
Authors Li H , Tong Y , Li J, Shi X, Nyalali AMK , Li F
Received 30 January 2025
Accepted for publication 16 May 2025
Published 31 May 2025 Volume 2025:18 Pages 7083—7095
DOI https://doi.org/10.2147/JIR.S517105
Checked for plagiarism Yes
Review by Single anonymous peer review
Peer reviewer comments 2
Editor who approved publication: Professor Ning Quan
Huayu Li,1 Yuanhao Tong,2 Jing Li,3 Xiaohan Shi,4 Alphonce MK Nyalali,3,5 Feng Li3
1Department of Social Medicine of School of Public Health and Department of Pharmacy of The First Affiliated Hospital, Zhejiang University School of Medicine, Hangzhou, 310058, People’s Republic of China; 2Department of Orthopedics, National Center for Orthopedics, Shanghai Sixth People’s Hospital Affiliated to Shanghai JiaoTong University School of Medicine, Shanghai, 200030, People’s Republic of China; 3Department of Neurosurgery, Shandong Cancer Hospital and Institute, Shandong First Medical University and Shandong Academy of Medical Sciences, Jinan, 250117, People’s Republic of China; 4School of Nursing and Rehabilitation, Shandong University, Jinan, 250014, People’s Republic of China; 5Department of Orthopedics and Neurosurgery, Mbeya Zonal Referral Hospital and Mbeya College of Health and Allied Sciences, University of Dar Es Salaam, Mbeya, Tanzania
Correspondence: Feng Li, Department of Neurosurgery, Shandong Cancer Hospital and Institute, Shandong First Medical University and Shandong Academy of Medical Sciences, Jinan, People’s Republic of China, Email [email protected]
Background: Patients with glioma experience multidimensional symptoms that reduce their functional status, quality of life, and survival, and these symptoms may be associated with inflammation. This study applied network analysis to examine and visualize the relationship between multidimensional symptom experiences and inflammatory biomarkers and assess the symptom networks of multidimensional symptom experiences over time in patients with glioma.
Methods: Participants diagnosed with glioma were recruited and completed the MD Anderson Symptom Inventory-Brain Tumor Module (MDASI-BT) at three different time points: 2 days after admission (T1), 7 days after surgery (T2), and 1 month after surgery (T3). On the same day as the T1 questionnaire collection, plasma levels of interleukin-1β (IL-1β), IL-6, IL-10, tumor necrosis factor-α (TNF-α), and c-reactive protein (CRP) were measured. Network analysis was employed to explore the relationships among multidimensional symptom experiences and inflammatory biomarkers of patients.
Results: Of the total 334 participants (mean age 54.38 ± 13.16 years), 67.1% had high-grade tumors. In the symptom-cytokine network model, there were positive correlations between “sad and IL-6”, “fatigue and IL-10”, and “sleepy and IL-1β”. Within the symptom network models, “difficulty remembering”, “sad”, and “change in bowel pattern” emerged as the most central symptoms across the three assessments, respectively.
Conclusion: Network analysis provides a novel method for investigating the relationships between multidimensional symptom experiences and inflammatory biomarkers. Additionally, it allows for identifying different core symptoms at various stages of treatment. Clinicians should effectively address and manage symptoms by focusing on special core symptoms and their interconnections within the network.
Keywords: glioma, symptom, inflammatory biomarkers, network analysis
Introduction
Gliomas, which derive from neuroglial stem or progenitor cells, represent the most prevalent malignant cranial tumor.1 During treatment, patients with glioma encounter a variety of symptoms, including physical symptoms (seizures, movement disorders), cognitive symptoms (decreased attention, cognitive impairment), and psychological symptoms (anxiety, sadness), many of which co-occur and are reinforced synergistically.2 Dodd et al defined these co-existing and interrelated multidimensional symptoms as a “symptom cluster” characterized by the coexistence of at least two symptoms that may share a common etiology and mechanism and lead to a clinical outcome distinct from the individual symptoms.3 Specially, treatment-related symptoms cluster involving distress, pain, shortness of breath, sadness, and fatigue in patients with glioma, not only reduce treatment adherence due to overwhelming symptom complexity, thereby indirectly reducing quality of life, but may also directly accelerate tumor progression by disrupting the neuroendocrine-immune axis.4 Compared to single symptoms, uncontrolled symptom clusters are associated with reduced patient compliance and treatment effectiveness, as well as neuroendocrine dysfunction, and shortened survival.5 Although improving survival is the primary goal of treatment for patients with glioma, most patients are still incurable, making it essential to understand the underlying mechanisms driving these symptom clusters and develop targeted interventions throughout the disease trajectory.
The biological mechanisms underlying the development of symptom clusters in glioma patients have yet to be uniformly established. According to research on neuro-immune signaling, certain changes in disease behaviors brought on by immune system activation are mediated by inflammatory cytokines. Tumors and treatments have been reported to trigger acute and persistent inflammatory and immune responses,6,7 pro-inflammatory mediators including interleukin-6 (IL-6), interleukin-1β (IL-1β) and tumor necrosis factor-α (TNF-α) can permeate the blood–brain barrier (BBB) through volume diffusion and active transport mechanisms,8 affecting hypothalamic-pituitary-adrenal (HPA) axis function.9 The central nervous system (CNS) receives signals from the peripheral immune system that have been triggered by inflammatory cytokines through a variety of pathways, altering neuronal activity, physiological processes, and behavior.10 Critically, such neuroimmune interactions not only drive psychological and behavioral symptoms but also accelerate tumor progression by fostering an immunosuppressive tumor microenvironment,11 ultimately contributing to reduced overall survival.12 Notably, IL-6 demonstrates dual oncological and neuropsychiatric relevance – while promoting tumor angiogenesis and immunosuppressive microenvironment formation,13 it concurrently modulates neurotransmitter metabolism through kynurenine pathway activation,14 potentially explaining its established correlation with psychoneurological symptoms in our prior glioma research.15 Conversely, the anti-inflammatory cytokine interleukin-10 (IL-10) may counterbalance neuroinflammation through STAT3 signaling attenuation.16 Understanding the mechanistic link between inflammation and symptoms could pave the way for novel therapeutic strategies. For instance, anti-inflammatory treatments, such as cytokine inhibitors or immunomodulatory drugs, could potentially improve symptom control and enhance the quality of life for patients glioma. However, current research limitations include heterogeneous symptom inclusion criteria and analytical approaches, contributing to inconsistent inflammation-symptom associations.17,18
As a relatively novel method, network analysis defines each variable as a “node”, the relationship between two nodes as an “edge”, and the thickness of the edge indicates the degree of association.19 It provides a unique opportunity to assess and visualize symptom clusters as dynamic systems of interacting symptoms, enabling us to study the full complexity of symptoms and may guide future research into the biophysiological mechanisms of complex, underlying symptom clusters, leading to the development of more precise and individualized interventions.20–22 However, few studies have been conducted exploring symptom networks of multidimensional symptom experience in patients with glioma.
Therefore, the objectives of this study were to 1) test whether specific symptoms were associated with specific inflammatory biomarkers after controlling for all other symptoms, inflammatory biomarkers, and covariates, and 2) examine and visualize the relationship between individual symptoms over time within a multidimensional symptom experience network in patients with glioma.
Materials and Methods
Study Participants
From December 2020 to December 2022, patients with glioma hospitalized in neurosurgery departments of two tertiary hospitals in Shandong Province were selected by convenience sampling method as study subjects. Inclusion criteria were as follows: pathologically diagnosed as gliomas; age ≥ 18 years; clear awareness, understanding of their condition, and no language communication impairment; voluntary participation in this study. Exclusion criteria were as follows: a combination of severe other systemic disorders or history of diverse diseases affecting immune function; a recent history of antipsychotic and immune-impairing drugs; psychiatric illness or cognitive impairment; a history of infection or fever during the previous two weeks; patients were unable to participate in the study due to illness.
Study Design and Procedures
We conducted a longitudinal study, and the investigation was performed as a combination of questionnaires and laboratory testing. Patients’ electronic medical records were used to determine eligibility. On the first day of admission, eligible and consented patients were enrolled, and demographic and clinical characteristics were collected. Whole blood specimens were drawn 2 days after admission (T1). All additional data, including patient-reported questionnaires, were collected 2 days after admission (T1), 7 days after surgery (T2), and 1 month after surgery (T3). Age and body mass index (BMI) were included as covariates in our study since they are associated with inflammatory biomarker levels.23,24
Study Assessments
Demographic and Clinical Information
A self-administered general information questionnaire was used to collect socio-demographic and clinical data. Sociodemographic variables included age, gender, BMI, marital status, occupation, and educational attainment. Clinical data included Karnofsky performance status (KPS) score, comorbidities, WHO tumor grade, tumor location, laterality, IDH mutation status.
Multidimensional Symptoms
The MD Anderson Symptom Inventory (MDASI) is a brief, reliable, and validated measurement developed by the Pain Research Group at the University of Texas MD Anderson Cancer Center for cancer patients to describe common symptoms and assess the extent to which symptoms interfere with daily life.25 Armstrong et al compiled the MDASI-Brain Tumor Module (MDASI-BT) to assess the symptoms of brain tumor patients based on the MDASI.26 The MDASI-BT consists of 22 symptoms rated on an 11-point scale (0–10) to indicate the existence and intensity of each symptom in the last 24 hours, with 0 being “not present” and 10 being “as bad as you can imagine”. The higher the score, the more severe the symptom. Patients also rated the interference of symptoms with their daily life on the same scale of 0 to 10, including interference with walking, work, general activity, mood, relationships with others, and enjoyment of life. The scale demonstrated high internal consistency in our research (Cronbach ‘s α = 0.923).
Laboratory Measures
On the morning before the questionnaire evaluation at T1, whole blood samples were obtained from venipuncture into frozen ethylenediaminetetraacetic acid (EDTA) tubes for plasma isolation. Plasma was separated by centrifugation at 3000 g for 10 min at 4°C, then aliquoted into siliconized polypropylene tubes and stored at −80°C until batched assay. Seven inflammatory biomarkers associated with symptoms in previous studies, including IL-1β, IL-6, IL-10, TNF-α, and c-reactive protein (CRP), were tested using a human high-sensitivity cytokine base kit. Multiplex enzyme-linked immunosorbent assay (ELISA) was used to determine the concentration of each inflammatory cytokine. All specimens were evaluated in duplicate, and the mean level was used for the results. Inter- and intra-coefficients of variation were reliably <10%.
Statistical Analysis
All statistical analyses were performed using R 4.2.2. Descriptive statistics were analyzed and used to assess demographic and clinical data. Categorical variables were expressed as frequencies (N) and percentages (%). Continuous variables were expressed as means  and standard deviations (SD). One-way repeated measures ANOVA was performed to determine whether there was a significant difference in symptom severity over time. To explore the effects of baseline inflammatory biomarkers on the longitudinal change in overall symptom burden, linear mixed effect models (LMM) were employed. In the models, time, age, gender, marital status, occupation, education, KPS score, comorbidities, WHO tumor grade, and tumor location were included as fixed effects, with subjects as random effects. Due to missing values in IDH mutation status, multiple imputation was used to fill in the missing data, and sensitivity analyses were conducted to ensure that the imputed IDH distribution did not introduce systematic bias. A statistically significant difference was indicated by P-value < 0.05.
Gaussian graphical model (GGM) was used to construct networks. We used the qgraph package to visualize the network, and the spring layout was applied to generate an undirected correlation network within the highly linked nodes clustered together in the center of the network. To avoid false-positive results, we employed the least absolute shrinkage and selection operator (LASSO), which shrinks all edge-weights to zero and sets the minor weights to exactly zero, resulting in a sparse network structure. The strength of the penalty is controlled by a parameter λ, which we selected by applying the extended Bayesian information criterion (EBIC). To gain insight into the structural importance of the nodes in the network, we calculated three centrality indices: strength (ie, the sum of all edges of a given node to all other nodes), closeness (ie, the average distance from one node to all other nodes) and betweenness (ie, the number of times a node being the shortest path among nodes).27 The core node presents several connections in the network, and altering or deleting this node will likely result in large changes in the entire network. Notably, recent studies have indicated that closeness and betweenness tend to be unstable.28 Therefore, our study focuses on the node strength and its accuracy and stability.
According to current best practices, bootstrapping techniques were performed to assess the accuracy and stability of the network by using the R package bootnet.27 First, we applied a case-dropping subset bootstrap (2000 replicates, 8 cores) to compute the correlation stability (CS) coefficient to determine the robustness of centrality indices.29 A CS coefficient (correlation = 0.7) represents the maximum percentage of sample cases that can be dropped from the original full cases to retain a correlation of 0.7 in at least 95% of the samples. The CS coefficient needs to be higher than 0.25 (acceptable level) and ideally greater than 0.5 (preferable level).30 Second, to evaluate the accuracy of the edge weights in the network, we performed nonparametric bootstrapping to estimate the 95% confidence intervals (CIs) of the edge values, and narrower CIs indicate a more trustworthy network.31 Finally, bootstrapped difference tests were applied to examine differences between the edge weights.
The network comparison test (NCT) was used to assess networks over time. In addition, we performed a difference test to identify whether the estimations of network connections and centrality for various variables differ.19 The NCT tested invariant network structure, invariant global strength, and invariant edge strength between two networks.
Results
Sample Characteristics
A total of 392 individuals were contacted and 334 participated in the study beginning at baseline (T1) and continuing through two follow-up (T2 and T3) assessments (overall participation rate 85.2%). As listed in Table 1, the patients were middle-aged (54.38 ± 13.16 years). The average BMI was 24.65 kg/m2. 48.8% of the participants were males, 96.1% were married (defined as married or living as married), 83.2% had no smoking history, and 85.9% had no alcohol history. High-grade tumors were present in most individuals (67.1%). The details are shown in Table 1.
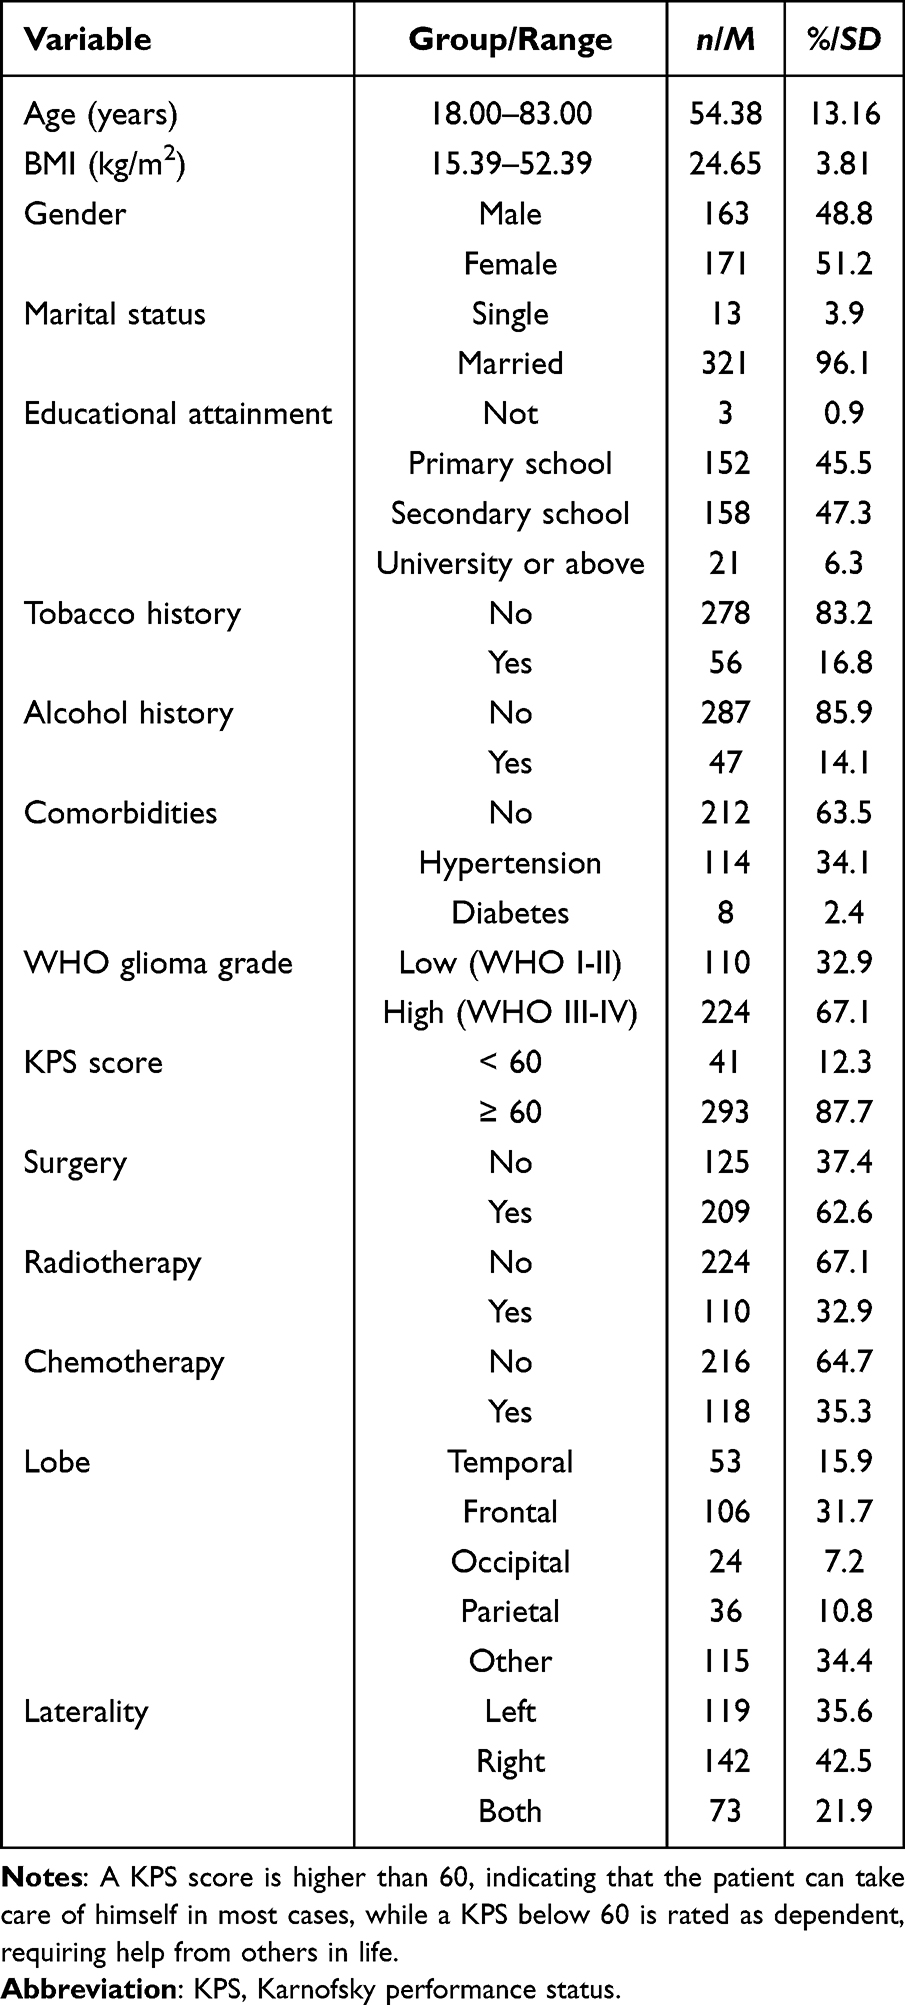 |
Table 1 Characteristics of Patients with Glioma (n = 334) |
Characterizing Symptoms Across the Three Assessments
Supplementary Tables 1 and 2 show the incidence and severity of symptoms in patients with glioma across the three assessments. “Fatigue” was the most prominent symptom, both in prevalence and severity, with severity scores increasing from baseline (T1) and peaking at T2 (T1 vs T2, P < 0.001; T2 vs T3, P = 0.544). “Sad” demonstrated a tendency of increased severity over time (T1 vs T2, P = 0.988; T2 vs T3, P < 0.001).
Associations of Baseline Inflammatory Biomarkers on the Symptoms Changes in Linear Mixed Models
Table 2 shows the relationship between inflammatory biomarkers and symptoms trajectory after adjusting for baseline demographic and clinical characteristics. Specially, elevated baseline IL-1β (β = 13.127, P < 0.001), IL-6 (β = 11.304, P < 0.001), and TNF-α (β = 4.066, P = 0.006) were associated with aggravated symptoms, whereas higher IL-10 (β = −3.057, P = 0.009) and CRP (β = −8.422, P < 0.001) levels correlated with symptom alleviation. Moreover, the interactions between baseline inflammatory biomarkers and time significantly influenced symptom changes. Patients with higher baseline IL-1β levels showed a significant increase in symptom scores over time (β = 10.631, P < 0.001), whereas those with higher baseline IL-6 levels exhibited a significant decline (β = −7.725, P < 0.001). To assess the impact of missing IDH mutation data on the model results, we used multiple imputation to fill in the missing values and conducted a sensitivity analysis. The results showed that the overall model fit did not change significantly after including the multiple imputed IDH mutation status.
 |
Table 2 Associations Between Baseline Inflammatory Biomarkers on The Changes of Symptoms in Linear Mixed Models |
Centrality, Accuracy, and Stability of Symptom-Cytokine Network
The symptom-cytokine network in patients with glioma was constructed as shown in Figure 1, with blue edges indicating positive correlations and red edges representing negative correlations, and the thicker the edge, the stronger the correlation. Among these relationships, sadness was positively related to IL-6 (edge weight = 0.19), fatigue was positively associated with IL-10 (edge weight = 0.07), and sleep was positively correlated to IL-1β (edge weight = 0.06). According to the specific values for strength (Figure 1 and Supplementary Figure 1), IL-6 had higher centrality than other inflammatory cytokines (strength value = 0.85), indicating it may play a central role in the symptom-cytokine network. The bootstrapped difference test for edge weights revealed that the relationship between IL-6 and sadness was significantly stronger than approximately 95% of other connections in the network (Supplementary Figure 2). The bootstrapped CIs were small, which indicated good accuracy of the network (Supplementary Figure 3). In the bootstrap subset, the CS coefficient for strength was 0.581, which exceeds the recommended value of 0.5 suggested by previous research,30 suggesting that the network remained stable (Supplementary Figure 4).
 |
Figure 1 Estimated symptom-cytokine network structure and centrality indexes. (A) The network structure. (B) Centrality indices of all nodes. Notes: Symptom-cytokine network displaying the relationship between symptoms and inflammatory markers after controlling for covariates. Blue edges constitute positive partial correlations between variables, red edges constitute negative partial correlations. The edge thickness represents the strength of the association between symptom nodes. |
Centrality and Predictability of Symptom Networks at Different Stages
Figures 2–4 illustrated the symptom network of the multidimensional symptom experiences in patients with glioma across the three assessments. The specific values of the edge weights between the nodes of the network are shown in Supplementary Tables 3–5 The network diagrams revealed dynamic patterns of symptom dominance. At the initial assessment (T1), cognitive and neurological symptoms were found to play a central role, particularly “difficulty remembering” (strength = 1.20), “vision” (strength = 1.20), “vomiting” (strength = 1.10), and “numbness” (strength = 1.10), which exhibited the highest centrality. By the second assessment (T2), psychological symptoms became more prominent, with “sad” (strength = 1.60), “distress” (strength = 1.40), “change in bowel pattern” (strength = 1.30), and “sleepy” (strength = 1.20) identified as the core symptoms in the network. In the third assessment (T3), physical functioning symptoms emerged as the most influential, characterized by high strength values, including “change in bowel pattern” (strength = 1.30), “change in appearance” (strength = 1.30), “vomiting” (strength = 1.20), and “weakness” (strength = 1.20) (Supplementary Figures 5–8).
 |
Figure 2 Estimated symptoms network structures in the full sample at T1. Notes: Symptom network displaying the relationship between special symptoms after controlling for other symptoms. Blue edges constitute positive partial correlations between variables, red edges constitute negative partial correlations. The edge thickness represents the strength of the association between symptom nodes. |
 |
Figure 3 Estimated symptoms network structures in the full sample at T2. Notes: Symptom network displaying the relationship between special symptoms after controlling for other symptoms. Blue edges constitute positive partial correlations between variables, red edges constitute negative partial correlations. The edge thickness represents the strength of the association between symptom nodes. |
 |
Figure 4 Estimated symptoms network structures in the full sample at T3. Notes: Symptom network displaying the relationship between special symptoms after controlling for other symptoms. Blue edges constitute positive partial correlations between variables, red edges constitute negative partial correlations. The edge thickness represents the strength of the association between symptom nodes. |
Difference Test, Accuracy, and Stability of Symptom Networks at Different Stages
Supplementary Figures 9–11 illustrated the results of the bootstrapped edge difference test. During T1, T2, and T3, the strongest edge weights were “shortness of breath and numbness”, “sleepy and distress”, and “nausea and lack of appetite”, respectively. The bootstrapped difference test for edge weights exhibited that the three edges were significantly stronger than approximately 95% of the other edge weights in the network. Supplementary Figures 12–14 showed the bootstrap analysis results of the edge weights. The edge weights in the current sample were all consistent with the bootstrapped sample, which suggests good accuracy of the networks across the three assessments. The strength indices in this sample were relatively high (ie, CS = 0.594, 0.594, and 0.749), meeting the required cutoff point suggested by researchers,30 which suggested that the network centrality measure was stable in this study (Supplementary Figures 15–17).
Symptom Network Comparison
The global strength of the symptom networks differed significantly when compared at the three time points, with values of 9.885 for T1, 8.720 for T2, and 9.743 for T3 (T1 vs T2, P = 0.040; T2 vs T3, P < 0.001), indicating that the intensity of interactions among symptoms varies notably over time. In addition, we compared the symptom networks between subgroup patients who had low-grade tumors (n = 110) vs high-grade tumors (n = 224), received surgery (n = 209) vs no surgery (n = 125), received radiotherapy (n = 110) vs no radiotherapy (n = 224), had chemotherapy (n = 118) vs no chemotherapy (n = 216), and no significant differences were discovered for network global strength (all P > 0.05). It is important to highlight that only covariates with sample sizes exceeding 100 were considered in the following analysis to guarantee adequate statistical power.
Discussion
This study is the first to examine the network model of the links between multidimensional symptom experiences with inflammatory cytokines and evaluate for symptoms within networks over time in Chinese patients with glioma.
Fatigue was the most severe and most prevalent symptom at all stages. In our study, 85.3% to 95.8% of patients reported fatigue at three-time points. Fatigue is the most common symptom among all cancer types, and the prevalence of cancer-related fatigue varied from 14.03% to 100%,32 and it accounts for the decline in the quality of life of patients.33 Our research demonstrated that fatigue severity scores increased from baseline and peaked at T2, which is consistent with the investigations of Andrykowski et al,34,35 who found that fatigue increased after treatment commencement and decreased several months after treatment completion. However, our study discovered that the strength of fatigue was moderately small compared to the strength of other symptoms, especially at T2 and T3, indicating that fatigue may not be the central symptom in glioma survivors despite its high prevalence and severity. Based on the prevalence and severity of symptoms, it is difficult to comprehend the mechanisms underlying symptom deterioration and alleviation. Zhu et al36 generated a symptom network of multidimensional symptom experiences in cancer survivors and found that the centrality of fatigue was even lower in a population with over 5 years of survivorship. We speculate that the core position of fatigue in the symptom network may depend on the use of chemoradiotherapy and the survival length of patients.37 From a clinical perspective, our findings highlight the importance of targeting symptom clusters rather than isolated symptoms for more effective management. For example, interventions addressing both fatigue and its co-occurring symptoms (eg, sleep disturbances or cognitive impairment) may yield better outcomes than focusing solely on fatigue.
Comparing previous research based on sum scores and diagnoses, we explored the relationship between individual multidimensional symptoms, inflammatory biomarkers, and demographic-related covariates in the network model. When corrected for age and BMI, the link between “IL-1β and sleepy” and “IL-6 and sad” remained strong. The activation of innate immune responses by tumors and related treatments can lead to a vicious cycle of inflammation and mitochondrial dysfunction and contribute to immunometabolism restriction of neuronal energy metabolism, amplifying the inflammatory process and increasing the release of inflammatory cytokines like IL-1β and IL-6.38 IL-1β can signal to the CNS via passive diffusion from periventricular organs, binding to endothelial cell receptors at the BBB, and entering the brain, where it can affect sleep through a variety of pathways. For example, IL-1β can stimulate the HPA axis and alter sleep-wake behavior in animals and humans.39 IL-6 serves as the core cytokine among the inflammatory cytokines included, which can send signals to the brain through periventricular areas, volume diffusion in afferent nerves, and active transport through the BBB. Once immune signals reach the brain, IL-6 can affect emotional function, increase the activity of depression-related areas, and reduce its connection to the amygdala and medial prefrontal cortex, triggering mood changes.40 Elevated baseline IL-6 levels were associated with both aggravated symptoms and a temporal decline in symptom burden. This dual role may reflect its pleiotropic functions, early IL-6 surge could amplify neuroinflammation through HPA axis dysregulation and limbic system modulation, while subsequent anti-inflammatory cytokine IL-10 mediated negative feedback might attenuate its pro-inflammatory effects. Clinically, serial IL-6 monitoring could serve as a valuable tool for stratifying patients at risk for persistent symptom distress and identifying those most likely to benefit from targeted interventions. Given the central role of IL-6 within symptom-inflammation network, suppressing the secretion of IL-6 represent promising therapeutic strategies, potentially disrupting this pathway for dual benefit: symptom control and inhibition of tumor progression.41
Previous studies have shown that targeting core symptoms may be a more effective approach for symptom interventions, as it can affect multiple co-occurring symptoms.42 Of the 22 symptoms assessed, “difficulty remembering”, “vision”, “vomiting” and “numbness” exhibited the highest strength at T1, suggesting that neurological symptoms may be the target of interventions at initial admission. Tumors in different locations of the brain can cause various neurological dysfunctions. For example, tumors located in the frontal lobe lead to language impairment, while tumors located in the prefrontal, temporal, or corpus callosum typically contribute to cognitive dysfunction.43 Therefore, clinicians should actively treat the clinical symptoms caused by the primary disease at the initial stage of admission, such as by performing early surgery, and using the appropriate steroids to reduce edema.44 “Sad”, “distress”, and “sleepy” had the highest strength at T2, suggesting that psychological changes in the early postoperative period are important features. After glioma surgery, clinical symptoms mostly diminish, but it seems that additional questions follow, such as those about the side effects and effectiveness of the surgery and the scheduling of re-treatment, and how to deal with personal, family, and work issues while the patient is hospitalized, which indicates early detection and psychological adjustment to alleviate emotional distress should be a crucial component of long-term management for patients with glioma. Physical functioning symptoms, like “change in bowel pattern”, and “change in appearance” may require a comprehensive evaluation and tailored interventions at T3. Although concurrent chemoradiotherapy kills tumor cells effectively, it will trigger adverse effects such as edema, nausea, vomiting, weakness, hair loss, etc.45,46 Clinical staff should pay attention to observing the negative effects of chemoradiotherapy on patients and give targeted treatment timely, such as dehydration drugs and brain cell function protection medications for edema if necessary. In summary, our findings highlight the clinical importance of adopting symptom cluster management strategies that align with disease trajectory. The temporal evolution of central symptoms, from neurological manifestations at T1, psychological distress at T2, to physical dysfunction at T3, suggests that stage-specific multimodal interventions may optimize therapeutic efficacy.
Our results suggest that patients with glioma tend to have a stronger symptom network at the beginning of admission. This finding can be partly attributed to the fact that patients who experience frequent stressful events (cancer treatment and upcoming treatments) have an increased non-homeostatic load, which leads to increased symptom interactions within the network.47 Unlike previous studies,48 we did not find that subgroups of different demographic and clinical characteristics were associated with stronger symptom networks, which may be a statistical error due to our moderate sample size and short follow-up period. Previous studies have noted that network strength can be considered a more sensitive indicator than severity to distinguish populations with different disease courses.49 Therefore, we believe that longer follow-up is necessary to assess the trajectory of long-term changes in network strength in glioma survivors.
Although our research is the first to explore the associations among multidimensional symptom experiences within networks over time and evaluate for associated inflammatory cytokines, several limitations should be taken into account in future studies. First, this study was conducted in two tertiary hospitals in Shandong Province, where patients with glioma with severe disease and complex symptoms were admitted, which may lead to a higher frequency and severity of the observed symptoms. Second, our study included patients who required subsequent surgery due to a postoperative recurrence, and the severity of symptoms reported by such patients may differ from that of the first surgery. Future investigations are needed to further validate the reliability of the results. Finally, inflammatory cytokine levels were only measured at baseline, so it is difficult to describe the longitudinal changes in the symptom-inflammatory cytokine network of patients. Notably, mutations in the IDH gene have been definitively associated with the development of glioma. Foundational research has demonstrated that these genetic alterations affect cellular function, including metabolic reprogramming, epigenome alterations and redox homoeostasis.50 In our study, while multiple imputation was employed to handle missing IDH mutation data, this statistical approach cannot fully capture the biological effects of mutations. To address causality, future longitudinal studies should incorporate serial cytokine measurements aligned with treatment phases, as well as adjustments for IDH and MGMT status and BBB permeability markers, to clarify cytokine autonomy in symptom regulation.
Conclusions
In summary, using network analysis, we aimed to contribute to the ongoing debate by exploring the relationship between multidimensional symptom experience and inflammation in patients with glioma, embracing the potential complexity of the symptom-inflammation link. In addition, based on an index of centrality, we identified the core symptoms of patients during different treatment periods of the disease by conducting symptom networks of multidimensional symptom experiences in 334 patients. We propose to assess symptom severity based on real-world, long-term clinical follow-up data to generate symptom networks and centrality indices to optimize symptom management strategies.
Data Sharing Statement
The original data used and analyzed in the study are available via the corresponding author on reasonable request.
Ethics Approval
This study was conducted following the declaration of Helsinki. This study was registered in the Chinese Clinical Trial Register (ChiCTR2200066578) and approved by the Ethics Committee of Shandong Cancer Hospital and Institute, Shandong First Medical University and Shandong Academy of Medical Sciences (SDTHEC2020012004).
Consent to Participate
Informed consent was obtained from all individual participants included in the study.
Acknowledgment
The authors acknowledge Shihao Zhao for his instrumental role in accessing the IDH mutation data, which were crucial for the analysis.
Author Contributions
All authors made a significant contribution to the work, whether that is in the conception, study design, execution, acquisition of data, analysis and interpretation, or in all these areas; took part in drafting, revising or critically reviewing the article; gave final approval of the version to be published; have agreed on the journal to which the article has been submitted; and agree to be accountable for all aspects of the work.
Funding
This work was supported by the Key Technology Research and Development Program of Shandong (grant number: 2017GSF218028).
Disclosure
The authors have no conflicts of interest to disclose in this work.
References
1. Weller M, Wen PY, Chang SM, et al. Glioma. Nat Rev Dis Primers. 2024;10(1):33. doi:10.1038/s41572-024-00516-y
2. Röttgering JG, Varkevisser TMCK, Gorter M, et al. Symptom networks in glioma patients: understanding the multidimensionality of symptoms and quality of life. J Cancer Surviv. 2024;18(3):1032–1041. doi:10.1007/s11764-023-01355-8
3. Dodd MJ, Miaskowski C, Paul SM. Symptom clusters and their effect on the functional status of patients with cancer. Oncol Nurs Forum. 2001;28(3):465–470.
4. Kim SR, Shin YS, Kim JH, et al. Differences in type composition of symptom clusters as predictors of quality of life in patients with meningioma and glioma. World Neurosurg. 2017;98:50–59. doi:10.1016/j.wneu.2016.10.085
5. Coomans MB, Dirven L, Aaronson NK, et al. Symptom clusters in newly diagnosed glioma patients: which symptom clusters are independently associated with functioning and global health status?. Neuro Oncol. 2019;21(11):1447–1457. doi:10.1093/neuonc/noz118
6. Wang M, Chen S, He X, et al. Targeting inflammation as cancer therapy. J Hematol Oncol. 2024;17(1):13. doi:10.1186/s13045-024-01528-7
7. Bianconi A, Prior A, Zona G, et al. Anticoagulant therapy in high grade gliomas: a systematic review on state of the art and future perspectives. J Neurosurg Sci. 2023;67(2):236–240. doi:10.23736/S0390-5616.21.05536-3
8. Sim J, Park J, Moon JS, et al. Dysregulation of inflammasome activation in glioma. Cell Commun Signal. 2023;21(1):239. doi:10.1186/s12964-023-01255-5
9. Ahmad MH, Rizvi MA, Fatima M, et al. Pathophysiological implications of neuroinflammation mediated HPA axis dysregulation in the prognosis of cancer and depression. Mol Cell Endocrinol. 2021;520:111093. doi:10.1016/j.mce.2020.111093
10. Goldsmith DR, Bekhbat M, Mehta ND, et al. Inflammation-related functional and structural dysconnectivity as a pathway to psychopathology. Biol Psychiatry. 2023;93(5):405–418. doi:10.1016/j.biopsych.2022.11.003
11. Shi X, Li H, Xu Y, et al. The prognostic value of the preoperative inflammatory index on the survival of glioblastoma patients. Neurol Sci. 2022;43(9):5523–5531. doi:10.1007/s10072-022-06158-w
12. Satragno C, Schiavetti I, Cella E, et al. Systemic inflammatory markers and volume of enhancing tissue on post-contrast T1w MRI images in differentiating true tumor progression from pseudoprogression in high-grade glioma. Clin Transl Radiat Oncol. 2024;49:100849. doi:10.1016/j.ctro.2024.100849
13. Yang SD, Chen MZ, Yang DF, et al. IL-6 significantly correlated with the prognosis in low-grade glioma and the mediating effect of immune microenvironment. Medicine. 2024;103(19):e38091. doi:10.1097/MD.0000000000038091
14. Dehhaghi M, Kazemi Shariat Panahi H, Heng B, et al. the gut microbiota, kynurenine pathway, and immune system interaction in the development of brain cancer. Front Cell Dev Biol. 2020;8:562812. doi:10.3389/fcell.2020.562812
15. Li H, Shi X, Li J, et al. Psychoneurological symptoms and inflammatory markers in patients with glioma in China: a network analysis. Support Care Cancer. 2023;31(7):435. doi:10.1007/s00520-023-07873-6
16. Sun Q, Zhao X, Li R, et al. STAT3 regulates CD8+ T cell differentiation and functions in cancer and acute infection. J Exp Med. 2023;220(4):e20220686. doi:10.1084/jem.20220686
17. Renna ME, Shrout MR, Madison AA, et al. Depression and anxiety in colorectal cancer patients: ties to pain, fatigue, and inflammation. Psychooncology. 2022;31(9):1536–1544. doi:10.1002/pon.5986
18. Song L, Quan X, Su L, et al. Inflammation and behavioral symptoms in preoperational glioma patients: is depression, anxiety, and cognitive impairment related to markers of systemic inflammation?. Brain Behav. 2020;10(9):e01771. doi:10.1002/brb3.1771
19. Borsboom D, Cramer AO. Network analysis: an integrative approach to the structure of psychopathology. Annu Rev Clin Psychol. 2013;9(1):91–121. doi:10.1146/annurev-clinpsy-050212-185608
20. Hevey D. Network analysis: a brief overview and tutorial. Health Health Psychol Behav Med. 2018;6(1):301–328. doi:10.1080/21642850.2018.1521283
21. Yang Y, Sun H, Luo X, et al. Network connectivity between fear of cancer recurrence, anxiety, and depression in breast cancer patients. J Affect Disord. 2022;309:358–367. doi:10.1016/j.jad.2022.04.119
22. Kalantari E, Kouchaki S, Miaskowski C, et al. Network analysis to identify symptoms clusters and temporal interconnections in oncology patients. Sci Rep. 2022;12(1):17052. doi:10.1038/s41598-022-21140-4
23. Singh A, Schurman SH, Bektas A, et al. Aging and inflammation. Cold Spring Harb Perspect Med. 2024;14(6):a041197. doi:10.1101/cshperspect.a041197
24. González-Gil EM, Peruchet-Noray L, Sedlmeier AM, et al. Association of body shape phenotypes and body fat distribution indexes with inflammatory biomarkers in the European Prospective Investigation into Cancer and Nutrition (EPIC) and UK biobank. BMC Med. 2024;22(1):334. doi:10.1186/s12916-024-03544-3
25. Cleeland CS, Mendoza TR, Wang XS, et al. Assessing symptom distress in cancer patients: the M.D. Anderson symptom inventory. Cancer. 2000;89(7):1634–1646. doi:10.1002/1097-0142(20001001)89:7<1634::aid-cncr29>3.0.co;2-v
26. Armstrong TS, Mendoza T, Gning I, et al. Validation of the M.D. Anderson Symptom Inventory Brain Tumor Module (MDASI-BT). J Neurooncol. 2006;80(1):27–35. doi:10.1007/s11060-006-9135-z
27. McNally RJ. Can network analysis transform psychopathology?. Behav Res Ther. 2016;86:95–104. doi:10.1016/j.brat.2016.06.006
28. Bringmann LF, Elmer T, Epskamp S, et al. What do centrality measures measure in psychological networks?. J Abnorm Psychol. 2019;128(8):892–903. doi:10.1037/abn0000446
29. Epskamp S, Borsboom D, Fried EI. Estimating psychological networks and their accuracy: a tutorial paper. Behav Res Methods. 2018;50(1):195–212. doi:10.3758/s13428-017-0862-1
30. Armour C, Fried EI, Deserno MK, et al. A network analysis of DSM-5 posttraumatic stress disorder symptoms and correlates in U.S. military veterans. J Anxiety Disord. 2017;45:49–59. doi:10.1016/j.janxdis.2016.11.008
31. Mullarkey MC, Marchetti I, Beevers CG. Using network analysis to identify central symptoms of adolescent depression. J Clin Child Adolesc Psychol. 2019;48(4):656–668. doi:10.1080/15374416.2018.1437735
32. Ma Y, He B, Jiang M, et al. Prevalence and risk factors of cancer-related fatigue: a systematic review and meta-analysis. Int J Nurs Stud. 2020;111:103707. doi:10.1016/j.ijnurstu.2020.103707
33. Wassef CE, Cain SA, Drummond KJ. Changing practice to improve quality of life in glioma. J Neurosurg. 2024;141(5):1270–1280. doi:10.3171/2024.2.JNS221799
34. Maisel P, Baum E, Donner-Banzhoff N. Fatigue as the chief complaint–epidemiology, causes, diagnosis, and treatment. Dtsch Arztebl Int. 2021;118(33–34):566–576. doi:10.3238/arztebl.m2021.0192
35. Bower JE, Ganz PA, Irwin MR, et al. Do all patients with cancer experience fatigue? A longitudinal study of fatigue trajectories in women with breast cancer. Cancer. 2021;127(8):1334–1344. doi:10.1002/cncr.33327
36. Zhu Z, Sun Y, Kuang Y, et al. Contemporaneous symptom networks of multidimensional symptom experiences in cancer survivors: a network analysis. Cancer Med. 2023;12(1):663–673. doi:10.1002/cam4.4904
37. de Rooij BH, Oerlemans S, van Deun K, et al. Symptom clusters in 1330 survivors of 7 cancer types from the PROFILES registry: a network analysis. Cancer. 2021;127(24):4665–4674. doi:10.1002/cncr.33852
38. Lacourt TE, Vichaya EG, Chiu GS, et al. The high costs of low-grade inflammation: persistent fatigue as a consequence of reduced cellular-energy availability and non-adaptive energy expenditure. Front Behav Neurosci. 2018;12:78. doi:10.3389/fnbeh.2018.00078
39. Natalini JG, Singh S, Segal LN. The dynamic lung microbiome in health and disease. Nat Rev Microbiol. 2023;21(4):222–235. doi:10.1038/s41579-022-00821-x
40. Beurel E, Toups M, Nemeroff CB. The bidirectional relationship of depression and inflammation: double trouble. Neuron. 2020;107(2):234–256. doi:10.1016/j.neuron.2020.06.002
41. Tuysuz EC, Mourati E, Rosberg R, et al. Tumor suppressor role of the complement inhibitor CSMD1 and its role in TNF-induced neuroinflammation in gliomas. J Exp Clin Cancer Res. 2024;43(1):98. doi:10.1186/s13046-024-03019-6
42. Rha SY, Lee J. Stable symptom clusters and evolving symptom networks in relation to chemotherapy cycles. J Pain Symptom Manage. 2021;61(3):544–554. doi:10.1016/j.jpainsymman.2020.08.008
43. Lapointe S, Perry A, Butowski NA. Primary brain tumours in adults. Lancet. 2018;392(10145):432–446. doi:10.1016/S0140-6736(18)30990-5
44. Schaff LR, Mellinghoff IK. Glioblastoma and other primary brain malignancies in adults: a review. JAMA. 2023;329(7):574–587. doi:10.1001/jama.2023.0023
45. Uribe-Cardenas R, Giantini-Larsen AM, Garton A, et al. Innovations in the diagnosis and surgical management of low-grade gliomas. World Neurosurg. 2022;166:321–327. doi:10.1016/j.wneu.2022.06.070
46. Wen PY, Stein A, van den Bent M, et al. Dabrafenib plus trametinib in patients with BRAFV600E-mutant low-grade and high-grade glioma (ROAR): a multicentre, open-label, single-arm, Phase 2, basket trial. Lancet Oncol. 2022;23(1):53–64. doi:10.1016/S1470-2045(21)00578-7
47. Kuckuck S, van der Valk ES, Scheurink AJW, et al. Glucocorticoids, stress and eating: the mediating role of appetite-regulating hormones. Obes Rev. 2023;24(3):e13539. doi:10.1111/obr.13539
48. Lin Y, Bruner DW, Paul S, et al. A network analysis of self-reported psychoneurological symptoms in patients with head and neck cancer undergoing intensity-modulated radiotherapy. Cancer. 2022;128(20):3734–3743. doi:10.1002/cncr.34424
49. Zhu Z, Guo M, Dong T, et al. Assessing psychological symptom networks related to HIV-positive duration among people living with HIV: a network analysis. AIDS Care. 2022;34(6):725–733. doi:10.1080/09540121.2021.1929815
50. Han S, Liu Y, Cai SJ, et al. IDH mutation in glioma: molecular mechanisms and potential therapeutic targets. Br J Cancer. 2020;122(11):1580–1589. doi:10.1038/s41416-020-0814-x
 © 2025 The Author(s). This work is published and licensed by Dove Medical Press Limited. The
full terms of this license are available at https://www.dovepress.com/terms.php
and incorporate the Creative Commons Attribution
- Non Commercial (unported, 4.0) License.
By accessing the work you hereby accept the Terms. Non-commercial uses of the work are permitted
without any further permission from Dove Medical Press Limited, provided the work is properly
attributed. For permission for commercial use of this work, please see paragraphs 4.2 and 5 of our Terms.
© 2025 The Author(s). This work is published and licensed by Dove Medical Press Limited. The
full terms of this license are available at https://www.dovepress.com/terms.php
and incorporate the Creative Commons Attribution
- Non Commercial (unported, 4.0) License.
By accessing the work you hereby accept the Terms. Non-commercial uses of the work are permitted
without any further permission from Dove Medical Press Limited, provided the work is properly
attributed. For permission for commercial use of this work, please see paragraphs 4.2 and 5 of our Terms.