")
Back to Journals » Clinical Ophthalmology » Volume 18
Nonlinear Relationship Between Low Density Lipoprotein and the Probability of Diabetic Macular Edema
Authors Yao Y , Lin Z, Ye B, Long T, Li S, Liang H, Luo T, Dou X
Received 1 November 2023
Accepted for publication 23 February 2024
Published 13 June 2024 Volume 2024:18 Pages 1717—1725
DOI https://doi.org/10.2147/OPTH.S447647
Checked for plagiarism Yes
Review by Single anonymous peer review
Peer reviewer comments 2
Editor who approved publication: Dr Scott Fraser
Yufeng Yao,1,2 Zhenli Lin,3 Baikang Ye,1 Tingxi Long,1,4 Suting Li,1,4 Huixian Liang,1,4 Tianyi Luo,1,4 Xiaoyan Dou1
1Department of Ophthalmology, Shenzhen Second People’s Hospital, The First Affiliated Hospital of Shenzhen University, Shenzhen, Guangdong Province, People’s Republic of China; 2Shantou University Medical College, Shantou, Guangdong Province, People’s Republic of China; 3Department of Ophthalmology, Shenzhen University General Hospital, Shenzhen, Guangdong Province, People’s Republic of China; 4Shenzhen University Medical College, Shenzhen University, Shenzhen, Guangdong Province, People’s Republic of China
Correspondence: Xiaoyan Dou, Department of Ophthalmology, Shenzhen Second People’s Hospital, The First Affiliated Hospital of Shenzhen University, No. 3002 Sungang West Road, Futian District, Shenzhen, Guangdong Province, 518035, People’s Republic of China, Tel/Fax +86 13600169183, Email [email protected]
Purpose: Previous studies simply linearized the relationship between low density lipoprotein (LDL) and diabetic macular edema’s (DME) probability, ignoring the possibility of a nonlinear relationship between them. We aimed to investigate the nonlinear relationship between LDL and DME probability in patients with type 2 diabetes mellitus (T2DM).
Patients and methods: The study recruited 431 T2DM patients who attended Guangdong Provincial People’s Hospital from December 2017 to November 2018. A multivariate logistic regression model was conducted to evaluate the association between LDL and DME probability. The nonlinear relationship was identified by generalized additive model. Subgroup analyses were performed to assess the consistency of the association in different subgroups.
Results: LDL was positively associated with DME probability (OR=1.60, 95% CI: 1.10~2.34, P=0.0145) after adjusting for covariates. A nonlinear relationship between LDL and DME probability was discovered, with an inflection point for LDL around 4.85 mmol/L (95% CI: 4.18~4.93, P=0.037). The effect sizes and the confidence intervals on the left and right sides of inflection point were 2.17 (1.31 to 3.58) and 0.26 (0.04 to 1.77), respectively. Subgroup analyses revealed other variables had no effect on the association between them.
Conclusion: Our finding suggested LDL was positively correlated with DME probability in T2DM patients. And the relationship between LDL and DME probability was nonlinear. Our findings need to be confirmed by further causal researches.
Keywords: low density lipoprotein, diabetic macular edema, nonlinearity, association
Introduction
Diabetic macular edema (DME) is defined as retinal thickening that approaches or involves macular center due to abnormal intramacular liquid accumulation under diabetic condition.1 DME is the main cause of visual impairment in patients with type 2 diabetes mellitus (T2DM), with morbidity raging from 1.4% to 5.57%.2 The prevalence of DME is rising in tandem with the global prevalence of T2DM, which not only has a negative impact on people’s quality of life but also causes a significant economic burden on health care budgets.3 Investigating DME risk factors would benefit in the effective treatment of DME and the reduction of its recurrence rate.
Most researches have proved that hyperlipidemia is one of the risk factors for DME.4 Increased permeability of the retinal microvasculature leads to outward leakage and deposition of intravascular lipoproteins, resulting in the loss of retinal cell function in the affected areas.5 The hard exudate in fundus photographs is the compound formed by lipid-filled macrophages and extracellular lipids.5 Low density lipoprotein (LDL), which accounts for 80–90% of circulating cholesterol, is a key indicator of hyperlipidaemia.6 LDL primarily transports cholesterol from blood to peripheral tissues, where it is eventually eliminated through receptors.6 Under pathological conditions, LDL tends to be converted to oxidized LDL (OxLDL) in the damaged endothelium, triggering a cascade of vascular events such as endothelial dysfunction and atherosclerosis.7
Most current clinical studies on the association between lipoproteins and DME simply linearized their relationship, without considering the nonlinear relationship.4 However, nonlinear association between exposure and outcome were more common in biomedical research. In such case, a more efficient method was required to deal with nonlinear relationships. Therefore, we conducted a secondary analysis based on the available data from a published paper.8 In original paper, the author suggested LDL was one of risk factors for DME by using binary logistic regression analysis. While in secondary analysis, a two-piecewise logistics regression model was conducted to identify the nonlinear relationship between LDL and DME probability.
Method
Data Source and Study Population
The data came from the “Dryad” database (https://datadryad.org). This website allows users to free download the raw data from the literature. We cited the related Dryad data package in our paper according to Dryad terms of service [Zhuang, Xuenan et al, Data from: Association of diabetic retinopathy and diabetic macular edema with renal function in southern Chinese patients with type 2 diabetes mellitus: a single-center observational study, Dryad, Dataset, https://doi.org/10.5061/dryad.6kg1sd7]. The original research was a retrospective study that included 431 patients with T2DM who received an ophthalmology consultation in the Department of Endocrinology at Guangdong Provincial People’s Hospital from December 2017 to November 2018. The following were the exclusion criteria for the research population: 1) Other ocular diseases such as glaucoma, endophthalmitis, retinal vascular obstruction, age-related macular degeneration, refraction greater than 3.00D and ocular trauma; 2) Previous history of intravitreal injections or renal dialysis; 3) Severe systemic diseases, such as myocardial infarction, cerebral infarction and connective tissue disease; 4) Women in pregnancy or menstrual status. More study specifics could be found in the research completed by Zhuang et al.8 Zhuang et al declared unequivocally: This study was conducted in accordance with the Helsinki Declaration and was approved by the Research Ethics Committee of Guangdong Provincial People’s Hospital (Registration Number: gdrec2016232A).
Variable Source and Definition of DME
Participants clinical information was acquired through electronic medical records. Laboratory tests include liver and kidney function, lipid analysis and urinalysis. Blood and urine samples were taken when patients were fasting before 8:00 a.m. DME was evaluated by a fundus specialist through fundus photography. According to the Early Treatment Diabetic Retinopathy Study Report, DME was defined as a retinal thickness or hard exudate within one optic disc diameter of the macular fovea with fundus manifestations of diabetic retinopathy.9 The measurement and criteria for each variable were described in detail in the research completed by Zhuang et al.8
Statistical Analysis
The participants were divided into two groups based on the presence of DME, and their clinical characteristics were described and compared across groups. Continuous variables with normal distributions were presented as “mean (standard deviation)” with P-values derived from two independent sample t-tests, while continuous variables with non-normal distributions were presented as “median (Q1-Q3)” with P-values derived from Mann–Whitney U-test. Categorical variables were presented as “sample size (%)” and P-values were derived from χ2 test. The logistic regression model was conducted to investigate the association between LDL and DME probability. LDL was firstly analyzed as a continuous variable, and then a dichotomous based on the reference interval in clinical practice (0.00–4.14 mmol/L). We presented the unadjusted, minimally adjusted and fully adjusted models in accordance with the Strengthening the Reporting of Observational Studies in Epidemiology recommendations. A covariate would be adjusted when it met the following criteria: 1) Odd ratio (OR) had changed by at least 10% when covariate was included in or excluded from the model;10 2) Covariate was associated with both LDL and DME in clinical practice; 3) Covariate was adjusted in previous similar studies.4 Only one covariate was adjusted when there were congener covariates in the set of adjusted covariates. In addition, we used a generalized additive model to identify the nonlinear relationship between LDL and DME probability. A two-piecewise logistics regression model would be conducted if a nonlinear relationship was observed. Then the inflection point was determined based on the recursive algorithm, and the 95% confidence interval (CI) of the inflection point was calculated by bootstrap algorithm. The log-likelihood ratio test was applied to compare the one-piecewise regression model with the two-piecewise regression model. P-values for interactional tests were derived from likelihood ratio tests and stratified linear regression models for subgroup analyses. In all analyses, P-values less than 0.05 (two-sided) were considered statistically significant. EmpowerStats version 4.2 (http://www.empowerstats.net/analysis/, X&Y Solutions Software, Boston, MA, USA) and the R language package version 4.2.0 (http://www.R-project.org/, The R Foundation) were used for statistical analysis.
Results
The Characteristic of Participants
Table 1 shows the baseline characteristics of the study population. 431 patients (244 men and 187 women) participated in the study, with a mean age of 59.08 years and a median DM duration of 10 years (range: 1–31 years). There were 164 diabetes retinopathy patients with a probability of 38.05%. DME was found in 56 patients, with a probability of 12.99% in 431 participants and 34.15% in 164 diabetes retinopathy patients. Participants with DME had a longer DM duration, lower levels of serum albumin, alanine aminotransferase and aspartate transaminase, higher blood urea nitrogen and D-dimer levels, higher serum level of LDL and higher probability of hypertension, dyslipidemia and renal insufficiency compared to those without DME (Table 1).
 |
Table 1 Characteristics of the Study Participants |
The Relationship Between LDL and DME Probability
Logistic regression model was applied to observe the relationship between LDL and DME probability. LDL was positively associated with DME probability in the crude model (OR=1.56, 95% CI: 1.17–2.08, P=0.0023). And there was no significant change in the results in the minimally adjusted model (OR=1.63, 95% CI: 1.20–2.20, P=0.0016). In the fully adjusted model, LDL was still positively correlated with DME probability (OR=1.60, 95% CI: 1.10~2.34, P=0.0145. Table 2). LDL was then analyzed as a dichotomous variable based on the reference interval in clinical practice. The OR in higher LDL group (LDL>4.14 mmol/L) was 3.30 (95% CI: 1.33–8.19, p=0.0101) compared with lower LDL group (LDL≤ 4.14 mmol/L) in the fully adjusted model, implying a 230% increase in DME risk in higher LDL group (Table 2).
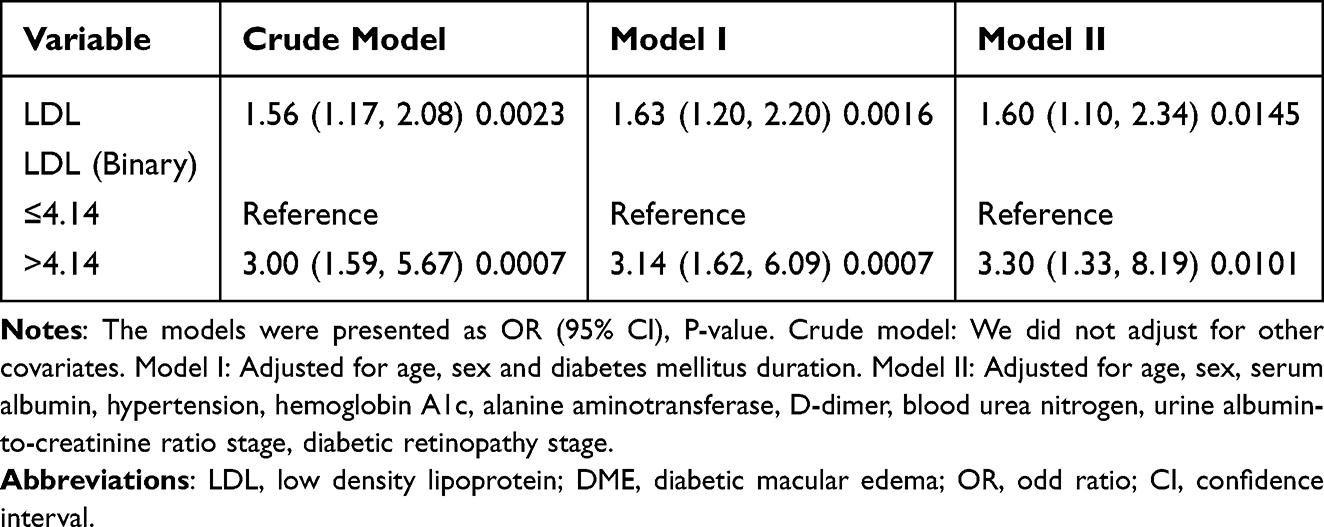 |
Table 2 The Linear Relationship Between LDL and DME Probability in Different Models |
The Analysis of Nonlinear Relationship
The generalized additive model was applied to demonstrate the relationship between LDL and DME probability, and a nonlinear relationship was observed (Figure 1). The inflection point was at 4.85 mmol/L (95% CI: 4.18~4.93, P for likelihood: 0.037) according to the fully adjusted two-piecewise logistics regression model (Table 3). On the left of inflection point, LDL was positively associated with DME probability (OR=2.17, 95% CI: 1.31 to 3.58, p=0.0024), while no association was found on the right of inflection point (OR=0.26, 95% CI: 0.04 to 1.77, P=0.1677 Table 3).
 |
Table 3 The Nonlinear Relationship Between LDL and DME Probability in Adjusted Model |
 |
Figure 1 The relationship between LDL and DME probability. Notes: A nonlinear relationship between them was detected after adjusting for age, sex, serum albumin, hypertension, hemoglobin A1c, alanine aminotransferase, D-dimer, blood urea nitrogen, urine albumin-to-creatinine ratio stage, diabetic retinopathy stage. |
The Results of Subgroup Analyses
Subgroup analyses were conducted to explore factors that might modify the association between LDL and the probability of DME (Table 4). Age, gender, DM duration, hypertension, serum albumin level, urine albumin-to-creatinine ratio stage and chronic kidney disease stage were chosen as stratification factors. The results revealed that none of the above stratification factors affected the association between LDL and the probability of DME (Table 4).
 |
Table 4 The Relationship Between LDL and DME Probability in Prespecified and Exploratory Subgroups |
Discussion
Our findings indicated a nonlinear relationship with an inflection point between LDL and DME probability in patients with T2DM. And on the left and right sides of the inflection point, the relationship between LDL and DME probability was observed differently. Subgroup analyses suggested a stable relationship between the LDL and DME probability.
Most previous clinical studies have confirmed LDL as a risk factor for DME probability in patients with T2DM. In the original study, Zhuang et al discovered that LDL was a one of risk factors for DME probability (OR=1.46) in southern Chinese patients with T2DM through the multivariate logistic regression model.8 The same conclusion was drawn (OR=1.358) through the multivariate logistic regression model in a cross-sectional study of 1382 southern Indian patients with T2DM.11 In a prospective study of 500 Australian patients with T2DM, LDL was still found to be a risk factor for DME probability (OR=1.55) after adjusting for age, gender, duration of diabetes, hemoglobin A1c, systolic blood pressure, body mass index, and use of hypoglycemic drugs, insulin, and lipid-lowering agents.12 Other studies have also reported a positive association between LDL and DME probability.13,14 The findings of the preceding studies were largely consistent with our results. However, they ignored the nonlinear relationship between LDL and DME probability due to the assumption of linear relationship and the application of the linear regression model.
LDL was found to be significantly associated with fundus manifestations in DME, such as exudation, macular thickness and so on, in addition to the probability of DME. A few cross-sectional studies reported positive associations between LDL and central macular thickness, central macular volume, and total hard exudate area in patients with T2DM, respectively.15–17 Kameda et al discovered that diabetic patients with higher baseline LDL levels had a more progressive hard exudate, severer macular edema and a worse visual prognosis in the future.18 It should be noted that these studies had a potential statistical limitation --- The preconceived notion of a linear relationship between exposure and outcome.
The nonlinear relationship between LDL and DME probability observed in this secondary analysis required careful consideration and interpretation. Table S1 shows that when compared with the low LDL group (LDL<4.85 mmol/L), participants in the high LDL group (LDL≥4.85 mmol/L) have higher lipoprotein levels. Those with higher lipoprotein levels were more likely to use lipid-lowering drugs. Furthermore, some researches have indicated that taking lipid-lowering drugs may reduce the risk of DME. Chung et al discovered that taking statins for hyperlipidemia reduced the risk of DME (OR=0.33).19 Some randomized controlled trials demonstrated that the using of Fenofi brate (a lipid-lowering drug) improved symptoms in patients with DME.20,21 In addition, participants in the high LDL group (LDL ≥4.85 mmol/L) have generally poorer kidney function (Table S1). And patients with impaired kidney function tended to require haemodialysis. Some studies reported a significant improvement in DME symptoms after haemodialysis,22–24 which could be explained by the fact that haemodialysis improves the volume load and fluid circulation of the entire body, including the eyes. The characteristics and medical behavioral tendencies of participants in high LDL group may contribute to the weakened association between LDL and DME probability under high serum LDL levels.
The mechanisms by which high LDL levels caused the development and progression of DME were not fully understood. It had been postulated that high LDL levels played an important role in the breakdown of the blood retinal barrier, resulting in the occurrence of DME.3,25 High LDL was more likely to be oxidized and transform into Oxidized LDL (OxLDL) under oxidative stress condition such as hyperglycemia.26 OxLDL increased ROS production by activating the Wnt pathway in a dose-dependent manner, resulting in more OxLDL production that ultimately aged retinal pigment epithelial (RPE) and inhibited their differentiation.25 Moreover, OxLDL activated inflammatory factors such as tumor necrosis factor-α and vascular endothelial growth factor,27 and caused the dysfunction of ZO-1 proteins (a tight junction protein between RPE) through the mediation of Wnt pathway, which increased RPE permeability and destructed the outer blood-retinal barrier (BRB).25 OxLDL also activated the nuclear factor-kappa B pathway in vascular endothelia via lectin-like Ox-LDL receptor-1, promoting inflammatory factors expression and endothelial damage.28 Meanwhile, OxLDL increased the expression of caspases29 and Fas receptors,30 inducing endothelial apoptosis and eventually destroying the inner BRB, which is composed of retinal vascular endothelium.31 The destruction of the inner and outer BRB was a key mechanism in the evolution of DME.3 Disruption of the inner BRB increased vascular permeability and rupture, leading to the increased leakage of plasma, lipoproteins and red blood cells, which manifested clinically as edema, exudation and haemorrhage.32 While disruption of the outer BRB increased the leakage and accumulation of extracellular fluid, as well as the difficulty in removal of fluid accumulation, resulting in persistent macular edema.33
It should be noted that our analysis had some advantages over previous similar studies. We used a generalized additive model to identify the nonlinear relationship between LDL and DME probability. And in order to calculate the inflection point, we conducted a two-piecewise logistics regression model and the recursive algorithm. This was the highlight of our analysis. In addition, the subgroup analyses were performed to explore the factors that may influence the relationship between LDL and DME probability, which was not previously available in similar studies. However, potential limitations should be considered when interpreting the results of our study. Firstly, since our study only included southern Chinese patients with T2DM, our conclusion should be interpreted with caution in patients with macular edema caused by other diseases. Secondly, smoking, BMI and carbohydrate-restricted diet may affect the LDL level, but the data did not include the relative information. Thus, whether these factors affect the association between LDL and DME remind unknown. Thirdly, as the original research was a cross-sectional study of disease prevalence rather than incidence, the level of LDL that preceded the DME observed was uncertain. Lastly, our analysis tested association instead of causation.
In conclusion, based on our results, there was a nonlinear relationship and saturation effect between the LDL and DME probability, with an inflection with an inflection point of 4.85 mmol/L. Higher LDL levels may indicate a higher risk of DME. Paying attention to LDL levels in patients with T2DM may help to alert us for DME screening, which would benefit in early diagnosis and early treatment, avoiding the worse visual prognosis due to delayed treatment. Further prospective studies with large samples were required to determine whether changes in LDL level affected the incidence of DME and external validation of their nonlinear relationship.
Data Sharing Statement
The dataset was collected by Zhuang et al and is now available on Dryad (via: https://doi.org/10.5061/dryad.6kg1sd7). The datasets generated or analyzed during the current study are available from the corresponding author on reasonable request.
Ethics Approval and Consent to Participate
This study was performed according to the Declaration of the Helsinki and approved by the institutional review board of Guangdong Provincial People’s Hospital (registration number: gdrec2016232A). Since the original study was a retrospective cross-sectional study and the data were anonymous, the requirement for informed consent was therefore waived by institutional review board of Guangdong Provincial People’s Hospital.
Funding
This work was supported by Shenzhen Second People’ s Hospital Clinical Research Fund of Guangdong Province High-level Hospital Construction Project (Grant No. 2023yjlcyj006).
Disclosure
The authors declare that they have no competing interests.
References
1. Daruich A, Matet A, Moulin A, et al. Mechanisms of macular edema: beyond the surface. Prog Retin Eye Res. 2018;63:20–68. doi:10.1016/j.preteyeres.2017.10.006
2. Thomas RL, Dunstan FD, Luzio SD, et al. Prevalence of diabetic retinopathy within a national diabetic retinopathy screening service. Br J Ophthalmol. 2015;99(1):64–68. doi:10.1136/bjophthalmol-2013-304017
3. Zhang J, Zhang J, Zhang C, et al. Diabetic macular edema: current understanding, molecular mechanisms and therapeutic implications. Cells. 2022;11(21):3362. doi:10.3390/cells11213362
4. Das R, Kerr R, Chakravarthy U, et al. Dyslipidemia and diabetic macular edema: a systematic review and meta-analysis. Ophthalmology. 2015;122(9):1820–1827. doi:10.1016/j.ophtha.2015.05.011
5. Chew EY, Klein ML, Ferris FL, et al. Association of elevated serum lipid levels with retinal hard exudate in diabetic retinopathy. Early Treatment Diabetic Retinopathy Study (ETDRS) Report 22. Arch Ophthalmol. 1996;114(9):1079–1084. doi:10.1001/archopht.1996.01100140281004
6. Tall AR. An overview of reverse cholesterol transport. Eur Heart J. 1998;19:A31–35.
7. Makuch R, Walsh MP, Dabrowska R. Location of the calmodulin- and actin-binding domains at the C-terminus of caldesmon. FEBS Lett. 1989;247(2):411–414. doi:10.1016/0014-5793(89)81381-X
8. Zhuang X, Cao D, Yang D, et al. Association of diabetic retinopathy and diabetic macular oedema with renal function in southern Chinese patients with type 2 diabetes mellitus: a single-centre observational study. BMJ Open. 2019;9(9):e031194. doi:10.1136/bmjopen-2019-031194
9. Kinyoun J, Barton F, Fisher M, et al. Detection of diabetic macular edema. Ophthalmoscopy versus photography--early treatment diabetic retinopathy study report number 5. The ETDRS research group. Ophthalmology. 1989;96(6):746–750. doi:10.1016/S0161-6420(89)32814-4
10. Vandenbroucke JP, von Elm E, Altman DG, et al. Strengthening the reporting of observational studies in epidemiology (STROBE): explanation and elaboration. Ann Intern Med. 2007;147(8):W163–194. doi:10.7326/0003-4819-147-8-200710160-00010-w1
11. Rema M, Srivastava BK, Anitha B, et al. Association of serum lipids with diabetic retinopathy in urban South Indians--The Chennai Urban Rural Epidemiology Study (CURES) Eye Study--2. Diabet Med. 2006;23(9):1029–1036. doi:10.1111/j.1464-5491.2006.01890.x
12. Benarous R, Sasongko MB, Qureshi S, et al. Differential association of serum lipids with diabetic retinopathy and diabetic macular edema. Invest Ophthalmol Vis Sci. 2011;52(10):7464–7469. doi:10.1167/iovs.11-7598
13. Miljanovic B, Glynn RJ, Nathan DM, et al. A prospective study of serum lipids and risk of diabetic macular edema in type 1 diabetes. Diabetes. 2004;53(11):2883–2892. doi:10.2337/diabetes.53.11.2883
14. Raman R, Rani PK, Kulothungan V, et al. Influence of serum lipids on clinically significant versus nonclinically significant macular edema: SN-DREAMS Report number 13. Ophthalmology. 2010;117(4):766–772. doi:10.1016/j.ophtha.2009.09.005
15. Sasaki M, Kawashima M, Kawasaki R, et al. Association of serum lipids with macular thickness and volume in type 2 diabetes without diabetic macular edema. Invest Ophthalmol Vis Sci. 2014;55(3):1749–1753. doi:10.1167/iovs.13-13035
16. Liang J, Lei W, Cheng J. Correlations of blood lipids with early changes in macular thickness in patients with diabetes. J Fr Ophtalmol. 2019;42(3):276–280. doi:10.1016/j.jfo.2018.07.007
17. Sasaki M, Kawasaki R, Noonan JE, et al. Quantitative measurement of hard exudates in patients with diabetes and their associations with serum lipid levels. Invest Ophthalmol Vis Sci. 2013;54(8):5544–5550. doi:10.1167/iovs.13-11849
18. Kameda Y, Kumakawa M, Endo N, et al. Association of systemic health and functional outcomes with changes in hard exudates associated with clinically significant macular oedema over the natural course of the disease. Br J Ophthalmol. 2010;94(6):725–729. doi:10.1136/bjo.2009.158501
19. Chung YR, Park SW, Choi SY, et al. Association of statin use and hypertriglyceridemia with diabetic macular edema in patients with type 2 diabetes and diabetic retinopathy. Cardiovasc Diabetol. 2017;16(1):4.
20. Keech AC, Mitchell P, Summanen PA, et al. Effect of fenofibrate on the need for laser treatment for diabetic retinopathy (FIELD study): a randomised controlled trial. Lancet. 2007;370(9600):1687–1697. doi:10.1016/S0140-6736(07)61607-9
21. Massin P, Peto T, Ansquer JC, et al. Effects of fenofibric acid on diabetic macular edema: the MacuFen study. Ophthalmic Epidemiol. 2014;21(5):307–317. doi:10.3109/09286586.2014.949783
22. Takamura Y, Matsumura T, Ohkoshi K, et al. Functional and anatomical changes in diabetic macular edema after hemodialysis initiation: one-year follow-up multicenter study. Sci Rep. 2020;10(1):7788. doi:10.1038/s41598-020-64798-4
23. Theodossiadis PG, Theodoropoulou S, Neamonitou G, et al. Hemodialysis-induced alterations in macular thickness measured by optical coherence tomography in diabetic patients with end-stage renal disease. Ophthalmologica. 2012;227(2):90–94. doi:10.1159/000331321
24. Hwang H, Chae JB, Kim JY, et al. Changes in optical coherence tomography findings in patients with chronic renal failure undergoing dialysis for the first time. Retina. 2019;39(12):2360–2368. doi:10.1097/IAE.0000000000002312
25. Kim JH, Lee SJ, Kim KW, et al. Oxidized low density lipoprotein-induced senescence of retinal pigment epithelial cells is followed by outer blood-retinal barrier dysfunction. Int J Biochem Cell Biol. 2012;44(5):808–814.
26. Yuan T, Yang T, Chen H, et al. New insights into oxidative stress and inflammation during diabetes mellitus-accelerated atherosclerosis. Redox Biol. 2019;20:247–260. doi:10.1016/j.redox.2018.09.025
27. Zhou T, Hu Y, Chen Y, et al. The pathogenic role of the canonical Wnt pathway in age-related macular degeneration. Invest Ophthalmol Vis Sci. 2010;51(9):4371–4379. doi:10.1167/iovs.09-4278
28. Cominacini L, Pasini AF, Garbin U, et al. Oxidized low density lipoprotein (ox-LDL) binding to ox-LDL receptor-1 in endothelial cells induces the activation of NF-kappaB through an increased production of intracellular reactive oxygen species. J Biol Chem. 2000;275(17):12633–12638.
29. Chen J, Mehta JL, Haider N, et al. Role of caspases in Ox-LDL-induced apoptotic cascade in human coronary artery endothelial cells. Circ Res. 2004;94(3):370–376. doi:10.1161/01.RES.0000113782.07824.BE
30. Imanishi T, Hano T, Sawamura T, et al. Oxidized low density lipoprotein potentiation of Fas-induced apoptosis through lectin-like oxidized-low density lipoprotein receptor-1 in human umbilical vascular endothelial cells. Circ J. 2002;66(11):1060–1064. doi:10.1253/circj.66.1060
31. Wang Z, Liu CH, Huang S, et al. Wnt signaling activates MFSD2A to suppress vascular endothelial transcytosis and maintain blood-retinal barrier. Sci Adv. 2020;6(35):1.
32. Antonetti DA, Klein R, Gardner TW. Diabetic retinopathy. N Engl J Med. 2012;366(13):1227–1239. doi:10.1056/NEJMra1005073
33. Zhang C, Xie H, Yang Q, et al. Erythropoietin protects outer blood-retinal barrier in experimental diabetic retinopathy by up-regulating ZO-1 and occludin. Clin Exp Ophthalmol. 2019;47(9):1182–1197. doi:10.1111/ceo.13619
 © 2024 The Author(s). This work is published and licensed by Dove Medical Press Limited. The
full terms of this license are available at https://www.dovepress.com/terms.php
and incorporate the Creative Commons Attribution
- Non Commercial (unported, 3.0) License.
By accessing the work you hereby accept the Terms. Non-commercial uses of the work are permitted
without any further permission from Dove Medical Press Limited, provided the work is properly
attributed. For permission for commercial use of this work, please see paragraphs 4.2 and 5 of our Terms.
© 2024 The Author(s). This work is published and licensed by Dove Medical Press Limited. The
full terms of this license are available at https://www.dovepress.com/terms.php
and incorporate the Creative Commons Attribution
- Non Commercial (unported, 3.0) License.
By accessing the work you hereby accept the Terms. Non-commercial uses of the work are permitted
without any further permission from Dove Medical Press Limited, provided the work is properly
attributed. For permission for commercial use of this work, please see paragraphs 4.2 and 5 of our Terms.