")
Back to Journals » Clinical Optometry » Volume 17
Objective Evaluation of Relationship Between Tear Film Stability and Visual Fatigue
Authors Watanabe M, Hirota M , Takigawa R, Kato K, Ikeda Y
Received 12 March 2025
Accepted for publication 25 June 2025
Published 1 July 2025 Volume 2025:17 Pages 175—183
DOI https://doi.org/10.2147/OPTO.S522320
Checked for plagiarism Yes
Review by Single anonymous peer review
Peer reviewer comments 2
Editor who approved publication: Mr Simon Berry
Relationship between tear film stability and visual fatigue – Video S1 [522320]
Views: 34
Maki Watanabe,1 Masakazu Hirota,2– 5 Ryusei Takigawa,2 Kanako Kato,2 Yuka Ikeda2
1Division of Orthoptics, Graduate School of Medical Care and Technology, Teikyo University, Itabashi-ku, Tokyo, Japan; 2Department of Orthoptics, Faculty of Medical Technology, Teikyo University, Itabashi-ku, Tokyo, Japan; 3Department of Ophthalmology, School of Medicine, Teikyo University, Itabashi-ku, Tokyo, Japan; 4Graduate Degree Program of Health Data Science, Teikyo University, Itabashi-ku, Tokyo, Japan; 5Graduate Degree Program of Comprehensive Applied Data Science, Teikyo University, Itabashi-ku, Tokyo, Japan
Correspondence: Masakazu Hirota, Department of Orthoptics, Faculty of Medical Technology, Teikyo University, 2-11-1 Kaga, Itabashi-ku, Tokyo, 173-8605, Japan, Tel +81-03-3964-1328, Fax +81-03-3963-0303, Email [email protected]
Purpose: To investigate the relationship between tear film stability and visual fatigue using two objective measurements: the non-invasive tear film break-up time (NI-BUT) and the binocular fusion maintenance (BFM) test.
Methods: Eleven young adult volunteers (age [mean ± standard deviation], 20.7 ± 1.4 years) participated in this study. The NI-BUT was determined using the distortion of the mire ring. BFM was assessed by measuring the transmittance of liquid crystals placed in front of the subject’s non-dominant eye when binocular fusion was broken, and non-dominant eye was shifted to heterophoric. The volunteers were administered the NI-BUT and BFM before and after a 30-minute visual task.
Results: NI-BUT (pre vs post: 9.12 ± 1.00 s vs 5.69 ± 3.11 s) was significantly shorter in the post-visual task than in the pre-visual task (P = 0.011). BFM (0.95 ± 0.09 vs 0.75 ± 0.16) was significantly lower in the post-visual task than in the pre-visual task (P = 0.012). The change in NI-BUT was significantly and positively correlated with the change in BFM (R2 = 0.385, P = 0.042).
Conclusion: These objective findings support the association between tear film stability and visual fatigue.
Plain Language Summary: Although subjective questionnaire studies have reported that eye dryness is associated with increased eye fatigue, objective evidence remains insufficient. In this study, we investigated the relationship between eye dryness and eye fatigue using objective measurements and found a correlation between them. These findings strengthen previous research and suggest the importance of preventing eye fatigue by maintaining proper tear film stability.
Keywords: eye movements, binocular fusion, binocular vision, tear film, visual fatigue
Introduction
The proliferation of digital devices in modern society has led to an increasing prevalence of computer vision syndrome (CVS), also known as digital eye strain (DES).1,2 CVS manifests as a constellation of vision-related physical and mental symptoms that develop in response to prolonged digital device usage, particularly in occupational settings.3 The primary manifestations include visual fatigue, dry eyes, headache, blurred vision, and musculoskeletal discomfort in the neck and shoulder regions.3,4 Recent meta-analytic findings indicate that approximately 66% of digital device users experience some form of CVS symptoms.5
The ubiquity of smartphones, characterized by their convenient internet accessibility,6 has become particularly noteworthy, with studies indicating that over 50% of young people across Asia,7,8 the United States,9 and Europe10 engage in daily social networking activities via these devices. While smartphones have revolutionized modern communication patterns and become integral to contemporary life, their widespread adoption has been accompanied by various health concerns,11 including acute acquired esotropia,12 dry eye disease,13 and visual fatigue.14
Previous research has established that more than 30% of patients with dry eye disease report concurrent visual fatigue,15–17 suggesting a potential relationship between tear film stability and visual fatigue. However, the existing literature has predominantly relied on subjective questionnaire-based assessments, resulting in a paucity of objective evidence. The development of objective methodologies to evaluate this relationship would provide more robust support for this association.
Traditional understanding has linked visual fatigue primarily to vergence and accommodation parameters,18,19 which are not directly associated with tear film stability and may be influenced by aging processes. However, common symptoms reported by individuals experiencing visual fatigue, such as blurred vision and diplopia, may be attributed to tear film instability. Recent technological advances have enabled the assessment of binocular fusion maintenance (BFM) through focus on binocular fusion,20–23 particularly relevant given that patients reporting diplopia and blurred vision frequently experience visual fatigue. Current evidence suggests that BFM may serve as a quantitative indicator of visual fatigue.
Based on these observations, we hypothesize that investigating the correlation between BFM and tear film stability could provide an objective, quantitative assessment of the relationship between tear film stability and visual fatigue. This approach may offer new insights into the mechanisms underlying digital eye strain and inform more effective interventions for this increasingly prevalent condition.
Methods
Subjects
A total of 11 young adult volunteers (age [mean ± standard deviation], 20.7 ± 1.4 years) participated in this study. All subjects underwent complete ophthalmologic examinations, including the determination of ocular dominance using the hole-in-the-card test, assessment of best-corrected visual acuity at a distance (5.0 m), near the point of convergence, evaluation of stereoscopic acuity at 40 cm (Titmus Stereo test; Stereo Optical Co., Inc., Chicago, IL, USA), assessment of heterophoria using the alternating cover test at near (33 cm), and far (5.0 m) distance assessments, and examinations of the fundus. Stereoacuity was converted to the logarithm of the arcsec (log arcsec).
Participants in this study were enrolled between May 1, 2023, and September 31, 2023. After explaining the nature of the study and possible complications, all subjects provided informed consent. This study adhered to the Declaration of Helsinki of the World Medical Association. The Institutional Review Board of Teikyo University approved the experimental protocol and consent procedures (approval no. 19–224-3).
Binocular Fusion Maintenance
BFM can be assessed by reducing the intensity of the incident light on one eye, which is defined by the number of photons, because the perceptive size of the retinal image depends on the intensity of the incident light.24
In this study, we used a custom-made system to measure the BFM (Figure 1 and Video S1). This system consisted of spectacle-type video-oculography (VOG) (Pupil Core, Pupil Labs, Berlin, Germany), a liquid crystal shutter (LCS) (Large Liquid Crystal Light Valve - Controllable Shutter Glass, Adafruit, New York, NY, USA), and a starburst target at 33 cm. The LCS could arbitrarily change the transmittance from 0.7% to 34.1% relative to the voltage sent from the microcomputer (Arduino Uno, Arduino, Turin, Italy).
 |
Figure 1 BFM system. The BFM system included a VOG system that recorded the participant’s eye position, an LCS, an Arduino that controlled the LCS, and the fixation target. The VOG system and Arduino were connected to a personal computer and synchronized (A). The participants wearing the VOG device fixated on the target, which was placed 33 cm in front of their eyes, via the LCS (B and C). The transmittance of the LCS was set at 34.1% for 2 s and then reduced sequentially by 1.66% every second (B’ and C’). Abbreviations: BFM, binocular fusion maintenance; LCS, liquid crystal shutter; VOG, video oculography. |
The participants continued to fixate on the starburst target through the LCS, and both eye positions were recorded continuously for 34s (Movie 1). The transmittance of the LCS in the non-dominant eye, which was determined by the hole-in-the-card test, was set at 34.1% for 3s and was then reduced sequentially by 1.66% every second. Between 23 and 28s, the transmittance was maintained at 0.7%; thereafter, it increased and remained at 34.1% between 28 and 34s. The transmittance for the dominant eye was sustained at 34.1% throughout the 34s period. The BFM test evaluated the intensity of the incident light ratio in both eyes during the binocular fusion break and was conducted three times before the visual task and three times after the visual task.
The eye positions and pupil diameters in both eyes were exported to a comma-separated values file. Data were excluded when the pupil diameter changed by >2 mm between consecutive frames because of blinking, and the missing values were replaced with a linearly interpolated value calculated from an algorithm written in Python 3.11.1. The BFM analysis followed the procedure of Hirota et al.20 The BFM was calculated using the following equation:

In this study, the change in BFM was defined as the difference between the post-BFM and pre-BFM values.
Non-Invasive Tear Film Break-Up Time
Tear film instability is one of common symptoms in CVS.3,4 In this study, non-invasive tear film break-up time (NI-BUT) was measured using RT-7000 (Tomey Corp., Aichi, Japan) with a tear stability analysis system (TSAS),25 which irradiates the anterior eye using infrared light, and 15 mire rings from the blue-lighted cone were projected onto the corneal surface. The anterior eye images were captured every second for 10s. The participants were instructed to refrain from blinking as long as possible and to look at the central target during the measurement. The examiner began the measurements after blinking.
In the NI-BUT analysis, each of the 15 mire rings was decomposed into 256 individual data points, resulting in a total of 3840 measurement points (15 mire rings × 256 data points) were obtained. The TSAS compares the brightness of the mire rings with the initial brightness at 0 s. If the brightness decreased below a predefined threshold (ring breakup levels were set to 0.010 and 20.00), the computer recorded the point at which the threshold crossed the tear film BUT, ie, the NI-BUT. The NI-BUT was measured in the participants’ right eye before and once after the visual task. Participants were excluded if their NI-BUT was less than 5 s before the visual task.
In this study, the change in NI-BUT was defined as the difference between the post-NI-BUT and pre-NI-BUT values.
Visual Task
In this study, we used an iPod Touch to simulate smartphone use. The participants played Mario Kart Tour (Nintendo Co., Ltd., Kyoto, Japan) as the visual task. The participants played the game under fully corrected vision for 30 min. The visual distance between the participant’s eyes and the smartphone display was set at 20 cm using a neck strap (Figure 2), which aligns with an earlier study indicating that 20 cm is the average smartphone viewing distance in a sitting position.26
 |
Figure 2 Visual task. Participants played a smartphone game for 30 min under wearing spectacle-type VOG. The visual distance between the participant’s eye and smartphone display was set at 20 cm by using a neck strap. Abbreviation: VOG, video-oculography. |
Statistical Analysis
Differences in NI-BUT and BFM between the pre- and post-visual tasks were analyzed using the Wilcoxon signed-rank test.
The relationship between the changes in NI-BUT and BFM was evaluated using Pearson’s correlation coefficient and single linear regression analysis.
The repeatability of the BFM test was analyzed using Bland-Altman analysis.27,28 Data were randomly extracted for two of the three measurements during the pre-visual task.
SPSS version 26 (IBM Corp., Armonk, NY, USA) was used to determine the significance of the differences, and P < 0.05 was considered statistically significant.
Results
Table 1 presents the participants’ characteristics. The mean ± standard deviation of the refractive errors (spherical equivalents) of the dominant eye was −1.72 ± 3.15 D, and that of the non-dominant eye was −2.08 ± 3.11 D. The best-corrected visual acuity was 0.0 logMAR units or better in all subjects. The average heterophoria was −4.7 ± 1.9 prism diopters (PDs) at a distance and −3.6 ± 2.5 PDs up close. All healthy volunteers had a stereoacuity of 40.9 ± 2.9 log arcsec (range: 40–50 s).
 |
Table 1 Characteristics of Volunteers |
The NI-BUT (9.12 ± 1.00 s vs 5.69 ± 3.11 s) was significantly shorter in the post-visual task than in the pre-visual task (P = 0.011) (Figure 3). The BFM (pre vs post: 0.95 ± 0.09 vs 0.75 ± 0.16) was significantly lower in the post-visual task than in the pre-visual task (P = 0.012) (Figure 4).
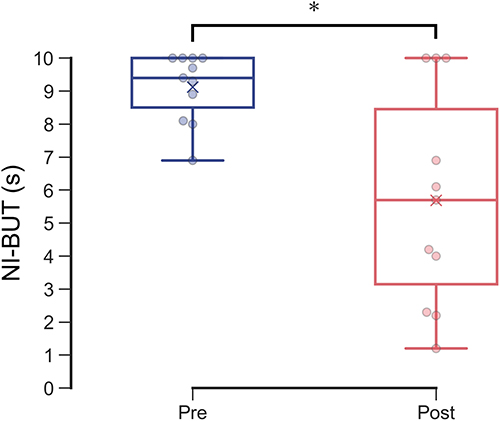 |
Figure 3 Change in NI-BUT between pre- and post-visual tasks. The blue and red box plots with dots indicate the NI-BUT in the pre- and post-visual tasks. The blue and red crosses indicate mean values. The NI-BUT score was significantly lower in the post-visual task group than in the pre-visual task group. * P = 0.011, Wilcoxon signed-rank test. Abbreviations: NI-BUT, non-invasive tear film break-up time; Pre, pre-visual task; Post, post-visual task. |
 |
Figure 4 Change in BFM between pre- and post-visual tasks. The blue and red box plots with dots indicate the BFM in the pre- and post-visual tasks. The BFM was significantly lower in the post-visual task than in the pre-visual task. * P = 0.012, Wilcoxon signed-rank test. Abbreviations: BFM, binocular fusion maintenance; Pre, pre-visual task; Post, post-visual task. |
The change in BFM (−0.20 ± 0.18) was significantly and positively correlated with the change in NI-BUT (−3.43 ± 3.19 s) (R = 0.621, R2 = 0.385, P = 0.042) (Figure 5).
 |
Figure 5 Relationship between changes in NI-BUT and BFM. The red lines indicate the regression lines. The change in BFM significantly correlated with the changes in the NI-BUT (R = 0.621, R2 = 0.385, P = 0.042). Regression line: 11.114x – 1.204. Abbreviations: BFM, binocular fusion maintenance; NI-BUT, non-invasive tear film break-up time. |
The BFM between single measurements did not significantly differ (first and second measurements, 0.961 ± 0.085; and 0.968 ± 0.079; P = 0.157, respectively). The mean value of the differences between the two measurements was −0.007 ± 0.017, and the correlation between the two measurements was not significant (R2 = 0.103, P = 0.27). The 95% limit of agreement (LoA) ranged from 0.041 to 0.027.
Discussion
In this study, we investigated the relationship between tear film stability and visual fatigue using objective method of NI-BUT and BFM. The NI-BUT and BFM were significantly lower in the post-visual task than in the pre-visual task (Figures 3 and 4). Furthermore, the change in NI-BUT was significantly and positively correlated with the change in BFM (Figure 5). These findings suggest that, even from objective measurements, there is association between tear film stability and visual fatigue.
Moreover, our findings suggest that digital device use may induce visual fatigue, subsequently leading to decreased tear film stability. While transient visual fatigue can resolve with adequate rest periods, chronic reduction in tear film stability may contribute to the development of dry eye disease.29 In such cases, patients may experience increased visual stress even in the absence of digital device viewing. This may explain why patients with dry eye disease frequently report visual fatigue during routine activities.
The temporal dynamics of tear film stability during prolonged visual tasks warrant careful consideration. Hirota et al showed that during a 60-minute visual task, participants exhibited a high frequency of incomplete blinks during the initial 30 minutes, accompanied by a decrease in tear film stability as measured using NI-BUT by TSAS.30 Our findings align with these observations, showing a significant reduction in NI-BUT following a 30-minute visual task. This consistency across studies suggests a reproducible pattern of tear film degradation during sustained visual task.
Our findings showed that BFM was significantly lower following the visual task compared to baseline measurements (Figure 4). These findings align with those reported by Hirota et al20 who examined the relationship between subjective visual fatigue, assessed through questionnaires, and objective measurements using BFM. Their investigation reported that symptoms such as blurred vision and diplopia were frequently noted during experiences of visual fatigue, and these symptoms may be associated with decreased BFM. Moreover, the repeatability of the BFM test in this study (mean: −0.007, LoA: −0.041 to 0.027) was similar to that of a previous study (mean: 0.000, LoA: −0.111 to 0.111).20 These findings suggest that the BFM test is useful in evaluating visual fatigue.
A significant positive correlation was observed between NI-BUT and BFM measurements (Figure 5). This relationship suggests a connection between tear film stability and visual function: tear film instability increases higher-order aberrations, resulting in degradation of retinal image quality.31–33 The reduction in tear film stability may cause an imbalance in retinal images between the left and right eyes, potentially increasing the load on binocular fusion and leading to decreased BFM. These changes may contribute to visual fatigue. However, the R2-value between NI-BUT and BFM was low. These results suggest that tear film instability is one of the factors that induces visual fatigue, and other factors are involved in visual fatigue, such as vergence34–36 and accommodation.37,38 Therefore, the parameter of tear film stability alone may be insufficient to model visual fatigue, and it may be necessary to evaluate tear film stability, vergence, and accommodation simultaneously.
In this study, we observed a relationship between tear film stability and visual fatigue. Although our findings enhance the hypothesis that the reduction in tear film stability leads to visual fatigue, we were unable to quantify the extent of visual fatigue specifically attributable to reduced tear film stability. Previously, Hirota et al observed an interesting phenomenon in their 60-minute protocol: after the 30-minute mark, participants showed an increase in complete blink frequency, which corresponded with a temporary improvement in tear film stability.30 While our study was limited to a 30-minute duration due to the additional time required for BFM measurements (approximately 5 minutes), future investigations examine the relationship between tear film stability and BFM at extended time points, particularly around the 45-minutes.
Conclusions
Objective measurements revealed that both NI-BUT and BFM significantly decreased after the visual task compared to baseline measurements. Moreover, we found a significant positive correlation between the changes in NI-BUT and BFM. These objective findings support the association between tear film stability and visual fatigue.
Data Sharing Statement
The data of this study have been uploaded to zenodo (doi: 10.5281/zenodo.10039342) after removing personal information, and are available to anyone.
Ethics Approval and Informed Consent
This study adhered to the Declaration of Helsinki of the World Medical Association. The Institutional Review Board of Teikyo University approved the experimental protocol and consent procedures (approval no. 19–224-3).
Acknowledgments
We would like to thank Editage (www.editage.jp) for English language editing. This paper is available as a preprint on Research Square at: https://www.researchsquare.com/article/rs-3718154/v1.
Author Contributions
All authors made significant contributions to the work reported, in the conception, study design, execution, acquisition of data, analysis and interpretation. They drafted, revised and critically reviewed the article; approved the version to be published; agreed on the journal to which the article has been submitted; and agreed to be accountable for all aspects of the work.
Funding
This work was supported by Early-Career Scientists, Scientific Research (A) and (B), Japan Society for the Promotion of Science (22K18231 [M.H.], 22H00539 [M.H.], 20K04271 [M.H.]); Nakatani Foundation (M.H.); Inamori Foundation (M.H.); Japan Medical Herb Association Research Grant Program (M.H.); Terumo Life Science Foundation (22-III 1009 [M.H.]); Intensive Support for Young Promising Researchers, Japan Agency for Medical Research and Development (23he0422031j0001 [M.H.]); The Science Research Promotion Fund, The Promotion and Mutual Aid Corporation for Private Schools of Japan (M.H.); Bayer Retina Award (M.H.); and Takeda Science Foundation (M.H.).
Disclosure
M.H. reports patents WO2017159225 and US10959615 licensed to Topcon Corp. The authors report no other conflicts of interest in this work.
References
1. Blehm C, Vishnu S, Khattak A, Mitra S, Yee RW. Computer vision syndrome: a review. Surv Ophthalmol. 2005;50(3):253–262. doi:10.1016/j.survophthal.2005.02.008
2. Sheppard AL, Wolffsohn JS. Digital eye strain: prevalence, measurement and amelioration. BMJ Open Ophthalmol. 2018;3(1):e000146. doi:10.1136/bmjophth-2018-000146
3. American Optometric Association. Computer vision syndrome (Digital eye strain). 2023. Available from: https://www.aoa.org/healthy-eyes/eye-and-vision-conditions/computer-vision-syndrome?sso=y.
4. Sheedy J, Bergstrom N. Performance and comfort on near-eye computer displays. Optom Vis Sci. 2002;79(5):306–312. doi:10.1097/00006324-200205000-00010
5. Anbesu EW, Lema AK. Prevalence of computer vision syndrome: a systematic review and meta-analysis. Sci Rep. 2023;13(1). doi:10.1038/s41598-023-28750-6
6. Statista. Internet penetration rate in Japan from 2000 to 2020. ministry of internal affairs and communications (Japan). Available from: https://www.statista.com/statistics/255857/internet-penetration-in-japan/.
7. Statista. Share of people aged 17 to 19 years old who use social media platforms in Japan as of June 2020. The Nippon Foundation. Available from: https://www.statista.com/statistics/1154797/japan-penetration-rate-of-social-media-among-young-people/.
8. Statista. Penetration rate of social media in China from 2016 to 2022. we are social; datareportal; meltwater. Available from: https://www.statista.com/statistics/234991/penetration-rate-of-social-media-in-china/.
9. CHILDWISEMonitor. Childhood 2020: new independent report. Available from: http://www.childwise.co.uk/uploads/3/1/6/5/31656353/childwise_press_release_-_monitor_2020_-_immediate_release.pdf.
10. Statista. Social network user penetration in Germany from 2018 to 2027. Available from: https://www.statista.com/statistics/567322/predicted-social-network-user-penetration-rate-in-germany/.
11. Wang J, Li M, Zhu D, Cao Y. Smartphone overuse and visual impairment in children and young adults: systematic review and meta-analysis. J Med Internet Res. 2020;22(12):e21923. doi:10.2196/21923
12. Lee HS, Park SW, Heo H. Acute acquired comitant esotropia related to excessive Smartphone use. BMC Ophthalmol. 2016;16(1). doi:10.1186/s12886-016-0213-5
13. Akib MN, Pirade SR, Syawal SR, Fauzan MM, Eka H, Seweng A. Association between prolonged use of smartphone and the incidence of dry eye among junior high school students. Clin Epidemiol Global Health. 2021;11:100761. doi:10.1016/j.cegh.2021.100761
14. Park Y-H, An C-M, Moon S-J. Effects of visual fatigue caused by smartphones on balance function in healthy adults. J Phys Ther Sci. 2017;29(2):221–223. doi:10.1589/jpts.29.221
15. Wang J, Zeng P, Deng X-W, et al. Eye habits affect the prevalence of asthenopia in patients with myopia. Journal of Ophthalmology. 2022;2022:1–7. doi:10.1155/2022/8669217
16. Ayaki M, Kuze M, Negishi K. Association of eye strain with dry eye and retinal thickness. PLoS One. 2023;18(10):e0293320. doi:10.1371/journal.pone.0293320
17. Toda I, Fujishima H, Tsubota K. Ocular fatigue is the major symptom of dry eye. Acta Ophthalmol. 1993;71(3):347–352. doi:10.1111/j.1755-3768.1993.tb07146.x
18. Sheard C. Zones of ocular comfort. Optom Vis Sci. 1930;7(1):9–25. doi:10.1097/00006324-193001000-00001
19. Kim J, Kane D, Banks MS. The rate of change of vergence-accommodation conflict affects visual discomfort. Vision Res. 2014;105:159–165. doi:10.1016/j.visres.2014.10.021
20. Hirota M, Morimoto T, Kanda H, et al. Objective evaluation of visual fatigue using binocular fusion maintenance. Transl Vis Sci Technol. 2018;7(2):9. doi:10.1167/tvst.7.2.9
21. Hirota M, Kanda H, Endo T, et al. Comparison of visual fatigue caused by head-mounted display for virtual reality and two-dimensional display using objective and subjective evaluation. Ergonomics. 2019;62(6):759–766. doi:10.1080/00140139.2019.1582805
22. Hirota M, Yada K, Morimoto T, et al. Objective evaluation of visual fatigue in patients with intermittent exotropia. PLoS One. 2020;15(3):e0230788. doi:10.1371/journal.pone.0230788
23. Morimoto T, Hirota M, Sasaki K, et al. Light-Field Visual System for the Remote Robot Operation Interface. 2023 IEEE/RSJ International Conference on Intelligent Robots and Systems (IROS). 2023;7020–7025.
24. Weale RA. Retinal irradiation and aniseikonia. Br J Ophthalmol. 1954;38(4):248–249. doi:10.1136/bjo.38.4.248
25. Kojima T, Ishida R, Dogru M, et al. A new noninvasive tear stability analysis system for the assessment of dry eyes. Invest Ophthalmol Vis Sci. 2004;45(5):1369–1374. doi:10.1167/iovs.03-0712
26. Yoshimura M, Kitazawa M, Maeda Y, Mimura M, Tsubota K, Kishimoto T. Smartphone viewing distance and sleep: an experimental study utilizing motion capture technology. Nat Sci Sleep. 2017;9:59–65. doi:10.2147/NSS.S123319
27. Bland JM, Altman DG. Measuring agreement in method comparison studies. Stat Methods Med Res. 1999;8(2):135–160. doi:10.1177/096228029900800204
28. Altman DG, Bland JM. Measurement in medicine - the analysis of method comparison studies. Statistician. 1983;32(3):307–317. doi:10.2307/2987937
29. Chidi-Egboka NC, Jalbert I, Golebiowski B. Smartphone gaming induces dry eye symptoms and reduces blinking in school-aged children. Eye. 2023;37(7):1342–1349. doi:10.1038/s41433-022-02122-2
30. Hirota M, Uozato H, Kawamorita T, Shibata Y, Yamamoto S. Effect of incomplete blinking on tear film stability. Optom Vis Sci. 2013;90(7):650–657. doi:10.1097/OPX.0b013e31829962ec
31. Koh S, Maeda N, Hirohara Y, et al. Serial measurements of higher-order aberrations after blinking in patients with dry eye. Invest Ophthalmol Vis Sci. 2008;49(1):133–138. doi:10.1167/iovs.07-0762
32. Rhee J, Chan TCY, Chow SSW, et al. A systematic review on the association between tear film metrics and higher order aberrations in dry eye disease and treatment. Ophthalmol Ther. 2022;11(1):35–67. doi:10.1007/s40123-021-00419-1
33. Koh S, Maeda N, Kuroda T, Hori Y, et al. Effect of tear film break-up on higher-order aberrations measured with wavefront sensor. Am J Ophthalmol. 2002;134(1):115–117. doi:10.1016/S0002-9394(02)01430-7
34. Berens C, Hardy le GH, Pierce HF. Studies in ocular fatigue. II. convergence fatigue in practice. Trans Am Ophthalmol Soc. 1926;24:262–287.
35. Rosenfield M. Computer vision syndrome: a review of ocular causes and potential treatments. Ophthalmic Physiol Opt. 2011;31(5):502–515. doi:10.1111/j.1475-1313.2011.00834.x
36. Sedaghat MR, Abrishami M. Comparison of amplitudes of fusional vergence in patients with asthenopic and asymptomatic near exophoria. Iran J Ophthalmol. 2014;26(4):199–202.
37. Maeda F, Tabuchi A, Kani K, Kawamoto K, Yoneda T, Yamashita T. Influence of three-dimensional image viewing on visual function. Jpn J Ophthalmol. 2011;55(3):175–182. doi:10.1007/s10384-011-0011-9
38. Jeng WD, Ouyang Y, Huang TW, et al. Research of accommodative microfluctuations caused by visual fatigue based on liquid crystal and laser displays. Appl Opt. 2014;53(29):H76–84. doi:10.1364/AO.53.000H76
 © 2025 The Author(s). This work is published and licensed by Dove Medical Press Limited. The
full terms of this license are available at https://www.dovepress.com/terms.php
and incorporate the Creative Commons Attribution
- Non Commercial (unported, 4.0) License.
By accessing the work you hereby accept the Terms. Non-commercial uses of the work are permitted
without any further permission from Dove Medical Press Limited, provided the work is properly
attributed. For permission for commercial use of this work, please see paragraphs 4.2 and 5 of our Terms.
© 2025 The Author(s). This work is published and licensed by Dove Medical Press Limited. The
full terms of this license are available at https://www.dovepress.com/terms.php
and incorporate the Creative Commons Attribution
- Non Commercial (unported, 4.0) License.
By accessing the work you hereby accept the Terms. Non-commercial uses of the work are permitted
without any further permission from Dove Medical Press Limited, provided the work is properly
attributed. For permission for commercial use of this work, please see paragraphs 4.2 and 5 of our Terms.