")
Back to Journals » Clinical and Experimental Gastroenterology » Volume 17
Predicting Survival Among Colorectal Cancer Patients: Development and Validation of Polygenic Survival Score
Authors Maawadh RM , Xu C, Ahmed R, Mushtaq N
Received 27 March 2024
Accepted for publication 4 October 2024
Published 14 October 2024 Volume 2024:17 Pages 317—329
DOI https://doi.org/10.2147/CEG.S464324
Checked for plagiarism Yes
Review by Single anonymous peer review
Peer reviewer comments 2
Editor who approved publication: Professor Andreas M. Kaiser
Rawan M Maawadh,1 Chao Xu,2 Rizwan Ahmed,3 Nasir Mushtaq2,4
1Clinical Laboratory Science Department, Prince Sultan Military College of Health Science, Dammam, Saudi Arabia; 2Department of Biostatistics and Epidemiology, University of Oklahoma Health Sciences Center, Oklahoma City, OK, USA; 3Department of General Medicine, Federal Government Polyclinic Hospital, Islamabad, Pakistan; 4Department of Family and Community Medicine, OU-TU School of Community Medicine, University of Oklahoma, Tulsa, OK, USA
Correspondence: Rawan M Maawadh, Clinical Laboratory Science Department, Prince Sultan Military College of Health Science, P.O. Box 33048, Dammam, 31448, Saudi Arabia, Email [email protected]
Purpose: Colorectal cancer is the second leading cause of cancer-related death in the United States. A multi-omics approach has contributed in identifying various cancer-specific mutations, epigenetic alterations, and cells response to chemotherapy. This study aimed to determine the factors associated with colorectal cancer survival and develop and validate a polygenic survival scoring system (PSS) using a multi-omics approach.
Patients and Methods: Data were obtained from the Cancer Genome Atlas (TCGA). Colon Adenocarcinoma (TCGA-COAD) data were used to develop a survival prediction model and PSS, whereas rectal adenocarcinoma (TCGA-READ) data were used to validate the PSS. Cox proportional hazards regression analysis was conducted to examine the association between the demographic characteristics, clinical variables, and mRNA gene expression.
Results: Overall accuracy of PSS was also evaluated. The median overall survival for TCGA-COAD patients was 7 years and for TCGA-READ patients was 5 years. The multivariate Cox proportional hazards model identified age, cancer stage, and expression of nine genes as predictors of colon cancer survival. Based on the median PSS of 0.38, 48% of TCGA-COAD patients had high mortality risk. Patients in the low risk group had significantly higher 5-year survival rates than those in the high group (p < 0.0001). The PSS demonstrated a high overall accuracy in predicting colorectal cancer survival.
Conclusion: This study integrated clinical and transcriptome data to identify survival predictors in patients with colorectal cancer. PSS is an accurate and valid measure for estimating colorectal cancer survival. Thus, it can serve as an important tool for future colorectal cancer research.
Keywords: epidemiology, cancer, prediction, survival, gene expression
Introduction
Colorectal cancer is the third leading type of cancer and second leading cause of cancer-related deaths worldwide. According to the World Health Organization (WHO), the worldwide age-adjusted incidence rate of colorectal cancer was 19.5 per 100,000, and the age-adjusted mortality rate of colorectal cancer was 9.0 per 100,000 in 2020.1 Although a decline in the incidence and mortality of colorectal cancer has been observed in the United States since the mid-1980s, it is still the fourth leading type of cancer.2 With an annual age-adjusted incidence of 36.3 per 100,000 and age-adjusted mortality of 12.8 per 100,000, colorectal cancer accounts for 8% of all new cancer cases and 8.7% of all cancer-related deaths in the United States.3 The 5-year relative survival rate for colorectal cancer patients in the United States is 63.7%.4 Despite the overall decline in the colorectal cancer incidence and mortality, the colorectal cancer incidence among people younger than 50 years has increased every year by 2% from 2012 to 2016, and mortality among patients younger than 55 years has increased by 1% per year from 2008 to2017.3
Various modifiable and non-modifiable risk factors increase the risk of colorectal cancer development. Modifiable risk factors include behavioral factors such as overweight or obesity, physical inactivity, certain types of diets, smoking, and heavy alcohol use.5,6 On the other hand, non-modifiable risk factors include, older age, past history or family history of colorectal polyps or colorectal cancer, history of inflammatory bowel disease, some inherited syndromes, and type 2 diabetes.6 In addition to these risk factors, recent studies have identified the roles of several genetic factors in the etiology and prognosis of colorectal cancer.
Genetic expression is an essential factor for studying colorectal cancer.7 Previous studies have identified more than 300 genes associated with colorectal cancer.8–11 In addition to acquired gene mutations, certain types of colorectal cancer are associated with inherited gene mutations. Familial adenomatous polyposis (FAP) and hereditary nonpolyposis colorectal cancer (HNPCC), also known as Lynch syndrome, are the two most common inherited conditions that increase the risk of colon cancer. FAP syndrome is associated with inherited gene mutation in APC gene.12 Lynch syndrome is caused by inherited gene mutations in MSH2, MSH6, PMS2, and MLH1 genes.11 Peutz-Jeghers syndrome, another inherited condition caused by a mutation in the STK11 gene, is also associated with colorectal cancer.11 FAP patients inevitably develop colorectal cancer, as 95% of them develop adenomas by 35 years of age.13 Similarly, individuals with Lynch syndrome have cumulative lifetime risk of 78% for colorectal cancer.14
The genomic profiling of cancers has a significant impact on cancer treatment, cancer risk prediction, and risk reduction. Recent studies have used gene expression to predict cancer survival and have developed several survival prediction models to estimate the survival of patients with different types of cancer.15 The multi-omics approach has contributed to the identification of various cancer-specific mutations, epigenetic alterations, and cellular responses to chemotherapy.16 It provides a comprehensive understanding of the disease by studying the molecular intricacies at multiple levels. These levels –omics – include the genome, transcriptome, metabolome, proteome, exome, and the microbiome.17 Using a multi-omics approach aids in determining genomic alterations that are specific to different types of cancers.18 Additionally, there is evidence that microRNAs (miRNAs) play vital roles in the carcinogenesis and development of colorectal cancer.19 Therefore, miRNA biomarkers play an important role in early diagnosis, treatment, recurrence, and survival prediction of colorectal cancer.20
Previous research has examined the overall burden of colorectal cancer by estimating its prevalence, incidence, and mortality in different populations. Recent studies have identified variations at the molecular level, including genetic factors, associated with colorectal cancer.21 However, there is a paucity of studies using gene expression data to evaluate the prognosis of colorectal cancer. Furthermore, survival prediction models based on multiple factors, including gene expression, have not been studied in patients with colorectal cancer. Polygenic risk score analysis is an important approach to assess the risk of cancer at any time in life and to easily identify individuals who are at high risk of cancer-related morbidity and mortality.22,23 This study aimed to examine the effects of various factors on colorectal cancer survival, as well as, determine different factors including genetic variations that predict colorectal cancer survival and to develop a polygenic survival scoring system for colorectal cancer. The Cancer Genome Atlas (TCGA) data were analyzed to identify the genetic, clinical, and demographic predictors of colorectal cancer survival. Based on the identified predictors, a survival prediction model and polygenic survival score were developed and validated.
Material and Methods
Data
Data for this study were obtained from the Cancer Genome Atlas data portal (TCGA), known as the Web Portal for Genomic Data Commons (GDC), and the National Cancer Institute Genomic Data Commons.24 TCGA provides a comprehensive profiling of more than 30 cancers, including clinical and genomic data. Two datasets were obtained from TCGA: The Cancer Genome Atlas Colon Adenocarcinoma (TCGA-COAD) and the Cancer Genome Atlas Rectum Adenocarcinoma (TCGA-READ). Each TCGA-COAD and TCGA-READ dataset contained approximately 500 specimens.25–27 In this study, we used clinical data and genomic measurements, specifically mRNA expression.
Study Design and Sample Size
This cohort study included 459 patients from the TCGA-COAD dataset, which was used to identify the predictors of overall survival among colorectal cancer patients, develop a survival prediction model, and develop a polygenic survival scoring system. A total of 170 patients from the TCGA-READ dataset were used to validate the survival prediction model and the polygenic survival scoring system.
Study Variables
Overall Survival
The primary outcome of interest was the overall survival (OS) of patients with colorectal cancer. This was defined as the time interval in years from the date of cancer diagnosis to the date of death. Accordingly, patients who did not experience the event (ie, death) were censored on the date of their last known contact.
Demographic Variables
Information related to the patient age, sex, and race was also included. Age was used as a categorical variable and dichotomized into less than 65 and ≥ 65 years. Due to the small sample size of some racial groups, we categorized race into three groups: White, Black, and Others.
Clinical Variables
Clinical characteristics, such as pathological tumor stage and histological type, were included. The stages were classified into four groups: Stage I contained I and IA; Stage II contained IIA, IIB, and IIC; Stage III contained III, IIIA, IIB, and IIIC; and Stage IV, IV, IVA, and IVB.
Gene Expressions
A total of 205 genes previously associated with colorectal cancer were included in the analysis.8–11,28,29 The Database for Annotation, Visualization, and Integrated Discovery (DAVID) bioinformatics gene ID conversion tool was used to convert official gene symbols to Ensembl gene ID.30 The mRNA gene expression data were standardized with a mean of 0 and standard deviation of 1 to achieve a normal distribution.
Statistical Analysis
Descriptive statistics were calculated for all the study variables. To examine the differences between TCGA-COAD and TCGA-READ datasets, the chi-square test was used for categorical variables, whereas the Log rank test was used for follow-up time. Additionally, the median overall survival times for TCGA-COAD and TCGA-READ cohorts were calculated using the Kaplan-Meier method.
Identification of Survival Predictors and Survival Prediction Model
Univariate analyses were performed to assess the effect of each study variable, including age, sex, race, cancer stage, and 205 gene expressions on OS using Cox proportional hazards (CoxPH) models. The hazard ratio (HR) from the Cox proportional hazards model was used to measure effect size. Variables that had a significant univariate association with OS were considered for multivariate Cox proportional hazards regression analysis. For the survival prediction model, gene expression was converted to z-scores using the sample mean and standard deviation from the TCGA-COAD data. Multivariate Cox proportional hazards regression models were used to develop the survival prediction model. As a first step, variables included in the survival prediction model were determined based on stepwise selection with a significance level of 0.99 to enter the model and 0.995 to stay in the model, which resulted in a full model consisting of all potential predictors.31 Subsequently, the corrected Akaike Information Criterion (AICc) was used to identify a set of (k) top AIC-optimized models with the lowest 3 ± models to obtain more candidates and to increase robustness when including more predictors around the smallest AICc. The variables in the (k) set of models were included in the final model. The receiver’s Harrell’s C-index, also known as the concordance index, was used to evaluate the performance of the survival prediction model.32
Calculation of Polygenic Survival Score
The polygenic survival score calculation was based on the scoring procedure proposed by Fu et al to predict ovarian cancer survival.31 The regression coefficients obtained from the survival prediction model (multivariable Cox proportional hazards model) were used to calculate the polygenic survival score (PSS). The following formula summarizes the PSS calculation:
where PSSj, is the PSS for the jth patient for survival from colorectal cancer, zxi is the standardized z-score of the ith gene expression predictor, wi is the ith categorical (demographic/clinical) predictor, and βi is the corresponding regression coefficient obtained from the multivariate Cox proportional hazards model.31 The PSS is a continuous measure of colorectal cancer survival, with a lower score predicting longer survival.31 The overall accuracy of the PSS in predicting survival was examined using a Receiver Operating Characteristic (ROC) curve. The area under the curve (AUC) and 95% confidence intervals (CI) were computed to evaluate the performance of PSS for one, three, and five-year survival among patients with colon cancer. Furthermore, the median PSS risk score was used as the threshold to classify colon cancer patients into high risk group (PSS greater than the median) and low risk group (PSS less than the median). Kaplan-Meier plot was generated for the two PSS based on risk groups. Median survival was also obtained for each risk group.
Validation of the Survival Prediction Model and Polygenic Survival Score
The TCGA-READ dataset was used to validate the survival prediction model, and PSS was developed based on TCGA-COAD. Predictors of survival among patients with colon cancer, age, stage, and the ten genes identified based on TCGA-COAD analysis were used to examine survival among patients with rectal cancer. The predictor variables were standardized by converting them to z-scores using mean and standard deviation. A multivariate Cox proportional hazards model was used to examine its association with overall survival. The performance of this survival prediction model was further assessed using the Harrell’s concordance index (CH-index). The accuracy of PSS in predicting survival among rectum cancer was evaluated by ROC analysis and AUC. The Kaplan-Meier method was used to estimate the median survival time for the PSS based on the high and low risk groups.
Data were analyzed using SAS v9.4 and R RStudio v1.12.1335 with packages including: SummarizedExperiment, DESeq2, and TCGAbiolinks. Statistical significance was set at an alpha level of 0.05.
Results
The majority of patients in both datasets were 65 years or older (62% of TCGA-COAD patients and 54% of TCGA-READ patients) and males. There was no significant difference between TCGA-COAD and TCGA-READ cohorts for age (p= 0.052), gender (p= 0.80), cancer stage (p = 0.3284), and histological type of cancer (p=0.0541). Similarly, the median overall survival among TCGA-COAD (7 years) and TCGA-READ (5 years) patients was not significantly different (p= 0.211) (Table 1 and Figure 1).
 |
Table 1 Descriptive Statistic of TCGA-COAD and TCGA-READ Patients Characteristics |
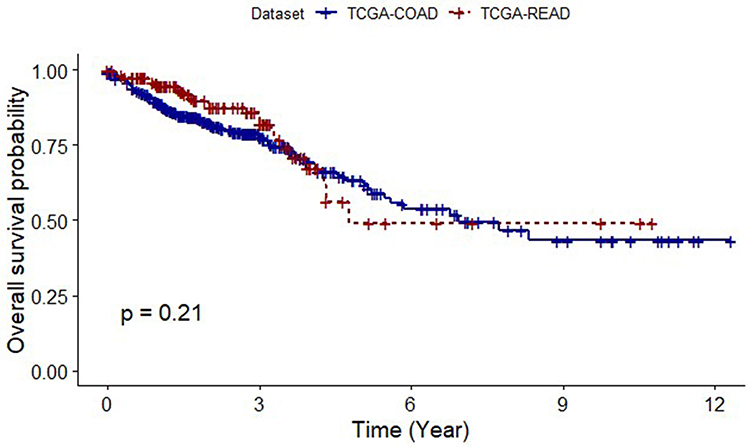 |
Figure 1 Kaplan–Meier Survival Plot For TCGA-COAD and TCGA-READ. |
Identification of Survival Predictors and Survival Prediction Model
The results of Cox proportional hazards regression analysis showed that age, cancer stage, and expression of 27 genes had a univariate association with colon cancer survival. Further analysis of these variables with a multivariable Cox proportional hazards regression model using stepwise and AICc selection methods retained age, cancer stage, KLF5, ETS2, SMAD2, TRAP1, HIGD1A, AXIN2, MMP1, TOP2A, and HSPE1 gene expression as predictors of colon cancer survival. (Table 2) The risk of death among older cancer patients was more than twice that among those aged < 65 years (HR: 2.39, 95% CI: 1.46, 3.93) when adjusted for cancer stage and 9 gene expressions. Similarly, increasing cancer stage had a significantly worsening impact on survival when adjusted for other covariates (Table 2). In terms of gene expression, except for HSPD1, the expression of all other genes reduced the risk of death in patients with colon cancer. TRAP1 expression was associated with the highest reduction in the risk of death by 37.4% (HR: 0.63, 95% CI: 0.46, 0.85), whereas TOP2A expression had the lowest reduction in the risk of death (HR: 0.86, 95% CI: 0.66, 1.12) when adjusted for other covariates.
 |
Table 2 Multivariate Cox Proportional Hazards Model for Survival Predictors of Colon Cancer (TCGA-COAD) |
Performance Evaluation of Survival Prediction Model
Predictive accuracy of the survival prediction model was assessed with the ROC analysis. The model had high predictive accuracy based on the AUC results. For year 1 the overall accuracy of the model in predicting survival was 0.75 (95% CI: 0.65, 0.84); for year 3 it was 0.81 (95% CI: 0.74–0.88), and for year 5, the AUC was 0.78 (95% CI: 0.68–0.88). Figure 2 illustrates ROC curves for the model at year 1, 3, and 5. The overall predictive performance of the final Cox proportional hazards model (CH-index) was 0.76 (95% CI: 0.70, 0.82).
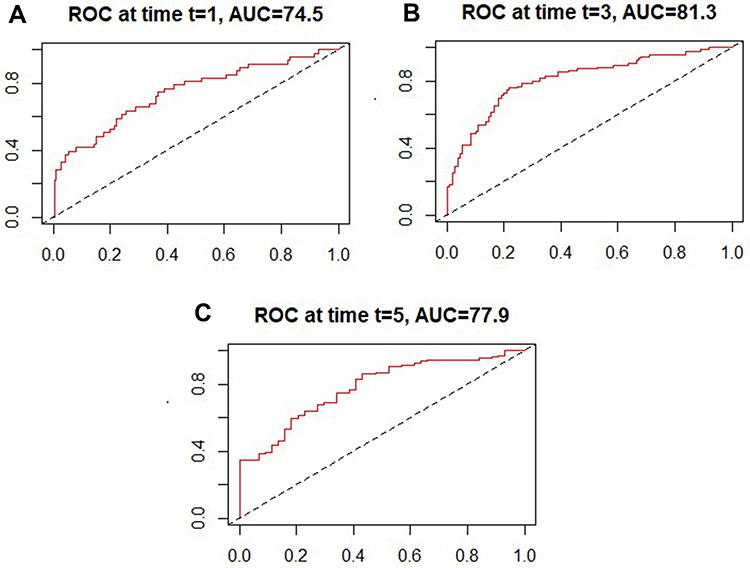 |
Figure 2 Time-dependent-Roc Curves Estimated for TCGA-COAD Patients. (A) ROC at year 1. (B) ROC at year 3. (C) ROC at year 5. |
Polygenic Survival Score
Parameter estimates (β) for the variables and the values of the corresponding variables were used to calculate the polygenetic survival score (PSS). The mean of the polygenic survival score for the colon cancer patients was 0.44 (SD= 1.13), and the median was 0.38 (min= −2.93, max= 3.84). The median survival score was used as the cutoff value to categorize patients into high and low risk groups. Those who had a polygenic survival score greater than 0.38 were categorized as the high risk group. The results of Figure 3 showed that patients in the low risk group had a significantly longer median survival time than those in the high risk group (p <0.0001). Three-year survival probability for the low risk group was 91.62%, whereas that for the high risk group was 62.71%. Similarly, the 5-year survival rate was higher in the low risk group than that in the high risk group (82.36% vs 45.16%).
 |
Figure 3 Kaplan–Meier Plot for overall survival by polygenic survival score categories among colon cancer patients (TCGA-COAD). |
External Validation
Survival Prediction Model
The predictive performance of the survival model was assessed using the data obtained from patients with rectal cancer (TCGA-READ). The results of the ROC analysis showed that, as time increased from year 1 to year 5, the AUC of the model increased. Thus, the survival prediction model became more accurate as duration increased. The accuracy of the model in predicting survival was highest for year 5 (AUC: 0.82, 95% CI: 0.63–1.00), followed by year 3 (AUC: 0.80, 95% CI: 0.67, 0.93), and year 1 (AUC: 0.75, 95% CI: 0.58, 0.92). ROC curves (Figure 4) showed high sensitivity and specificity of the model in predicting survival at different years. The overall adequacy of the prediction model assessed by CH-index was 0.80 (95% CI: 0.71, 0.88).
 |
Figure 4 Time-dependent-Roc Curves Estimated for TCGA-READ Patients. (A) ROC at year 1. (B) ROC at year 3. (C) ROC at year 5. |
Polygenic Survival Score
Parameter estimates obtained from TCGA-COAD were multiplied by the corresponding variables from TCGA-READ and the values were summed to obtain the PSS for each patient. The mean of the PSS for TCGA-READ was −0.24 (SD= 1.13) and the median was −0.40 (range: −2.64 to 3.89). The median risk score from TCGA-COAD (0.38) was used as the cutoff value to categorize patients in TCGA-READ into high and low risk groups. The median survival time was significantly higher in the low risk group than in the high risk group (p= 0.0012) (Figure 5). Three-year survival probability for the low risk group was 90%, while that for the high risk group was 84%. Similarly, the 5-year survival rate was higher in the low risk group than that in the high risk group (74% vs 11%).
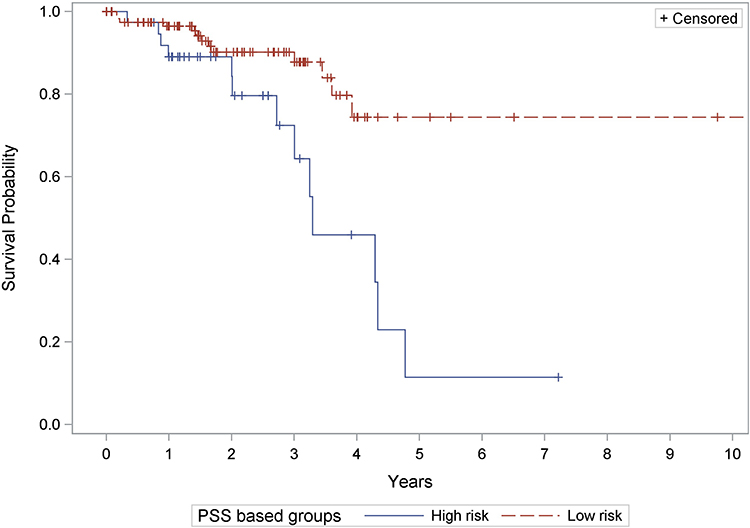 |
Figure 5 Kaplan–Meier Plot for overall survival by polygenic survival score categories among rectum cancer patients (TCGA-READ). |
Discussion
The findings from this study indicate that age and cancer stage are associated with survival in patients with colorectal cancer. The risk of death was twice as high among older patients (≥ 65 years) than that among younger patients. Recent research based on TCGA found that colorectal cancer patients aged 65 years or older had 2.61 times higher risk of death than those aged less than 65 years (95% CI: 1.59–4.28).10 Findings from the NY State Cancer Registry and Statewide Planning and Research Cooperative System cohort concluded that older patients had a higher risk of colon cancer-specific deaths (65–74 year: HR= 1.56, 95% CI: 1.26–2.00; ≥ 75 years: HR= 2.57, 95% CI: 2.29–6.05).33
The findings of the current study suggest that there is a gradient in the association between cancer stage and risk of death from colon cancer. Compared to stage I, the hazard of death was highest among stage IV patients, followed by stage III and stage II patients. Although stage I patients had significantly higher survival rates than stage III and IV patients, no significant difference was observed in stage II patients. Our results regarding Stage II survival contradict the findings of previous research studies.34–37 Other studies have shown that stage I colorectal cancer patients have a significantly better prognosis in terms of survival compared to all advanced stages, including stage II. A retrospective study of colorectal cancer patients found that stage II, III, and IV patients had significantly lower colorectal cancer survival than stage I patients: stage II (HR= 1.40, 95% CI: 1.09–1.80), stage III (HR= 2.32, 95% CI: 1.76–3.04), and stage IV (HR= 6.462, 95% CI: 4.50–9.24).36 Similarly, another retrospective study concluded that all advanced stages were associated with significantly lower survival rates than stage I.37 The differences in our findings may be attributed to the differences in patient populations between these studies.
Previous studies identified more than 200 genes as risk factors for colorectal cancer. The current study used previously identified genes to examine their roles in the survival of patients with colorectal cancer. The results showed that nine genes, KLF5, ETS2, SMAD2, TRAP1, HIGD1A, AXIN2, MMP1, TOP2A, and HSPE1, increased survival, whereas one gene, HSPD1, decreased survival among patients with colorectal cancer. Previous studies have shown that increased KLF5 expression is linked to poor prognosis in patients with colorectal cancer by promoting cancer stem cell-like properties and cell proliferation.38 A study examined the role of ETS2 in colorectal cancer and found that the expression of ETS2 in human colon cancer cell lines is linked to increased cell survival and proliferation.39
Similarly, our findings of a significant association between SMAD2, TRAP1, HIGD1A, and AXIN2 gene expression and increased survival among colorectal cancer patients are in accordance with the findings of previous studies of colorectal cancer. A previous study showed that there was a considerable difference in the overall survival of colorectal patients who demonstrated low or high expression of SMAD2/3 in normal tissues.40 Colorectal cancer patients with increased TRAP1 expression have aggressive lymph node metastasis, multidrug tolerance, and shorter overall median survival.41,42 Another study reported that HIGD1A inhibited tumor growth but facilitated tumor cell survival in vivo in different types of cancer including colorectal cancer.43 There are inconsistencies in the findings of previous studies examining the association between AXIN2 and colorectal cancer.44 A few studies have shown a protective effect of AXIN2 in colorectal cancer, whereas other studies have found a poor prognosis among colorectal patients with mutations in AXIN2 gene.44–46
Although this study found a significant role of MMP-1 in colorectal cancer survival, there are inconsistent findings regarding the effect of MMP-1 on colorectal cancer tissue from in-vitro studies.47,48 A previous study determined that MMP-1 transcription rates are associated with poorer results in colorectal cancer.47,48 However, another study indicated that high MMP-1 expression is associated with longer overall cancer tissue survival.48 The function of HSPD1 in colorectal cancers remains unknown, particularly in adenocarcinoma.49 A cohort study showed that high levels of HSPD1 protein are associated with tumorigenesis and poor prognosis in patients with colorectal cancer, suggesting that HSPD1 causes tumor metastasis.49 Recent studies have shown that TOP2A plays a major role in tumorigenesis in many malignancies, such as prostate, breast, and ovarian cancers. However, there is limited evidence regarding the role of TOP2A in colorectal cancer.50 HSPs are generally overexpressed in various tumor types. Increased expression of HSPs is usually associated with a poor prognosis and increased resistance to therapies.51 However, the association between HSPE1, TOP2A, and colorectal cancer survival rates has not yet been established.
The survival prediction model developed in this study had adequate accuracy, with an AUC ranged from 0.74 to 0.81. Although the accuracy of the model increased from year 1 to year 3 and decreased from year 3 to year 5, the difference between years was not statistically significant.
The overall accuracy of our model was adequate, as suggested by previous studies.52,53 We further validated the survival prediction model by using data from patients with rectal cancer. Both the colon and rectum form parts of the large intestine with no anatomical or physiological differences. Additionally, colon and rectal cancers are extremely similar at cellular and molecular levels. As colon and rectal cancers share significant similarities, data from patients with rectal cancer were used for external validation of the survival prediction model. The results of the external validity analysis showed a similar accuracy of the survival prediction model among rectal cancer patients to that observed for colon cancer patients.
Conclusion
The polygenic survival score (PSS) is an important measure for estimating survival based on risk factors, including changes in gene expression that impact colorectal cancer. To obtain polygenic survival scores, standardized z-scores of gene expression and parameter estimates from the survival prediction model were used. This approach ensured that the risk associated with each variable was measured on a uniform scale for all the patients. Thus, the estimation process improved the accuracy of the scoring system. In addition to evaluating PSS as a continuous measure of survival, we evaluated its accuracy by classifying patients into PSS based on low and high risk groups. We used the median PSS score as the cutoff value for this classification. The median was selected because it is a central parameter that is unaffected by extreme values. Therefore, it provides a better evaluation of PSS-based categories and their utility in clinical and research settings. Findings showed that the PSS based low risk group had a significantly higher median survival than the high risk group.
This study has several strengths. A comprehensive approach was used to include gene expression and a thorough literature search was conducted to include all possible known genes associated with colorectal cancer. The TCGA dataset, which provides information related to a wide range of genetic data, was used for this study. Therefore, the effects of more than 200 genes on colorectal cancer survival were examined. Potential confounding and effect modifications of the covariates were assessed. Another strength of this study was the validation of the survival prediction model and PSS using an external dataset. Despite its strengths, this study has several limitations. This study did not include the colorectal cancer specific mortality rates. Owing to the secondary analysis of the existing data, information about some important risk factors, such as behavioral factors, clinical characteristics, and environmental factors, was not available. Hence, the role of these important factors as potential confounders or effect modifiers has not yet been assessed. Similarly, TCGA data did not include geographic location, including the country of residence of the patients; thus, the generalizability of our findings could not be determined. The majority of patients were Caucasian, which might have introduced a selection bias and limited the generalizability of the study findings. This study did not use the staging system recommended by the American Joint Commission on Cancer. Due to the small sample size for some cancer stages, we grouped them into four broader stages. This approach addresses the issue of low statistical power at the cost of a more in-depth understanding of the effects of each cancer stage on survival.
This study is the first step towards developing a comprehensive risk scoring system that includes a wide range of genetic and other risk factors associated with survival among patients with colorectal cancer. The survival prediction model and PSS developed in this study can serve as important tools in colorectal cancer research. Furthermore, the PSS has clinical relevance as a scoring system for patients. The findings of this study will direct future research to utilize a multi-omics approach to study colorectal cancer survival.
Abbreviations
PSS, polygenic survival score; TCGA, The Cancer Genome Atlas; COAD, Colon Adenocarcinoma; READ, Rectum Adenocarcinoma; WHO, the World Health Organization; FAP, Familial adenomatous polyposis; HNPCC, hereditary nonpolyposis colorectal cancer; GDC, Genomic Data Commons; OS, overall survival; DAVID, Database for Annotation, Visualization and Integrated Discovery; CoxPH, Cox proportional hazards; HR, Hazard ratio; AICc, Akaike Information Criterion; ROC, Receiver Operating Characteristic; AUC, area under the curve; CH-index, Harrell’s concordance index; 95% CI, confidence interval; SD, standard deviation; β, Parameter estimate.
Ethical Statement
The study was conducted using publicly de-identified available data from The Cancer Genome Atlas (TCGA), which are exempt from human subjects’ research requirements and therefore do not require IRB approval.
Acknowledgment
This paper is based on the thesis of Rawan Mohammed Maawadh. It has been published on the institutional website: https://www.proquest.com/docview/2445471154?pq-origsite=gscholar&fromopenview=true&sourcetype=Dissertations%20&%20Theses.
Disclosure
The authors report no conflicts of interest in this work.
References
1. Sung H, Ferlay J, Siegel RL. et al. Global Cancer Statistics 2020: GLOBOCAN Estimates of Incidence and Mortality Worldwide for 36 Cancers in 185 Countries. CA Cancer J Clin. 2021;71(3):209–249. doi:10.3322/caac.21660
2. Islami F, Ward EM, Sung H, et al. Annual Report to the Nation on the Status of Cancer, Part 1: national Cancer Statistics. JNCI. 2021;113(12):1648–1669. doi:10.1093/jnci/djab131
3. ACS. Key Statistics for Colorectal Cancer, 2023. Available from: https://www.cancer.org/cancer/colon-rectal-cancer/about/key-statistics.html.
4. USDHHS, U.S. Cancer Statistics Working Group. U.S. Cancer Statistics Data Visualizations Tool, based on 2021 submission data (1999–2019).
5. Giovannucci E. Modifiable risk factors for colon cancer. Gastroenterol Clin North Am. 2002;31(4):925–943. doi:10.1016/s0889-8553(02)00057-2
6. ACS. Colorectal Cancer Risk Factors, 2023.
7. Evans HS, Moller H, Robinson D, Lewis CM, Bell CM, Hodgson SV. The risk of subsequent primary cancers after colorectal cancer in southeast England. Gut. 2002;50(5):647–652. doi:10.1136/gut.50.5.647
8. National Center for Biotechnology Information (US). Genes and Disease: Colon Cancer. USA: National Center for Biotechnology Information; 1998.
9. Cancer Genome Atlas N. Comprehensive molecular characterization of human colon and rectal cancer. Nature. 2012;487(7407):330–337. doi:10.1038/nature11252.
10. Kim E, Jung S, Park WS, et al. Upregulation of SLC2A3 gene and prognosis in colorectal carcinoma: analysis of TCGA data. BMC Cancer. 2019;19(1):302. doi:10.1186/s12885-019-5475-x
11. Board PDQCGE. Genetics of Colorectal Cancer (PDQ®): health Professional Version. In: PDQ Cancer Information Summaries. USA: National Cancer Institute; 2002.
12. Talseth-Palmer BA. The genetic basis of colonic adenomatous polyposis syndromes. Hered Cancer Clin Pract. 2017;15:5. doi:10.1186/s13053-017-0065-x
13. Giardiello FM, Offerhaus JG. Phenotype and cancer risk of various polyposis syndromes. Eur J Cancer. 1995;31(7–8):1085–1087. doi:10.1016/0959-8049(95)00139-a
14. Aarnio M, Mecklin JP, Aaltonen LA, Nyström-Lahti M, Järvinen HJ. Life-time risk of different cancers in hereditary non-polyposis colorectal cancer (HNPCC) syndrome. Int J Cancer. 1995;64(6):430–433. doi:10.1002/ijc.2910640613
15. Kumar L, Greiner R. Gene expression based survival prediction for cancer patients-A topic modeling approach. PLoS One. 2019;14(11):e0224446. doi:10.1371/journal.pone.0224446
16. Chakraborty S, Hosen MI, Ahmed M, Shekhar HU. Onco-Multi-OMICS Approach: a New Frontier in Cancer Research. Biomed Res Int. 2018;2018:9836256. doi:10.1155/2018/9836256
17. Subramanian I, Verma S, Kumar S, Jere A, Anamika K. Multi-omics Data Integration, Interpretation, and Its Application. Bioinform Biol Insight. 2020;14:1177932219899051. doi:10.1177/1177932219899051
18. Macaulay IC, Ponting CP, Voet T. Single-Cell Multiomics: multiple Measurements from Single Cells. Trends Genet. 2017;33(2):155–168. doi:10.1016/j.tig.2016.12.003
19. Chen B, Xia Z, Deng YN, et al. Emerging microRNA biomarkers for colorectal cancer diagnosis and prognosis. Open Biol. 2019;9(1):180212. doi:10.1098/rsob.180212
20. Shekhar HU, Chakraborty S, Mannoor K, Sarker AH. Recent Advances in Understanding the Role of Genomic and Epigenomic Factors in Noncommunicable Diseases. Biomed Res Int. 2019;2019:1649873. doi:10.1155/2019/1649873
21. Cardoso J, Boer J, Morreau H, Fodde R. Expression and genomic profiling of colorectal cancer. Biochim Biophys Acta. 2007;1775(1):103–137. doi:10.1016/j.bbcan.2006.08.004
22. Jia G, Lu Y, Wen W, et al. Evaluating the Utility of Polygenic Risk Scores in Identifying High-Risk Individuals for Eight Common Cancers. JNCI Cancer Spectrum. 2020;4(3). doi:10.1093/jncics/pkaa021
23. Lewis CM, Vassos E. Polygenic risk scores: from research tools to clinical instruments. Gen Med. 2020;12(1):44. doi:10.1186/s13073-020-00742-5
24. Liu J, Lichtenberg T, Hoadley KA, et al. An Integrated TCGA Pan-Cancer Clinical Data Resource to Drive High-Quality Survival Outcome Analytics. Cell. 2018;173(2):400–416e11. doi:10.1016/j.cell.2018.02.052
25. Hutter C, Zenklusen JC. The Cancer Genome Atlas: creating Lasting Value beyond Its Data. Cell. 2018;173(2):283–285. doi:10.1016/j.cell.2018.03.042
26. Vendt B. TCGA-COAD. The Cancer Imaging Archive (TCIA). Available from: https://wiki.cancerimagingarchive.net/display/Public/TCGA-COAD.
27. National Cancer Institute. The Cancer Genome Atlas Program. https://www.cancer.gov/about-nci/organization/ccg/research/structural-genomics/tcga.
28. Chan SK, Griffith OL, Tai IT, Jones SJ. Meta-analysis of colorectal cancer gene expression profiling studies identifies consistently reported candidate biomarkers. Cancer Epidemiol Biomarkers Prev. 2008;17(3):543–552. doi:10.1158/1055-9965.EPI-07-2615
29. National Cancer Institue. TCGA’s Study of Colorectal Carcinoma. https://www.cancer.gov/about-nci/organization/ccg/research/structural-genomics/tcga/studied-cancers/colorectal.
30. Gene ID Conversion David Bioinformatics Database. https://david.ncifcrf.gov/list.jsp.
31. Fu A, Chang HR, Zhang ZF. Integrated multiomic predictors for ovarian cancer survival. Carcinogenesis. 2018;39(7):860–868. doi:10.1093/carcin/bgy055
32. Guo C, So YC, Jang W Evaluating Predictive Accuracy of Survival Models with PROC PHREG. 2017.:
33. Aquina CT, Mohile SG, Tejani MA, et al. The impact of age on complications, survival, and cause of death following colon cancer surgery. Br J Cancer. 2017;116(3):389–397. doi:10.1038/bjc.2016.421
34. Joachim C, Macni J, Drame M, et al. Overall survival of colorectal cancer by stage at diagnosis: data from the Martinique Cancer Registry. Medicine. 2019;98(35):e16941. doi:10.1097/md.0000000000016941
35. Zare-Bandamiri M, Fararouei M, Zohourinia S, Daneshi N, Dianatinasab M. Risk Factors Predicting Colorectal Cancer Recurrence Following Initial Treatment: a 5-year Cohort Study. Asian Pac J Cancer Prev. 2017;18(9):2465–2470. doi:10.22034/apjcp.2017.18.9.2465
36. Shervani S, Lu G, Sager K, Wajima T, Wong L. Prognostic factors and hazard ratios in colorectal cancer patients over 80 years of age: a retrospective, 20-year, single institution review. J Gastrointest Oncol. 2018;9(2):254–262. doi:10.21037/jgo.2018.01.06
37. Yu Y, Carey M, Pollett W, et al. The long-term survival characteristics of a cohort of colorectal cancer patients and baseline variables associated with survival outcomes with or without time-varying effects. BMC Med. 2019;17(1):150. doi:10.1186/s12916-019-1379-5
38. Takagi Y, Sakai N, Yoshitomi H, et al. High expression of Krüppel-like factor 5 is associated with poor prognosis in patients with colorectal cancer. Cancer Sci. 2020;111(6):2078–2092. doi:10.1111/cas.14411
39. Unnikrishnan M, Yamada H, Basa JN, Guruswamy S, Rao CV. Overexpression of Ets2 in colon carcinogenesis is associated with tumor cell survival. Meeting Abst Cancer Res. 2009;69:1.
40. Yang L, Liu Z, Tan J, Dong H, Zhang X. Multispectral imaging reveals hyper active TGF-β signaling in colorectal cancer. Cancer Biol Ther. 2018;19(2):105–112. doi:10.1080/15384047.2017.1395116
41. Si T, Yang G, Qiu X, Luo Y, Liu B, Wang B. Expression of tumor necrosis factor receptor-associated protein 1 and its clinical significance in kidney cancer. Int J Clin Exp Pathol. 2015;8(10):13090–13095.
42. Costantino E, Maddalena F, Calise S, et al. TRAP1, a novel mitochondrial chaperone responsible for multi-drug resistance and protection from apoptotis in human colorectal carcinoma cells. Cancer Lett. 2009;279(1):39–46. doi:10.1016/j.canlet.2009.01.018
43. Ameri K, Jahangiri A, Rajah AM, et al. HIGD1A Regulates Oxygen Consumption, ROS Production, and AMPK Activity during Glucose Deprivation to Modulate Cell Survival and Tumor Growth. Cell Rep. 2015;10(6):891–899. doi:10.1016/j.celrep.2015.01.020
44. Li X, Li Y, Liu G, Wu W. New insights of the correlation between AXIN2 polymorphism and cancer risk and susceptibility: evidence from 72 studies. BMC Cancer. 2021;21(1):353. doi:10.1186/s12885-021-08092-0
45. Xu B, Yuan W, Shi L, et al. New insights into the association between AXIN2 148 C/T, 1365 C/T, and rs4791171 A/G variants and cancer risk. Cancer Cell Int. 2019;19(1):119. doi:10.1186/s12935-019-0840-z
46. Otero L, Lacunza E, Vasquez V, Arbelaez V, Cardier F, Gonzalez F. Variations in AXIN2 predict risk and prognosis of colorectal cancer. BDJ Open. 2019;5(1):13. doi:10.1038/s41405-019-0022-z
47. Asano T, Tada M, Cheng S, et al. Prognostic values of matrix metalloproteinase family expression in human colorectal carcinoma. J Surg Res. 2008;146(1):32–42. doi:10.1016/j.jss.2007.02.011
48. Said AH, Raufman JP, Xie G. The role of matrix metalloproteinases in colorectal cancer. Cancers. 2014;6(1):366–375. doi:10.3390/cancers6010366
49. Li G, Li M, Liang X, et al. Identifying DCN and HSPD1 as Potential Biomarkers in Colon Cancer Using 2D-LC-MS/MS Combined with iTRAQ Technology. J Cancer. 2017;8(3):479–489. doi:10.7150/jca.17192
50. Zhang R, Xu J, Zhao J, Bai JH. Proliferation and invasion of colon cancer cells are suppressed by knockdown of TOP2A. J Cell Biochem. 2018;119(9):7256–7263. doi:10.1002/jcb.26916
51. Ciocca DR, Calderwood SK. Heat shock proteins in cancer: diagnostic, prognostic, predictive, and treatment implications. Cell Stress Chaperones. 2005;10(2):86–103. doi:10.1379/csc-99r.1
52. Goshayeshi L, Hoseini B, Yousefli Z, et al. Predictive model for survival in patients with gastric cancer. Electron Physician. 2017;9(12):6035–6042. doi:10.19082/6035
53. Yang L, Takimoto T, Fujimoto J. Prognostic model for predicting overall survival in children and adolescents with rhabdomyosarcoma. BMC Cancer. 2014;14(1):654. doi:10.1186/1471-2407-14-654
 © 2024 The Author(s). This work is published and licensed by Dove Medical Press Limited. The
full terms of this license are available at https://www.dovepress.com/terms.php
and incorporate the Creative Commons Attribution
- Non Commercial (unported, 3.0) License.
By accessing the work you hereby accept the Terms. Non-commercial uses of the work are permitted
without any further permission from Dove Medical Press Limited, provided the work is properly
attributed. For permission for commercial use of this work, please see paragraphs 4.2 and 5 of our Terms.
© 2024 The Author(s). This work is published and licensed by Dove Medical Press Limited. The
full terms of this license are available at https://www.dovepress.com/terms.php
and incorporate the Creative Commons Attribution
- Non Commercial (unported, 3.0) License.
By accessing the work you hereby accept the Terms. Non-commercial uses of the work are permitted
without any further permission from Dove Medical Press Limited, provided the work is properly
attributed. For permission for commercial use of this work, please see paragraphs 4.2 and 5 of our Terms.