")
Back to Journals » Journal of Inflammation Research » Volume 17
Predictive Value of Pan-Immune Inflammation Value and Systemic Immune-Inflammation Index for Identifying Coronary Vulnerable Plaques: New Insights from Optical Coherence Tomography in Acute Coronary Syndrome Patients
Authors Ji J, Wei X, Xue B, Wan D, Wu L, Liu H
Received 27 September 2024
Accepted for publication 23 November 2024
Published 4 December 2024 Volume 2024:17 Pages 10371—10382
DOI https://doi.org/10.2147/JIR.S498292
Checked for plagiarism Yes
Review by Single anonymous peer review
Peer reviewer comments 2
Editor who approved publication: Professor Ning Quan
Jinrui Ji,1,2,* Xiaoyun Wei,1,2,* Bin Xue,1,2,* Dongyu Wan,1,2,* Lei Wu,1,2,* Hengliang Liu1,2,*
1Clinical Medical Department, Faculty of Medicine, Henan University of Traditional Chinese Medicine, Zhengzhou, 450000, People’s Republic of China; 2Department of Cardiology, People’s Hospital of Henan University of Traditional Chinese Medicine, Zhengzhou, 450000, People’s Republic of China
*These authors contributed equally to this work
Correspondence: Hengliang Liu, People’s Hospital of Henan University of Traditional Chinese Medicine, No. 33, Huanghe Road, Jinshui District, Zhengzhou, Henan Province, 450000, People’s Republic of China, Tel +86 15713663081, Fax +0371-67077158, Email [email protected]
Purpose: The predictive value of PIV and SII in identifying vulnerable plaques among ACS patients remains poorly understood. This study represents the inaugural use of OCT to identify vulnerable plaques and establishes a predictive model incorporating PIV and SII, enhancing clinical treatment strategies.
Methods: A total of 523 eligible ACS patients underwent coronary angiography and OCT. Clinical data were collected and analyzed. Multifactorial logistic regression was employed to identify factors influencing TCFA. Receiver operating characteristic (ROC) curves were constructed to assess the diagnostic accuracy of the PIV and SII for TCFA, with a calculation of the area under the ROC curve (AUC). The optimal cutoff values for PVI and SII were calculated.
Results: Compared to the non-TCFA group, the TCFA group exhibited significantly higher levels of hypersensitive C-reactive protein (hs-CRP), PIV, and SII (all P < 0.05). Multifactorial logistic regression analysis revealed that PIV (odds ratio [OR], 1.78; 95% confidence interval [CI], 1.35– 2.06; P < 0.001) and SII (OR, 1.52; 95% CI, 1.14– 2.08; P < 0.001) were independent risk factors for TCFA development. The optimal cutoff value for PIV was 490.7, achieving a diagnostic sensitivity and specificity of 75.44% and 89.32%, respectively. For SII, the optimal cutoff value was 802.9, with a diagnostic sensitivity and specificity of 67.54% and 79.61%, respectively.
Conclusion: This study suggests that PIV and SII can serve as noninvasive, practical, and cost-effective biomarkers for evaluating plaque vulnerability in patients with ACS.
Keywords: pan-immune-inflammation value, systemic immune-inflammation index, vulnerable plaques, acute coronary syndrome, optical coherence tomography
Introduction
Advances in cardiac critical care and continuous improvements in clinical treatments have significantly extended the life expectancy of the population. However, ACS continues to impose substantial morbidity and mortality, posing a significant threat to human health and healthcare systems.1 Globally, >7 million people are diagnosed with ACS each year, and approximately 5% of patients with ACS succumb before hospital discharge.2 In China, cardiovascular disease affects 330 million individuals, accounting for two out of five deaths, with a concerning trend towards younger populations.3 The primary cause of ACS is the sudden occlusion of arterial lumens due to ruptured coronary atherosclerotic plaques, leading to thrombosis. The vulnerability of these plaques is a major contributing factor in most ACS cases.4 Coronary atherosclerotic plaque rupture followed by thrombosis accounts for about 70% of fatal acute myocardial infarction (MI) and sudden coronary deaths. Addressing the high morbidity and mortality associated with ACS and enhancing patient prognosis remain critical global challenges.5
The concept of vulnerable plaques primarily encompasses TCFA plaques, which are highly prone to thrombotic risk or rapid progression to becoming culprit lesions that trigger acute adverse cardiovascular events.6 Pathologically, vulnerable plaques are characterized by a FCT of <65 μm. OCT defines TCFA based on pathology as lipid plaques, where OCT images reveal a lipid core angle of ≥2 quadrants and an FCT of <65 μm.6 OCT offers superior resolution compared to intravascular ultrasound and computed tomography angiography, allowing for both qualitative and quantitative assessments of plaques,7 accurately identifying plaque components and intra-plaque microstructure. Detecting vulnerable plaques at high risk of rupture holds crucial clinical significance in preventing ACS occurrence and reducing adverse cardiovascular events in patients.
Routine blood tests, such as lymphocyte, neutrophil, monocyte, and platelet counts, are economical and swiftly employed in clinical practice. Recently, PIV8 and SII9 have emerged as composite inflammation markers that more comprehensively reflect the balance between local immune response and systemic inflammation. SII, in particular, has been shown in relevant studies to correlate closely with the severity of coronary artery disease and patient prognosis.10 However, the predictive value of PIV and SII for vulnerable plaques in patients with ACS is unclear. In this study, vulnerable plaques were identified through OCT for the first time, leading to the development of a predictive model for PIV, SII, and vulnerable plaques in ACS patients, thereby enhancing clinical treatment strategies.
Materials and Methods
Study Design and Patients
This retrospective study included 523 patients diagnosed with ACS who visited the Chest Pain Center of Henan University of Traditional Chinese Medicine People’s Hospital and underwent coronary angiography and OCT between January 2020 and January 2023 (Figure 1). A total of 217 patients were included in the study after excluding 306 individuals who met the exclusion criteria. These patients were categorized into the TCFA group (n=103) and Non-TCFA group (n=114), as well as the High PIV group (n=120) and Low PIV group (n=97), and the High SII group (n=119) and Low SII group (n=98). Grouping was determined based on fiber cap thickness, PVI cutoff value, and SII cutoff value, respectively.
 |
Figure 1 Flowchart of the study. |
The inclusion criteria were as follows: (1) compliance with the 2023 European Society of Cardiology Guidelines for the Management of ACS;11 (2) age ≥18 years; (3) time from symptom onset to admission <12 hours.
The exclusion criteria were as follows: (1) time from symptom onset to admission ≥12 hours; (2) concurrent renal insufficiency, hematological disease, or malignant tumor; (3) active inflammatory disease; (4) incomplete OCT imaging data (poor image clarity or insufficient length of the main branch vessel image <50 mm); and (5) death during hospitalization.
Data Collection
Upon admission, clinical baseline data of patients were collected, encompassing age, gender, body mass index (BMI), and history of hypertension, diabetes mellitus, hyperlipidemia, cerebrovascular disease, smoking, preoperative systolic and diastolic blood pressure, type of ACS (unstable angina pectoris, ST-segment elevation MI, and non-ST-segment elevation MI), post-percutaneous coronary intervention (PCI), previous MI, and cardiovascular medications. Biochemical assays included hs-CRP and fibrinogen, analyzed via latex immunoturbidimetric assay (Beijing Sainuopu Biotechnology Co., Ltd., Beijing, China); and hemoglobin, neutrophils, lymphocytes, monocytes, and platelet counts were determined using an automated hematology analyzer (NIHON KOHDEN CORP., Tokyo, Japan).
Patients fasted for 12 hours before blood collection, with samples drawn from the median cubital vein. Biochemical assays included total cholesterol (TC), triglycerides (TG), high-density lipoprotein cholesterol (HDL-C) and low-density lipoprotein cholesterol (LDL-C), analyzed via latex immunoturbidimetric assay (Beijing Sainuopu Biotechnology Co., Ltd., Beijing, China); serum creatinine was measured using the creatinine oxidase assay (Shanghai ELISA Biotechnology Co., Ltd., Shanghai, China).
Hypertension was defined as systolic blood pressure ≥140 mmHg or diastolic blood pressure ≥90 mmHg, with concurrent antihypertensive medication.12 Diabetes was characterized by random blood glucose ≥11.1 mmol/L or fasting blood glucose (FBG) ≥7.0 mmol/L and two-hour postprandial blood glucose ≥11.1 mmol/L.13 Smoking history was defined as smoking >1 cigarette per day for over one year. Hyperlipidemia was defined as TC >5.20 mmol/L, TG >1.70, and LDL-C >3.36 mmol/L.14 PIV was calculated as follows: PIV = neutrophil count (×109/L)/lymphocyte count (×109/L) × platelet count (×109/L) × monocyte count (×109/L).15
SII was calculated as follows: SII = neutrophil count (×109/L)/lymphocyte count (×109/L) × platelet count (×109/L).16
OCT Image Acquisition and Analysis Methods
At the end of coronary angiography, all patients underwent OCT scanning of the coronary vessels using an Abbott OCT system (Abbott Laboratories, Chicago, USA). OCT images underwent independent analysis by two blinded cardiologists utilizing the LightLab Imaging System (Light Lab Imaging, Inc., Westford, USA). The analysis adhered to plaque measurement criteria, independent of angiographic findings and laboratory parameters. Patients with unclear OCT images or main branch vessel images <50 mm in length were excluded.
OCT was used to document the presence or absence of vulnerable, fibrous, lipid, and calcified plaques, as well as macrophage infiltration, microchannels, cholesterol crystals, plaque rupture and erosion, and thrombus, and the imaging characteristics of lipid plaques.17–20 Lipid plaques were defined as areas of fuzzy edges, high back reflection, and strong attenuation, with each plaque separated by a distance of ≥5 mm from each other or from stent edges. After identifying the lipid plaques, their length was measured using the system’s measurement tool, and the lipid arc was measured at 1 mm intervals. The FCT of lipid plaques was measured three times at the thinnest part of the fibrous cap, and the average value was recorded as the FCT of the plaque. The FCT, lipid plaque length, maximum lipid arc, and lipid index (defined as the mean lipid arc multiplied by the lipid plaque length) were recorded.
TCFA was defined as a lipid plaque with an FCT of ≤65 μm and a lipid core >2 quadrants.6 Macrophage infiltration was identified as highly reflective, strongly attenuated punctate or striated structures, often forming radial shadows behind punctate areas of high signal. Fibrous plaques were defined as homogeneous, high-signal, and weakly attenuated areas. Calcified plaques were defined as low-signal or inhomogeneous areas with sharp edges. Microchannels were defined as cavity-like structures 50–300 μm in diameter with low signal and sharp edges, observable in at least three consecutive cross-sections. Cholesterol crystals were defined as thin, linear areas of high signal intensity and low attenuation. Plaque rupture was defined as a continuous interruption of the plaque fibrous cap with cavity formation. Plaque erosion was defined as an intact but broken fibrous cap with thrombus formation and a recognizable subthrombotic plaque. A thrombus was defined as an irregular mass with a minimum diameter of >250 μm attached to the vessel wall or floating in the lumen.
Statistical Analysis
Data analysis was performed using IBM SPSS Statistics for Windows (version 26.0; IBM Corp., Armonk, NY, USA) and GraphPad Prism 6 statistical software. Normally distributed data were presented as mean ± standard deviation, and the independent sample t-test was used for comparisons between two groups. Non-normally distributed data were expressed as median (M) and interquartile range (P25–P75), with the Mann–Whitney U-test employed for between-group comparisons. Categorical variables were expressed as numbers (percentages), and between-group comparisons were conducted using the chi-square test. Multifactorial logistic regression analysis was used to identify predictors of TCFA. ROC curves were constructed to assess the diagnostic accuracy of PIV and SII in predicting TCFA. Linear regression analysis was employed to evaluate the correlation between PIV, SII values, and FCT. Missing data, comprising up to 20% of the total, were addressed through multiple interpolation techniques. The statistical significance was defined as P <0.05.
Results
Comparison of Baseline Data Between TCFA and Non-TCFA Groups
Compared with the non-TCFA group, the TCFA group had a higher proportion of hypertension and smoking history, and the differences were statistically significant (all P< 0.05). There was no statistically significant difference between the TCFA group and the non-TCFA group in terms of age, gender, BMI, diabetes, hyperlipidemia, cerebrovascular disease, preoperative systolic blood pressure, preoperative diastolic blood pressure, types of ACS, prior PCI and previous myocardial infarction (all P > 0.05, Table 1).
 |
Table 1 Comparison of Clinical Baseline Data Between TCFA Group and Non-TCFA Group |
Comparison of Preoperative Laboratory Tests Between TCFA and Non-TCFA Groups
Compared with the non-TCFA group, the hs-CRP, PIV, and SII levels were higher in the TCFA group, and the differences were statistically significant (all P<0.05). The differences between the two groups in TC, TG, HDL-C, LDL-C, Serum creatinine, fibrinogen, hemoglobin, neutrophils, monocytes, lymphocytes, and platelet counts were not statistical significance (all P>0.05, Table 2).
 |
Table 2 Comparison of Preoperative Laboratory Tests Between TCFA and Non-TCFA Groups |
Comparison of Coronary Angiographic Findings Between TCFA and Non-TCFA Groups
Comparison of the TCFA and non-TCFA groups regarding the number of coronary lesion branches and lesion characteristics showed no statistically significant differences (all P >0.05, Table 3).
 |
Table 3 Comparison of Coronary Angiography Results Between TCFA and Non-TCFA Groups |
Multifactor Logistic Regression Analysis of TCFA Impact Factors
Variables with P<0.10 in the above univariate analysis were used as independent variables, The TCFA occurrence served as the dependent variable in binary logistic regression analyses (Table 4). Results indicated hs-CRP (OR, 0.57; 95% CI, 0.33–0.98; P = 0.044), smoking history (OR, 1.17; 95% CI, 1.03–1.34; P = 0.014), Hypertension (OR, 1.15; 95% confidence interval [CI], 1.02–1.29; P = 0.019), PIV (OR, 1.74; 95% CI, 1.49–2.03; P <0.001), and SII (OR, 1.62; 95% CI, 1.10–1.98; P <0.001) as significant risk factors for developing TCFA. Upon adjusting for Serum creatinine, TG, hs-CRP, Smoking history and hypertension, the analysis revealed that PIV (OR, 1.78; 95% CI, 1.35–2.06; P <0.001) and SII (OR, 1.52; 95% CI, 1.14–2.08; P <0.001) remained independently associated with increased risk of TCFA occurrence (Figures 2 and 3).
 |
Table 4 Variable Assignment Table |
 |
Figure 2 Multivariate logistic regression analysis. Notes: adjusting for Serum creatinine, TG, hs-CRP, Smoking history and hypertension. |
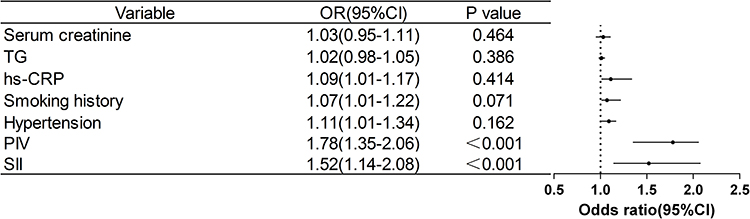 |
Figure 3 Multivariate logistic regression analysis. |
Diagnostic Value of PIV and SII Levels for TCFA
The diagnostic value of PIV and SII for identifying TCFA was assessed through an OCT-based comparison of coronary vessel and plaque characteristics between the two groups. ROC curve analysis demonstrated that PIV and SII had AUC of 0.880 (95% CI, 0.833–0.927; P <0.001) and 0.767 (95% CI, 0.704–0.830; P <0.001), respectively, for diagnosing TCFA (Figure 4). The optimal cutoff value for PIV was 490.7, achieving a diagnostic sensitivity and specificity of 75.44% and 89.32%, respectively. For SII, the optimal cutoff value was 802.9, with a diagnostic sensitivity and specificity of 67.54% and 79.61%, respectively.
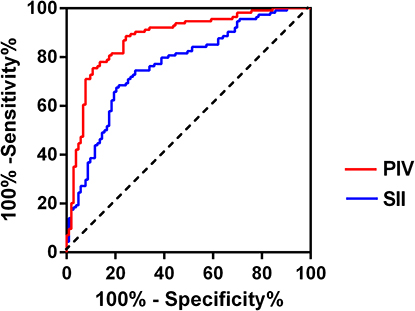 |
Figure 4 RCO curves of PIV and SII for diagnostic TCFA. |
Comparison of OCT Findings in Different Subgroups of PIV and SII
The optimal cutoff value for PIV identified patients as either belonging to the high PIV group (PIV ≥409.7; n = 120) or the low PIV group (PIV <409.7; n = 97). Similarly, based on SII, patients were categorized into the high SII group (SII ≥802.9; n = 119) and the low SII group (SII <802.9; n = 98).
In the high PIV group, vulnerable plaques, macrophage infiltration, lipid plaque length, maximum lipid plaque angle, and lipid index were significantly higher compared to the low PIV group (all P <0.05). Conversely, FCT was significantly lower in the high PIV group than in the low PIV group (P <0.05). No statistically significant differences were observed between the high and low PIV groups in terms of microchannels, calcified nodules, lipid-rich necrotic nuclei, intraplaque hemorrhage, fibrous plaques, calcified plaques, surface irregularities, plaque rupture and erosion, thrombus, OCT examination of culprit vessels, and minimum lumen area (all P >0.05; Table 5).
 |
Table 5 Comparison of OCT Findings Between the High-PIV and Low-PIV Groups |
In the high SII group, vulnerable plaques, macrophage infiltration, microchannels, lipid plaque length, maximum lipid plaque angle, and lipid index were significantly higher compared to the low SII group (all P <0.05). Furthermore, FCT was lower in the high SII group than in the low SII group (P <0.05). There were no statistically significant differences between the high and low SII groups in terms of calcified nodules, lipid-rich necrotic nuclei, intraplaque hemorrhage, fibrous plaques, calcified plaques, surface irregularity, plaque rupture and erosion, thrombus, OCT examination of culprit vessels, and minimum lumen area (all P >0.05; Table 6).
 |
Table 6 Comparison of OCT Findings Between the High-SII and Low-SII Groups |
Correlation of PIV, SII and FCT
PIV, SII and FCT were negatively correlated (r=−0. 454, p<0.001; r=−0.346, p<0.001) (Figures 5 and 6), however, there was no correlation between PIV and SII (r=0.087, p=0.380).
 |
Figure 5 Correlation analysis between PIV and FCT. |
 |
Figure 6 Correlation analysis between SII and FCT. |
Discussion
Atherosclerosis is a chronic inflammatory disease characterized by autoimmune disorders, primarily affecting large arteries.21 Inflammatory responses trigger local immune cell activation and the release of inflammatory mediators, which are directly or indirectly involved in the accumulation of extracellular matrix, smooth muscle cell proliferation, and lipid deposition in the arterial wall. Furthermore, prolonged or persistent inflammatory stimuli can increase the expression of systemic pro-inflammatory factors, thereby exacerbating cardiovascular risk.22,23
In recent years, significant advances have been made in identifying and predicting coronary plaque stability using non-invasive biomarkers. Since the observation of one or several individual inflammatory indicators can be easily influenced by factors such as the organism’s status and medications. PIV and SII, as composite indicators better reflect the organism’s inflammatory status. They are considered novel inflammatory indicators of organism that can predict the risk and prognosis of cardiovascular diseases.4,24,25 Previous studies have shown that coronary atherosclerotic plaque instability is closely related to the local inflammatory response within the plaque.26 Most cases of ACS result from coronary occlusion due to plaque rupture and subsequent thrombus formation, with inflammation and thrombus playing key roles in this process.27 Platelet activation is a critical step in the inflammatory response to coronary heart disease and cardiovascular events.28 During inflammation, several inflammatory mediators (such as interleukin [IL]-1, IL-3, and IL-6) are released, stimulating megakaryocyte proliferation and increasing platelet counts in the circulation. This thrombocytosis promotes increased platelet activation and the formation of a prothrombotic state. Conversely, lymphocytes play an important role in regulating inflammatory responses.29,30 Lymphopenia, which may result from increased lymphocyte apoptosis, is a common marker of a chronic inflammatory state and is considered a negative indicator of anti-inflammation, post-infarction myocardial healing, and remodeling.31 A prospective cohort study showed that monocytes independently predicted adverse cardiovascular events during long-term follow-up.32 Akın, Y. et al demonstrated that systemic SII parameters could serve as significant predictors of CSX disease.33
Until recently, consensus on the optimal management of coronary vulnerable plaque was lacking. Pharmacologic therapies, such as lipid-lowering and antiplatelet agents, along with intensive risk factor control, form the cornerstones of managing nonflow-restrictive vulnerable plaques. However, in patients with ACS or MI, there is an increasing incidence of recurrent ischemic events, despite these secondary prevention measures and intensive pharmacotherapy.34 Research indicates that, aside from lipid-modifying therapy, targeting inflammation is crucial to halting ACS progression. Recent large-scale clinical studies, such as the LoDoCo2 study35 has validated that anti-inflammatory therapy significantly reduces the risk of cardiovascular death. This suggests that anti-inflammatory therapy could serve as a viable option for secondary prevention of cardiovascular disease following ACS,36 providing a robust evidence-based foundation for the theory of atherosclerotic inflammation.
Inflammatory response significantly influences the progression of vulnerable plaques. Activated inflammatory cells, recruited into atherosclerosis (As) plaques by factors such as adhesion molecules, monocyte-attracting proteins, and tumor necrosis factor, accelerate the pathological process of As. Plaque stability is relatively high in cases with minimal inflammatory response; however, increased inflammation destabilizes plaques. An excessive inflammatory response results in internal corrosion, leading to cracks, rupture, intra-plaque hemorrhage, and ultimately thrombosis. Vascular smooth muscle cells (VSMCs) play a central role in collagen synthesis, with VSMC accumulation contributing to plaque stabilization. In contrast, inflammation promotes T cell aggregation, leading to increased plaque instability through reduced VSMC numbers and inhibited collagen synthesis. This process also accelerates matrix depletion, resulting in thinning and rupture of the fibrous cap. Furthermore, plaque rupture in vulnerable lesions arises from an imbalance between heightened matrix degradation and diminished matrix synthesis. Matrix metalloproteinases (MMPs), predominantly expressed by macrophages within plaques, facilitate matrix degradation, while tissue inhibitors of metalloproteinases (TIMPs), primarily produced by smooth muscle cells, reduces MMP’s matrix degradation effect. MMPs primarily originate from macrophages and smooth muscle cells, with their synthesis regulated by macrophage-derived cytokines. Macrophages serve as key “matrix-degrading” cells, being more prevalent in vulnerable plaques; thus, macrophage accumulation is a recognized predictor of plaque vulnerability to rupture and thrombosis. This study utilized OCT to identify vulnerable plaques and establish a direct association between PIV, SII, and the coronary atherosclerotic plaque vulnerability in patients with ACS, including features like FCT and lipid core angle. The study revealed that PIV (OR, 1.78; 95% CI, 1.35–2.06; P <0.001) and SII (OR, 1.52; 95% CI, 1.14–2.08; P <0.001) were significant risk factors for developing TCFA in patients with ACS. The AUC for diagnosing TCFA using PIV and SII was 0.880 (95% CI, 0.833–0.927; P <0.001) and 0.767 (95% CI, 0.704–0.830; P <0.001), respectively. The optimal cutoff values were determined as 490.7 for PIV, with a sensitivity of 75.44% and a specificity of 89.32%, and 802.9 for SII, with a sensitivity of 67.54% and a specificity of 79.61%.
The high PIV group exhibited higher levels of vulnerable plaques, macrophage infiltration ratio, lipid plaque length, maximum lipid plaque angle, and lipid index compared to the low PIV group, with a lower FCT. Similarly, the high SII group showed elevated levels of vulnerable plaques, macrophage infiltration ratio, microchannels, lipid plaque length, maximum lipid plaque angle, and lipid index compared to the low SII group, also with reduced FCT, and these differences were statistically significant. Linear regression analysis found negative correlations between PIV, SII, and plaque FCT. Furthermore, multifactorial logistic regression analysis identified PIV and SII as independent risk factors for TCFA in patients with ACS.
To the best of our knowledge, this study represents the first investigation into the predictive value of PVI and SII for vulnerable plaques in patients with ACS. Observations indicate that PVI and SII can be easily calculated from complete blood count data, which is readily accessible in clinical settings. As a non-invasive, feasible, and cost-effective biomarker, PVI and SII may serve as valuable predictors of plaque vulnerability in ACS patients.
Limitations
There are certain limitations to this study. Firstly, it was a single-center retrospective study, potentially introducing center selection bias, and its findings require validation through larger sample size studies. Secondly, being a cross-sectional study, it lacked long-term follow-up on adverse events. Moreover, it only assessed the levels of PIV and SII at admission without evaluating their dynamic changes over time, which leaves uncertainty regarding their persistence as risk factors for TCFA in the future. Thirdly, due to the limitations of OCT imaging, other features associated with plaque vulnerability (such as plaque load) could not be visualized.
Conclusion
In summary, TCFA detected by OCT was more common in patients with ACS who exhibited elevated levels of PIV and SII. Furthermore, coronary atherosclerotic plaques in the high PIV and high SII groups exhibited greater vulnerability. These findings suggest that PIV and SII, as noninvasive, feasible, and cost-effective biomarkers, could be valuable indicators for assessing plaque vulnerability in patients with ACS.
Data Sharing Statement
Further inquiries can be acquired directly to the corresponding author.
Ethics Approval
The study was conducted in accordance with the Declaration of Helsinki, and was approved by the approval of the Ethics Committee of the People’s Hospital of Henan University of Traditional Chinese Medicine (Approval No.20220132), which waived the requirement for informed consent due to the retrospective nature of the study. We are committed to keeping the data of all participating patients confidential.
Acknowledgments
This study was funded by the Henan Provincial Science and Technology Tackling Program (222102310345).
Disclosure
The author(s) report no conflicts of interest in this work.
References
1. Atwood J. Management of acute coronary syndrome. Emerg Med Clin North Am. 2022;40:693–706. doi:10.1016/j.emc.2022.06.008
2. Lawton JS, Tamis-Holland JE, Bangalore S, et al. 2021 ACC/AHA/SCAI guideline for coronary artery revascularization: executive summary: a report of the American college of cardiology/American heart association joint committee on clinical practice guidelines. Circulation. 2022;145:e771.
3. Hu SS. Writing committee of the report on cardiovascular health and diseases in China. epidemiology and current management of cardiovascular disease in China. J Geriatr Cardiol. 2024;21:387–406. doi:10.26599/1671-5411.2024.04.001
4. Bergmark BA, Mathenge N, Merlini PA, et al. Acute coronary syndromes. Lancet. 2022;399:1347–1358. doi:10.1016/S0140-6736(21)02391-6
5. Virmani R, Kolodgie FD, Burke AP, et al. Lessons from sudden coronary death: a comprehensive morphological classification scheme for atherosclerotic lesions. Arterioscler Thromb Vasc Biol. 2000;20:1262–1275. doi:10.1161/01.ATV.20.5.1262
6. Mushenkova NV, Summerhill VI, Zhang D, et al. Current advances in the diagnostic imaging of atherosclerosis: insights into the pathophysiology of vulnerable plaque. Int J Mol Sci. 2020;21:2992. doi:10.3390/ijms21082992
7. Nagasawa A, Otake H, Kawamori H, et al. Relationship among clinical characteristics, morphological culprit plaque features, and long-term prognosis in patients with acute coronary syndrome. Int J Cardiovasc Imaging. 2021;37:2827–2837. doi:10.1007/s10554-021-02252-w
8. Murat B, Murat S, Ozgeyik M, et al. Comparison of pan-immune-inflammation value with other inflammation markers of long-term survival after ST-segment elevation myocardial infarction. Eur J Clin Invest. 2023; 53:e13872.
9. Zhao Z, Zhang X, Sun T, et al. Prognostic value of systemic immune-inflammation index in CAD patients: systematic review and meta-analyses. Eur J Clin Invest. 2024;54:e14100. doi:10.1111/eci.14100
10. Liu Y, Liu J, Liu L, et al. Association of systemic inflammatory response index and pan-immune-inflammation-value with long-term adverse cardiovascular events in ST-segment elevation myocardial infarction patients after primary percutaneous coronary intervention. J Inflamm Res. 2023;16:3437–3454. doi:10.2147/JIR.S421491
11. Byrne RA, Rossello X, Coughlan JJ, et al. ESC Guidelines for the management of acute coronary syndromes. Eur Heart J. 2023;44:3720–3826. doi:10.1093/eurheartj/ehad191
12. Flynn JT, Falkner BE. New clinical practice guideline for the management of high blood pressure in children and adolescents. Hypertension. 2017;70:683–686. doi:10.1161/HYPERTENSIONAHA.117.10050
13. ElSayed NA, Aleppo G, Aroda VR, et al. Summary of revisions: standards of care in diabetes-2023. Diabetes Care. 2023;46:S5–S9. doi:10.2337/dc23-Srev
14. Jellinger PS, Handelsman Y, Rosenblit PD, et al. American association of clinical endocrinologists and American college of endocrinology guidelines for management of dyslipidemia and prevention of cardiovascular disEASE. Endocr Pract. 2017;23:1–87. doi:10.4158/EP171764.APPGL
15. Cetinkaya Z, Kelesoglu S, Tuncay A, et al. The role of pan-immune-inflammation value in determining the severity of coronary artery disease in NSTEMI patients. J Clin Med. 2024;13:1295. doi:10.3390/jcm13051295
16. Kume T, Akasaka T, Kawamoto T, et al. Measurement of the thickness of the fibrous cap by optical coherence tomography. Am Heart J. 2006;152:
17. Akasaka T, Kubo T, Mizukoshi M, et al. Pathophysiology of acute coronary syndrome assessed by optical coherence tomography. J Cardiol. 2010;56:8–14. doi:10.1016/j.jjcc.2010.05.005
18. Yonetsu T, Lee T, Murai T, et al. Plaque morphologies and the clinical prognosis of acute coronary syndrome caused by lesions with intact fibrous cap diagnosed by optical coherence tomography. Int J Cardiol. 2016;203:766–774. doi:10.1016/j.ijcard.2015.11.030
19. Jia H, Abtahian F, Aguirre AD, et al. In vivo diagnosis of plaque erosion and calcified nodule in patients with acute coronary syndrome by intravascular optical coherence tomography. J Am Coll Cardiol. 2013;62:1748–1758. doi:10.1016/j.jacc.2013.05.071
20. Karimi Galougahi K, Dakroub A, Chau K, et al. Utility of optical coherence tomography in acute coronary syndromes. Catheter Cardiovasc Interv. 2023;102:46–55. doi:10.1002/ccd.30656
21. Wolf D, Ley K. Immunity and inflammation in atherosclerosis. Circ Res. 2019;124:315–327. doi:10.1161/CIRCRESAHA.118.313591
22. Kong P, Cui ZY, Huang XF, et al. Inflammation and atherosclerosis: signaling pathways and therapeutic intervention. Signal Transduct Target Ther. 2022;7:131. doi:10.1038/s41392-022-00955-7
23. Hansson GK, Hermansson A. The immune system in atherosclerosis. Nat Immunol. 2011;12:204–212. doi:10.1038/ni.2001
24. Han K, Shi D, Yang L, et al. Prognostic value of systemic inflammatory response index in patients with acute coronary syndrome undergoing percutaneous coronary intervention. Ann Med. 2022;54:1667–1677. doi:10.1080/07853890.2022.2083671
25. Murat B, Murat S, Ozgeyik M, et al. Comparison of pan-immune-inflammation value with other inflammation markers of long-term survival after ST -segment elevation myocardial infarction. Eur J Clin Invest. 2023;53:e13872. doi:10.1111/eci.13872
26. Ito H, Wakatsuki T, Yamaguchi K, et al. Atherosclerotic coronary plaque is associated with adventitial vasa vasorum and local inflammation in adjacent epicardial adipose tissue in fresh cadavers. Circ J. 2020;84:769–775. doi:10.1253/circj.CJ-19-0914
27. Libby P, Theroux P. Pathophysiology of coronary artery disease. Circulation. 2005;111:3481–3488. doi:10.1161/CIRCULATIONAHA.105.537878
28. Bakogiannis C, Sachse M, Stamatelopoulos K, et al. Platelet-derived chemokines in inflammation and atherosclerosis. Cytokine. 2019;122:154157. doi:10.1016/j.cyto.2017.09.013
29. Couldwell G, Machlus KR. Modulation of megakaryopoiesis and platelet production during inflammation. Thromb Res. 2019;179:114–120. doi:10.1016/j.thromres.2019.05.008
30. Abbate R, Cioni G, Ricci I, et al. Thrombosis and acute coronary syndrome. Thromb Res. 2012;129:235–240. doi:10.1016/j.thromres.2011.12.026
31. Tang TT, Yuan J, Zhu ZF, et al. Regulatory T cells ameliorate cardiac remodeling after myocardial infarction. Basic Res Cardiol. 2012;107:232. doi:10.1007/s00395-011-0232-6
32. Peet C, Ivetic A, Bromage DI, Shah AM. Cardiac monocytes and macrophages after myocardial infarction. Cardiovasc Res. 2020;116:1101–1112. doi:10.1093/cvr/cvz336
33. Akın Y, Karasu M, Deniz A, et al. Predictive value of the systemic immune inflammatory index in cardiac syndrome x. BMC Cardiovasc Disord. 2023;23:146. doi:10.1186/s12872-023-03157-3
34. Batra G, Lindbäck J, Becker RC, et al. Biomarker-based prediction of recurrent ischemic events in patients with acute coronary syndromes. J Am Coll Cardiol. 2022;80:1735–1747. doi:10.1016/j.jacc.2022.08.767
35. Nidorf SM, Fiolet ATL, Mosterd A, et al. Colchicine in patients with chronic coronary disease. N Engl J Med. 2020;383:1838–1847. doi:10.1056/NEJMoa2021372
36. Fiolet ATL, Opstal TSJ, Mosterd A, et al. Efficacy and safety of low-dose colchicine in patients with coronary disease: a systematic review and meta-analysis of randomized trials. Eur Heart J. 2021;42:3202. doi:10.1093/eurheartj/ehab115
 © 2024 The Author(s). This work is published and licensed by Dove Medical Press Limited. The
full terms of this license are available at https://www.dovepress.com/terms.php
and incorporate the Creative Commons Attribution
- Non Commercial (unported, 3.0) License.
By accessing the work you hereby accept the Terms. Non-commercial uses of the work are permitted
without any further permission from Dove Medical Press Limited, provided the work is properly
attributed. For permission for commercial use of this work, please see paragraphs 4.2 and 5 of our Terms.
© 2024 The Author(s). This work is published and licensed by Dove Medical Press Limited. The
full terms of this license are available at https://www.dovepress.com/terms.php
and incorporate the Creative Commons Attribution
- Non Commercial (unported, 3.0) License.
By accessing the work you hereby accept the Terms. Non-commercial uses of the work are permitted
without any further permission from Dove Medical Press Limited, provided the work is properly
attributed. For permission for commercial use of this work, please see paragraphs 4.2 and 5 of our Terms.