")
Back to Journals » Clinical Ophthalmology » Volume 18
Quantitative ultra-widefield fluorescein angiography biomarkers in diabetic retinopathy and association with treatment and progression
Authors Iyengar RS, Fleifil S, Aaberg MT, Yu G, Patel TP, Powell C, Tran AK, Paulus YM
Received 3 April 2024
Accepted for publication 22 November 2024
Published 27 December 2024 Volume 2024:18 Pages 4019—4028
DOI https://doi.org/10.2147/OPTH.S472071
Checked for plagiarism Yes
Review by Single anonymous peer review
Peer reviewer comments 2
Editor who approved publication: Dr Scott Fraser
Rahul S Iyengar,1,2 Salma Fleifil,1 Michael T Aaberg,1,3 Gina Yu,1,4 Tapan P Patel,1,5 Corey Powell,6 Annie K Tran,1 Yannis M Paulus1,5,7
1Department of Ophthalmology and Visual Sciences, W. K. Kellogg Eye Center, University of Michigan Medical School, Ann Arbor, MI, USA; 2Department of Ophthalmology, Roski Eye Institute, Keck School of Medicine at USC, Los Angeles, CA, USA; 3Department of Medicine, Emory University School of Medicine, Atlanta, GA, USA; 4Department of Ophthalmology, Byers Eye Institute, Stanford Health Care, Palo Alto, CA, USA; 5Department of Ophthalmology, Wilmer Eye Institute, Johns Hopkins University School of Medicine, Baltimore, MD, USA; 6Department of Consulting for Statistics, Computing and Analytics Research, University of Michigan, Ann Arbor, MI, USA; 7Department of Biomedical Engineering, Johns Hopkins University, Baltimore, MD, USA
Correspondence: Yannis M Paulus, Wilmer Eye Institute Department of Ophthalmology Johns Hopkins University, 600 N. Wolfe St, Baltimore, MD, 21287, USA, Tel +1 410 955-3518, Email [email protected]
Purpose: To determine if demographic factors and calculated areas of nonperfusion (NP) and neovascularization (NV) on ultra-widefield (UWF) fluorescein angiography (FA) in the eyes of patients with diabetes are associated with treatment with intravitreal injections (IVIs), panretinal photocoagulation (PRP), and diabetic retinopathy (DR) progression.
Patients and Methods: This retrospective, cross-sectional study included 363 patients (651 eyes) treated at the University of Michigan Kellogg Eye Center between January 2009 and May 2018. Eligible participants were 18 years or older diagnosed with diabetes who received UWF FA. Patients with previous PRP or poor-quality images were excluded. Main outcome measures included comparison analyses of measured surface areas in millimeters squared (mm2) of total and regional retinal nonperfusion and neovascularization, number of IVIs and PRP treatments, and DR progression.
Results: Our cohort received 3,041 IVIs and 878 PRP treatments with a mean follow-up of 915 days (SD ± 714). IVIs were positively associated with posterior NP (difference, 1.15 mm2; 0.43– 1.86; P= 0.0017). PRP treatments were positively associated with total NP (difference, 27.24 mm2; 14.68– 39.79; P< 0.001) and total NV (difference, 1.75 mm2; 0.84– 2.65; P< 0.001), as well as regional areas. While progression was not associated with NP/NV area, it was positively associated with a pre-existing diagnosis of type 2 as compared to type 1 diabetes (147% increase; 7– 373% increase; p=0.03).
Conclusion: Areas of NP and NV on UWF FA demonstrated associations with PRP and IVIs in DR patients.
Keywords: diabetic retinopathy, intravitreal injections, panretinal photocoagulation, ultra-widefield fluorescein angiography
Introduction
Diabetic retinopathy (DR) is a leading cause of vision loss among working age adults. Studies estimate that nearly 93 million people worldwide have DR, which could rise to 191 million by 2030.1,2 The established standard for evaluating DR severity and predicting the risk of progression has been through standard 7 field photography and the extended modified Airlie House classification, as outlined in the Early Treatment Diabetic Retinopathy Study (ETDRS).3 More recently, a growing body of evidence suggests ultra-widefield (UWF) scanning laser ophthalmoscopy may offer unique advantages in comparison to 7-field ETDRS photography when evaluating DR.4–14
UWF imaging can provide a view of over 80% of the retinal surface area, as compared to 30% with 7-standard field ETDRS imaging.4 As proposed by the International Widefield Imaging Study Group, UWF specifically refers to images depicting anatomic features anterior to the vortex vein ampulla in all 4 quadrants.15 This provides an enhanced view of the retinal periphery and may better identify lesions that affect DR classification, such as intraretinal microvascular abnormalities, which are associated with a 4.7-fold increased risk of progression from non-proliferative DR (NPDR) to proliferative DR (PDR), or NV itself.6,7 UWF imaging also offers numerous efficiency benefits over ETDRS, including up to an 81% lower ungradable image rate16 and 25% less image evaluation time.12 In particular, UWF fluorescein angiography (FA) offers simultaneous capture of a 200° retinal field with vessels in the same angiographic phase, forgoing the need to obtain a series of images.8,11 By contrast, ETDRS obtains a limited view of the periphery and requires montaging separate images together, which introduces distortions and artifacts at connecting fields that limits quantification of measurements such as total surface area.3,17 With UWF FA, areas of capillary nonperfusion (NP) and neovascularization (NV) can be more accurately quantified once accounting for projection distortions on UWF FA.5 Separate studies have utilized these precise measurements available with UWF FA to identify threshold surface areas of NP associated with an increased risk of PDR.17,18 Likewise, more recent studies have demonstrated strong associations between both NP and predominantly peripheral lesions (PPLs), which are more adequately visualized with UWF FA, and the risk of DR progression.19,20 With precise quantification, more robust models can be constructed to explore potential associations between biomarker areas, disease progression, and hallmark features of DR.
While previous research suggests a relationship between NP area and number of DR lesions, further study is necessary to explore how NP, and other quantifiable biomarkers such as PPLs, may be related to clinical interventions for DR longitudinally over time, including panretinal photocoagulation (PRP) treatments and intravitreal injections (IVIs).9,11 A small prospective study demonstrated no change in NP area measured on UWF FA or optical coherence tomography angiography (OCTA) following PRP treatments.21 Similarly, while multiple studies suggest anti-VEGF treatments may improve the diabetic retinopathy severity scale (DRSS) score on color fundus photography, data regarding reperfusion of NP areas have been conflicting, highlighting the need for further study with large cohorts.22–25
The objective of this study was to assess whether measured biomarker areas of NP, NV, and the foveal avascular zone (FAZ) on UWF FA images were associated with IVIs and/or subsequent PRP treatments in patients with type 1 or 2 diabetes. While our previous study outlined a rigorous system for quantifying images and identified associations between calculated biomarker areas and patient demographics,17 this study further investigates if relationships may exist between biomarker areas, demographic and clinical factors, DR treatments, and DR progression. The identification of objective trends between quantifiable biomarkers and clinical treatments may aid the design of further prospective trials exploring the utility of UWF FA in guiding the management of DR.
Materials and Methods
A retrospective, cross-sectional study was conducted on patients diagnosed with type 1 or type 2 diabetes who received UWF FA at the University of Michigan W. K. Kellogg Eye Center between January 2009 and May 2018. January 2009 was selected as the start of the study since this is when UWF FA was acquired by the institution. Ethics approval was obtained from the University of Michigan Institutional Review Board (UM-IRB) to obtain clinical information and images from patients’ medical records (HUM00120509, PI Y.M. Paulus). Due to the retrospective nature of this study, a Health Insurance Portability and Accountability Act (HIPAA) waiver of consent was provided by the UM-IRB. The authors certify that this study was HIPAA compliant and conducted in accordance with the tenets of the Declaration of Helsinki, and all data collected were stored in a HIPAA compliant database. Any shared or computer analyzed data were anonymized and de-identified to maintain confidentiality.26
Inclusion and Exclusion Criteria
Participants were eligible for this study if they met the following inclusion criteria: 18 years or older, diagnosed with type 1 or type 2 diabetes, and evaluated with a dilated fundus examination and UWF FA at either the Ann Arbor or Grand Blanc sites of the University of Michigan Kellogg Eye Center. Images were excluded if there was evidence of previous laser photocoagulation treatment, indistinguishable areas of NP or NV secondary to poor-quality image, media opacities obscuring clear image of retina (from cataracts, vitreous hemorrhage, etc), or technical issues in image processing secondary to improper image formats or failed image projections. For situations in which an FA was again obtained at follow-up appointments during the study period, these images were included unless they met the above exclusion criteria. A review of medical records was performed to collect the following data for each patient at the baseline and follow-up visits, when applicable: age, sex, race, diabetes type 1 or 2, hemoglobin A1c, body mass index, intraocular pressure, Snellen best-corrected visual acuity, severity of diabetic retinopathy by ETDRS grading, presence of diabetic macular edema on clinical exam, and eye treatments including laser photocoagulation, IVIs, and intraocular surgery. Duration of follow-up was calculated from the date of first UWF FA imaging until the last clinical encounter in the study period. Patients without any subsequent encounters after the initial UWF FA were designated as lost to follow-up.
UWF FA and Image Segmentation
Our methodology for obtaining and evaluating UWF FA retinal images and training graders was described in detail in our previous manuscripts, which include representative ungraded and graded images to illustrate the grading process and details about the method of quantification.17,27 Briefly, FA images were obtained with UWF scanning laser ophthalmoscopy with Optos 200Tx or California (Optos PLC, Dunfermline, Scotland, UK) and projected onto a curved surface using proprietary Optos software, described in detail previously,28 which assumes the eye is a sphere with a diameter of 24 mm.14,29 Multiple FA images within arteriovenous, venous, and late phases were obtained for each patient, and a single retina specialist selected the best macula-centered image from the FA series of each eligible eye. Selected images were manually segmented by 4 masked graders using open-source ITK-SNAP software to identify surface areas of FAZ, NP, and NV in millimeters squared (mm2) for each image.30 All 4 graders underwent extensive training by the aforementioned retina specialist to ensure grading accuracy and standardization, and each image was segmented by a single grader with adjudication by the retina specialist for uncertain areas. Surface areas for NP and NV were then grouped by region based on distance from FAZ as follows: regions within and including 3.00 mm from identified FAZ into “posterior pole”, between 3.00 mm and including 10.00 mm into “mid-periphery”, and between 10.00 mm and including 15.00 mm into “far-periphery”.
Statistical Analysis
All statistical analyses for this study were conducted using R (R Core Team, 2019).31 Both parametric and nonparametric analyses were utilized to conduct comparisons between experimental groups. Frequencies and relative frequencies were calculated for categorical variables and mean, standard deviation, and ranges were calculated for continuous variables (including biomarker areas). We created generalized estimating equation models to assess for possible associations between biomarker areas (FAZ, NP, NV), demographic variables (Table 1), IVIs, and PRP treatments. These models, implemented using the geeglm function from the R package geepack in the Comprehensive R Archive Network, were essentially linear regressions that accounted for correlations between left-eye and right-eye measurements for a given patient. As the purpose of this study is exploratory and not confirmatory, P values are unadjusted, with P less than 0.05 representing relationships warranting further exploration.
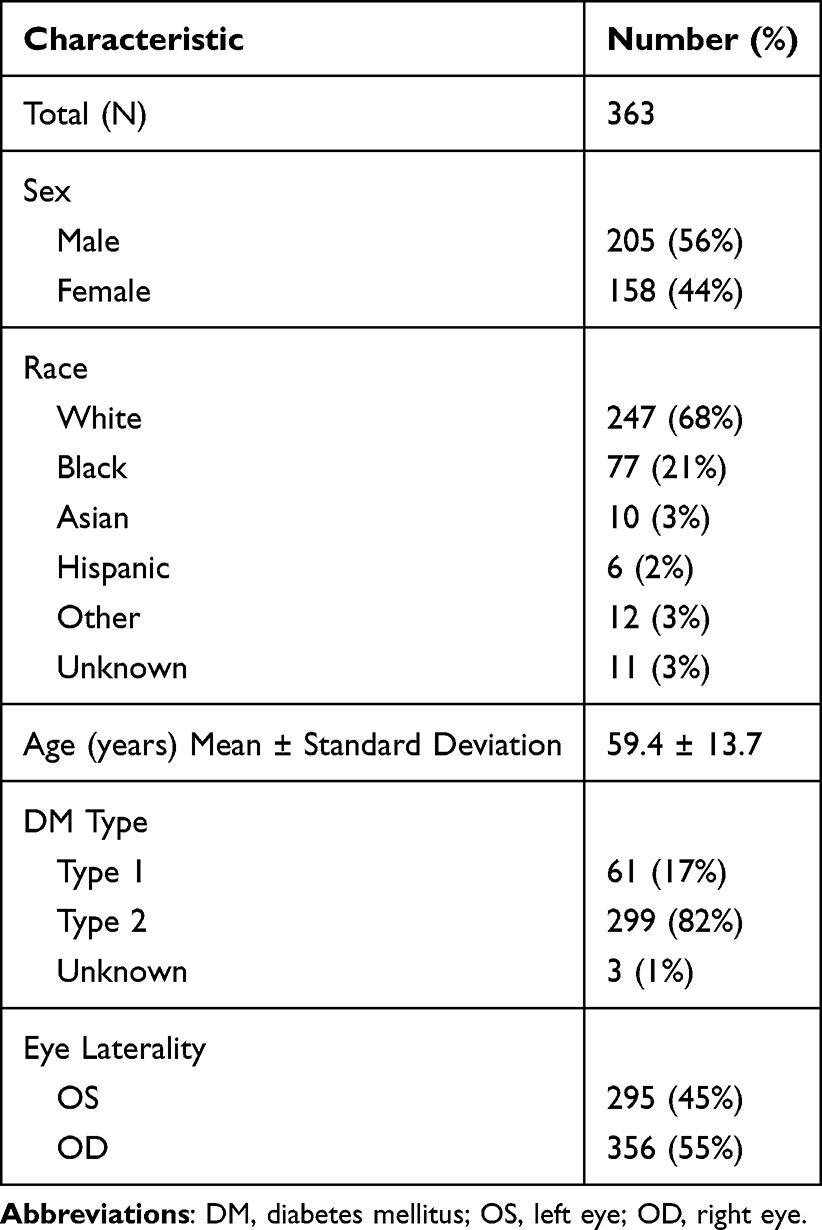 |
Table 1 Baseline Patient Characteristics |
Additionally, a separate multivariate regression model was constructed to explore the relationship between segmented biomarker areas, demographic factors (Table 1), and DR progression. For our purposes, progression and severity are count variables, with progression defined as a one-step increase in DR severity during the period of study. DR severity was assigned to 0, 1, 2, 3, or 4 representing no DR, mild NPDR, moderate NPDR, severe NPDR, or PDR respectively, as defined by ETDRS classification. Patients were excluded from the progression analysis if they already had PDR at the baseline visit. A generalized estimating equations model was used with progression as the outcome following a Poisson distribution with a log link-function. Collinearity between the biomarker areas calculated precluded inclusion of all areas calculated in the model. Given the limited number of Hispanic patients with complete data needed to calculate progression, we consolidated Black and Hispanic patients into a single category to increase the size of this group.
Results
In total, 1,048 images were obtained from patients with diagnosis of type 1 or type 2 diabetes that had UWF FA imaging from January 2009 and May 2018 (Figure 1). Of these, 111 images (10.6%) were excluded for missing demographic information, 138 images (13.2%) for previous laser photocoagulation treatment, 69 images (6.6%) for failed 2-dimensional projection with the Optos software, and 14 images (1.3%) for originating from a camera other than Optos 200Tx or Optos California. Of the remaining 716 images, 65 images (9.1%) were excluded by graders for poor-quality or media opacity (ie, vitreous hemorrhage or cataracts) limiting evaluation of biomarker areas. A total of 651 eyes from 363 patients (205 males and 158 females) were included in the final analysis. The mean duration of follow-up for patients was 915 days (SD ±714 days, range 0–2,895 days), with incomplete clinical data for 19.4% of patients and the last visit being the UWF FA visit (no follow-up) in 7.1% of patients. The demographics for this cohort are outlined in Table 1 and our previous study.17 Briefly, the mean (SD) age was 59.4 (13.7) years, the mean (SD) best-corrected visual acuity logMar was 0.34 (0.31) (Snellen equivalent 20/43), and the distribution of DR severities included no DR (76 eyes), mild NPDR (92 eyes), moderate NPDR (144 eyes), severe NPDR (101 eyes), PDR (220 eyes), and unknown severity (18 eyes). Our cohort self-identified into the following racial groups: 247 (68.0%) White, 77 (21.2%) Black, 10 (2.8%) Asian, 6 (1.7%) Hispanic, 12 (3.3%) Other (including Native Hawaiian, Pacific Islander, American Indian, Alaska Native), and 11 (3.0%) Unknown/No response.
 |
Figure 1 Criteria for Inclusion of UWF FA Images. Flowchart depicting exclusion of patients in our study. Patients were excluded for failed 2-D image projection, missing demographics, previous laser photocoagulation treatment, imaging with non-Optos camera, or poor-quality image or media opacity limiting image evaluation. In total, 651 patients with UWF FA were included with a mean follow-up of 915 days (SD ±714). |
Associations Between Biomarker Areas and IVIs
In total, IVIs for this cohort included 2,556 anti-VEGF injections and 376 steroid injections. The anti-VEGF injections performed were bevacizumab (62.1%), aflibercept (21.5%), and ranibizumab (16.4%). In multivariate linear regression models accounting for various demographic factors, area of posterior NP was positively associated at least one IVI versus zero injections (difference, 1.15 mm2; 95% CI, 0.43–1.86; P=0.0017). No other significant associations were observed between any other biomarker areas and one versus zero IVIs or additional IVIs (Table 2). IVIs were performed at the discretion of the treating physician for the presence of visually significant DME and/or vitreous hemorrhage. At the time of this study, our physicians as a practice pattern did not routinely perform IVIs for either DR alone or PDR, where PRP is the favored treatment if there is adequate visualization.
 |
Table 2 Association Between IVIs and Areas of FAZ, Regional NP, and Regional NV |
Associations Between Biomarker Areas and PRP Treatments
There were 878 total PRP treatments in this patient cohort, and the relationship between PRP treatments and biomarker areas is outlined in Table 3. A strong positive association was observed between area of total NP and one PRP treatment versus zero treatments (difference, 27.24 mm2; 95% CI, 14.68–39.79; P<0.001), with regional associations between PRP treatments and mid-periphery NP (difference, 10.34 mm2; 95% CI, 4.43–16.26; P<0.001) and far-periphery NP (difference, 18.67 mm2; 95% CI, 10.24–27.09; P<0.001). A positive association was also identified between one PRP treatment and total NV (difference, 1.75 mm2; 95% CI, 0.84–2.65; P<0.001), mid-periphery NV (difference, 1.23 mm2; 95% CI, 0.51–1.96; P<0.001), and far-periphery NV (difference, 0.37 mm2; 95% CI, 0.14–0.61; P=0.0019). No strong associations were observed between additional PRP treatments and any biomarker areas.
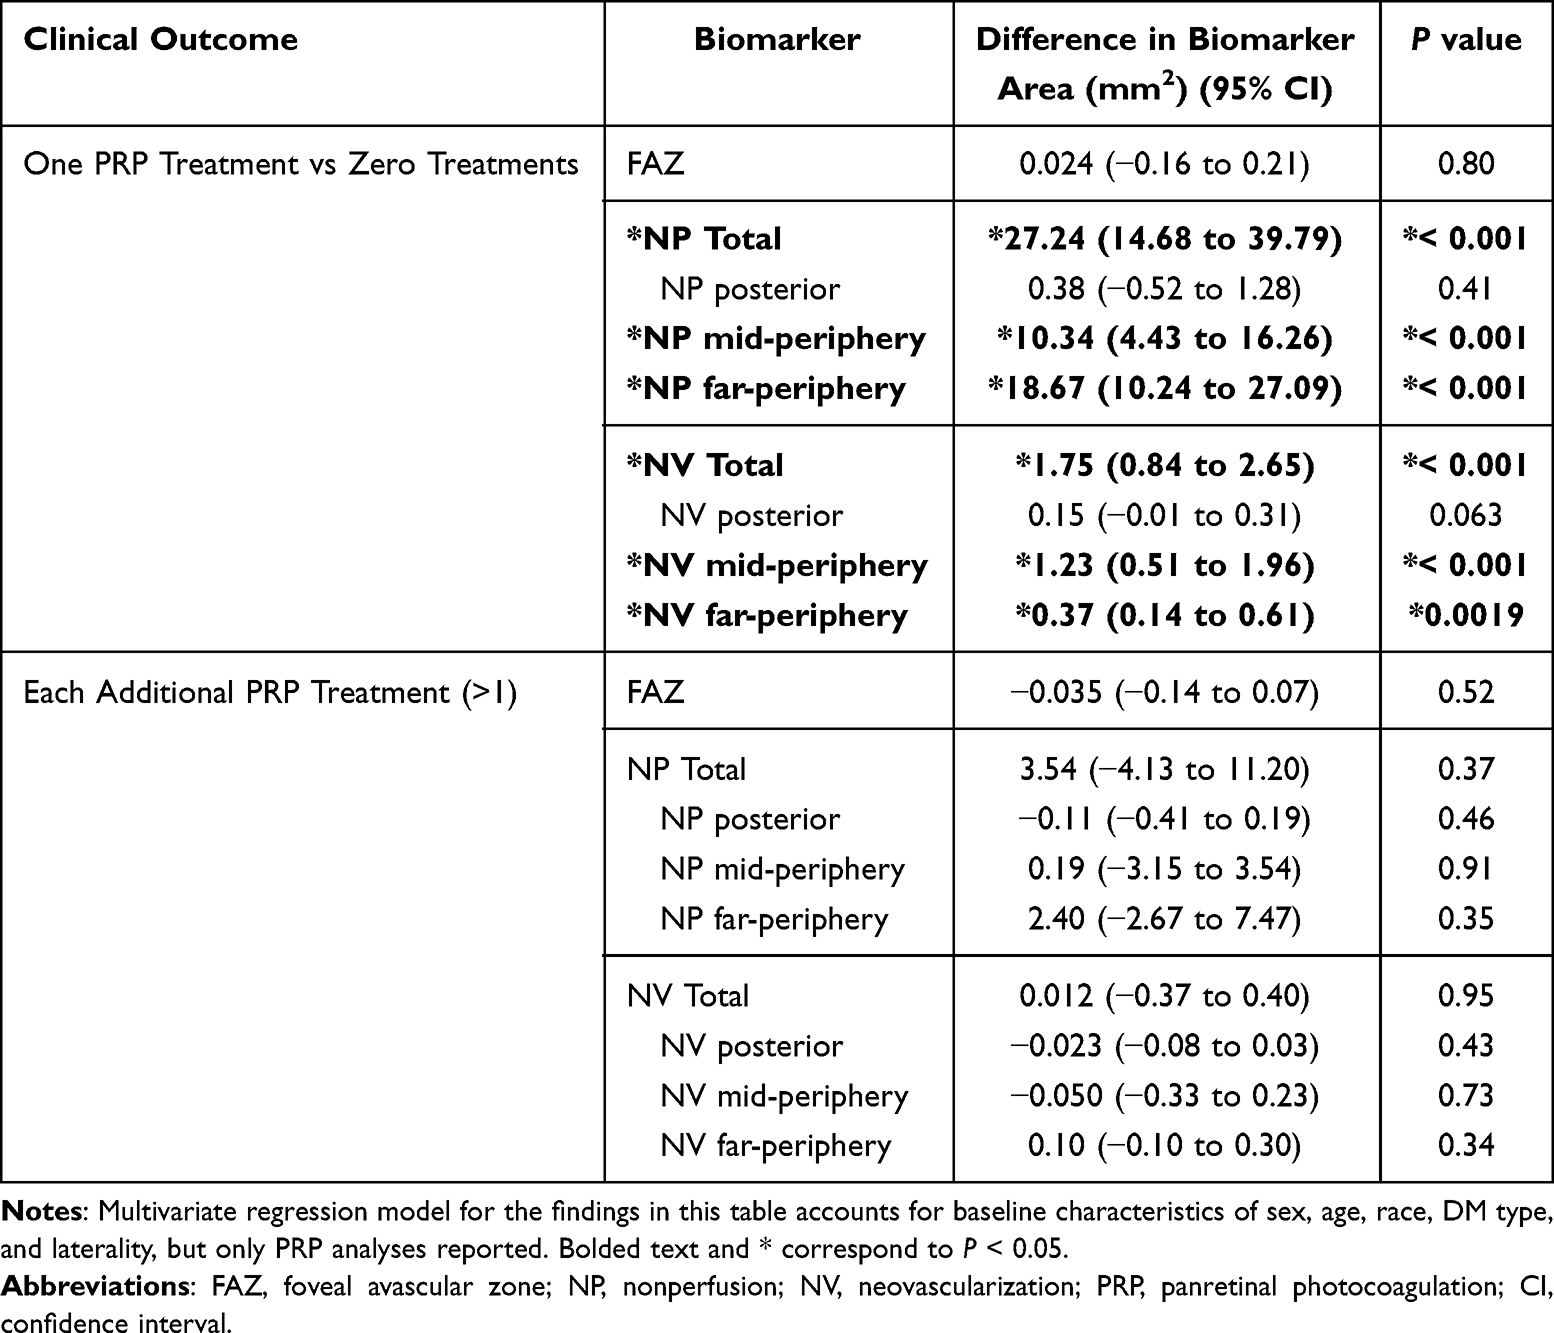 |
Table 3 Association Between PRP Treatments Received and Areas of FAZ, Regional NP, and Regional NV |
Associations Between Demographics, Biomarker Areas, and DR Progression
The relationship between patient demographics, biomarker areas, and DR progression is reported in Table 4. A positive association was observed between progression of ETDRS severity and a pre-existing diagnosis of type 2 diabetes (147% increase; 95% CI, 7–373% increase; P=0.03), as compared to type 1 diabetes. The mean DR severity for a pre-existing diagnosis of type 1 diabetes was 2.98 (SD ±1.18) with a mean hemoglobin A1c of 8.58% (SD ±2.15%), as compared to a mean severity of 2.38 (SD ±1.41) with a mean A1c of 7.80% (SD ±1.87%) for type 2 diabetes. After accounting for demographic factors, no strong associations were observed between biomarker areas of NP or NV and DR progression.
 |
Table 4 Association Between Demographics and NP and NV Areas with Progression of DR |
Discussion
In this retrospective study, UWF FA images from a cohort of patients with diabetes were quantified to determine if an association existed between biomarker surface areas, clinical interventions, and progression of DR. It builds upon our previous study that outlined a robust model for quantitatively grading images and demonstrated a strong positive association between areas of NP and NV and demographic factors, namely male sex, black race, and presence or development of vitreous hemorrhage.17 In contrast, this study examined UWF images and clinical characteristics from our large cohort of patients longitudinally, with a mean patient follow-up time of approximately 915 days, to assess whether PRP treatments, IVIs, and DR progression were associated with identified UWF FA areas.
Our study shows that total areas of both NP and NV were positively associated with receiving one PRP treatment vs zero, particularly for areas >3 mm from the FAZ (mid- and far-periphery). Considering the close associations that have been previously demonstrated between NP (especially peripheral NP), DR severity, and risk of DR progression,11,17,18 it is not surprising that patients with increased peripheral NP were more likely to receive PRP in an attempt to reduce the risk of significant vision loss and vitrectomy or to stimulate NV regression.32,33 However, a recent prospective study demonstrated no change in NP observed on UWF FA or OCTA following PRP treatments in a cohort of eyes with exclusively treatment-naïve PDR.21,34,35 While targeted use of PRP to regions of NP has been proposed previously,36,37 the DAVE randomized trial in eyes with diabetic macular edema did not show benefit from targeted photocoagulation to NP areas.21,38
IVIs are being increasingly used for the management of DR and associated complications, most commonly DME,39–42 but the relationship between area of NP on UWF FA images and anti-VEGF injections remains unclear. While some studies suggest slowed NP progression or possible reperfusion following anti-VEGF injections,24,25 the majority of evidence favors minimal reperfusion of NP areas on UWF FA or OCTA with anti-VEGF therapy despite improvement in DRSS score.21–23,42,43 This study finds that IVIs were positively associated with posterior NP (difference, 1.15 mm2; 95% CI, 0.43–1.86; P=0.0017), but the significance of this finding remains unclear and would benefit from further study.
Our study did not identify associations between biomarker areas and DR progression. This was unexpected in light of previous work by Silva et al demonstrating a strong association with DR progression and peripheral lesions,7 which in turn were correlated with nonperfusion area.11 In the latter study, the authors indicated NP increased with severity until plateauing for severe NPDR and PDR. This may account for our lack of association between quantified areas and DR progression, considering 71.4% of our images corresponded to DRSS grades of moderate NPDR or greater. However, progression was positively associated with type 2 diabetes as compared to type 1 diabetes in our study. While multiple studies confirm a transient worsening of DR following initiation of intensive therapy with type 1 diabetes that may be contributing,44,45 it is also possible that a plateau effect may have contributed, particularly given that 67.8% of patients with type 1 diabetes had severe NPDR or PDR as compared to 47.4% of patients with type 2 diabetes.
Our focus for this study was to evaluate the utility of precise image quantification available with UWF FA in predicting clinical treatments and progression for DR. The results of our study, combined with findings from our previously published work, suggest the potential utility of regular screening of DR patients with UWF FA imaging and biomarker area quantification for the purposes of prognostication and risk stratification.17,27 Multiple studies have also supported OCTA in evaluating retinal ischemia in patients with DR, as it is non-invasive and can reliably detect and quantify NP and NV.21,23,46 While no relationship was seen in our study between calculated FAZ areas and DR treatments, OCTA may be more effective for detecting subtle changes in FAZ and their potential associations with treatments.47 However, OCTA cannot directly visualize leakage, is subject to projection artifacts, and may have slightly lower sensitivity and specificity for detecting NP than UWF FA.1,48 While conventional OCTA provides a limited view of the retinal periphery, studies investigating wide-angle OCTA show promise and would benefit from further exploration with large, prospective cohorts, possibly in conjunction with biomarker assessment of UWF FA.21,23,46
Limitations
We acknowledge that findings in this retrospective study are from two sites at a single-center, and large, multicenter prospective studies could better characterize our observed relationships. Also, consideration of when the images were taken in relation to treatment could better elucidate effects of treatment on biomarkers and is something to consider in future studies. Similarly, the indication for treatment with IVIs and PRP treatments was not standardized, given the retrospective nature of this study. Factors such as the systemic health of the patient, reliability of follow-up, and patient willingness to receive treatment all may have affected the decision to treat. While the focus of this study was primarily to retrospectively investigate relationships between biomarker areas and the likelihood of DR treatments, future prospective studies incorporating these factors could better explore this relationship. Another limitation is the use of manual graders performing image segmentation, which may have introduced variability or inaccuracies, but this was mitigated through rigorous training and verification by a retina specialist. Artificial intelligence automated grading could be considered in future studies. Previous research has demonstrated that trained, nonphysician graders can reliably identify DR features in UWF images.10 We have assumed uniform eye diameters of 24 mm, which may cause inaccuracies in biomarker areas for eyes with varying axial lengths. The racial distribution of our cohort was not representative of the greater population, although a higher percentage of African American patients was included as compared to previous studies.4,6,7,13 Our rate of ungradable images (9.1%) was higher than reported in previous investigations, but in those studies, protocols were implemented to identify and re-take ungradable images at the time of UWF imaging.12,13 Future studies investigating features of UWF FA may benefit from the adoption of similar protocols.
Conclusion
This retrospective analysis demonstrated strong associations between areas of NP and NV on UWF FA images and PRP treatments that were not demonstrated between biomarker areas and IVIs. Additionally, type 2 diabetes was more closely associated with DR progression as compared to type 1 diabetes. Our findings suggest the potential utility of regular screening of DR patients with UWF FA imaging for the purposes of prognostication and risk stratification Prospective studies with large cohorts and multimodal imaging are necessary to better characterize relationships between peripheral biomarker areas, clinical treatments, and DR progression.
Acknowledgments
The authors would also like to acknowledge Dave Musch, PhD and Marta Gilson, PhD who are both affiliated with the University of Michigan for their preliminary univariate statistical analyses. They did not receive compensation for this study.
Funding
This work was supported by the National Eye Institute grant 1R01EY033000 (YMP), 1R01EY034325 (YMP), Alcon Research Institute Young Investigator Grant, and unrestricted departmental support from Research to Prevent Blindness. Though these organizations were not specifically involved with the design and conduct of the study; collection, management, analysis, and interpretation of the data; preparation, review, or approval of the manuscript; and decision to submit the manuscript for publication; they helped fund researchers involved with this study that did complete these responsibilities.
Disclosure
Yannis Paulus reports consulting fees from Iridex, Inc., grants from Alcon Research Institute Young Investigator Grant, grants from Research to Prevent Blindness, during the conduct of the study and is a Founder with equity from Photosonox, LLC outside the submitted work. The remaining authors report no conflicts of interests or competing interests.
References
1. Flaxel CJ, Adelman RA, Bailey ST, et al. Diabetic retinopathy preferred practice pattern®. Ophthalmology. 2020;127(1):P66–P145. doi:10.1016/j.ophtha.2019.09.025
2. Ting DSW, Cheung GCM, Wong TY. Diabetic retinopathy: global prevalence, major risk factors, screening practices and public health challenges: a review: global burden of diabetic eye diseases. Clin Exp Ophthalmol. 2016;44(4):260–277. doi:10.1111/ceo.12696
3. Early Treatment Diabetic Retinopathy Study Research Group, ed. Grading diabetic retinopathy from stereoscopic color fundus photographs—an extension of the modified Airlie house classification: ETDRS report number 10. Ophthalmology. 1991;98(5):786–806. doi:10.1016/S0161-6420(13)38012-9.
4. Silva PS, Cavallerano JD, Sun JK, Noble J, Aiello LM, Aiello LP. nonmydriatic ultrawide field retinal imaging compared with dilated standard 7-Field 35-mm photography and retinal specialist examination for evaluation of diabetic retinopathy. Am J Ophthalmol. 2012;154(3):549–559.e2. doi:10.1016/j.ajo.2012.03.019
5. Wessel MM, Aaker GD, Parlitsis G, Cho M, D’Amico DJ, Kiss S. Ultra–wide-field angiography improves the detection and classification of diabetic retinopathy. Retina. 2012;32(4):785–791. doi:10.1097/IAE.0b013e3182278b64
6. Silva PS, Cavallerano JD, Sun JK, Soliman AZ, Aiello LM, Aiello LP. Peripheral lesions identified by mydriatic ultrawide field imaging: distribution and potential impact on diabetic retinopathy severity. Ophthalmology. 2013;120(12):2587–2595. doi:10.1016/j.ophtha.2013.05.004
7. Silva PS, Cavallerano JD, Haddad NMN, et al. Peripheral lesions identified on ultrawide field imaging predict increased risk of diabetic retinopathy progression over 4 years. Ophthalmology. 2015;122(5):949–956. doi:10.1016/j.ophtha.2015.01.008
8. Kiss S, Berenberg TL. Ultra widefield fundus imaging for diabetic retinopathy. Curr Diab Rep. 2014;14(8):514. doi:10.1007/s11892-014-0514-0
9. Sun JK, Aiello LP. The future of ultrawide field imaging for diabetic retinopathy: pondering the retinal periphery. JAMA Ophthalmol. 2016;134(3):247. doi:10.1001/jamaophthalmol.2015.5384
10. Silva PS, Cavallerano JD, Tolson AM, et al. Real-time ultrawide field image evaluation of retinopathy in a diabetes telemedicine program. Dia Care. 2015;38(9):1643–1649. doi:10.2337/dc15-0161
11. Silva PS, Dela Cruz AJ, Ledesma MG, et al. Diabetic retinopathy severity and peripheral lesions are associated with nonperfusion on ultrawide field angiography. Ophthalmology. 2015;122(12):2465–2472. doi:10.1016/j.ophtha.2015.07.034
12. Silva PS, Cavallerano JD, Tolls D, et al. Potential efficiency benefits of nonmydriatic ultrawide field retinal imaging in an ocular telehealth diabetic retinopathy program. Dia Care. 2014;37(1):50–55. doi:10.2337/dc13-1292
13. Silva PS, Cavallerano JD, Haddad NMN, et al. Comparison of nondiabetic retinal findings identified with nonmydriatic fundus photography vs ultrawide field imaging in an ocular telehealth program. JAMA Ophthalmol. 2016;134(3):330. doi:10.1001/jamaophthalmol.2015.5605
14. Price L, Au S, Chong V. Optomap ultrawide field imaging identifies additional retinal abnormalities in patients with diabetic retinopathy. OPTH. 2015;527. doi:10.2147/OPTH.S79448
15. Choudhry N, Duker JS, Freund KB, et al. Classification and guidelines for widefield imaging: recommendations from the international widefield imaging study group. Ophthalmol Retina. 2019;3(10):843–849. doi:10.1016/j.oret.2019.05.007
16. Silva PS, Horton MB, Clary D, et al. Identification of diabetic retinopathy and ungradable image rate with ultrawide field imaging in a national teleophthalmology program. Ophthalmology. 2016;123(6):1360–1367. doi:10.1016/j.ophtha.2016.01.043
17. Yu G, Aaberg MT, Patel TP, et al. Quantification of retinal nonperfusion and neovascularization with ultrawidefield fluorescein angiography in patients with diabetes and associated characteristics of advanced disease. JAMA Ophthalmol. 2020;138:680. doi:10.1001/jamaophthalmol.2020.1257
18. Nicholson L, Ramu J, Chan EW, et al. Retinal nonperfusion characteristics on ultra-widefield angiography in eyes with severe nonproliferative diabetic retinopathy and proliferative diabetic retinopathy. JAMA Ophthalmol. 2019;137(6):626. doi:10.1001/jamaophthalmol.2019.0440
19. Marcus DM, Silva PS, Liu D, et al. Association of predominantly peripheral lesions on ultra-widefield imaging and the risk of diabetic retinopathy worsening over time. JAMA Ophthalmol. 2022;140(10):946–954. doi:10.1001/jamaophthalmol.2022.3131
20. Silva PS, Marcus DM, Liu D, et al. Association of Ultra-Widefield Fluorescein Angiography-Identified Retinal Nonperfusion and the Risk of Diabetic Retinopathy Worsening Over Time. JAMA Ophthalmol. 2022;140(10):936–945. doi:10.1001/jamaophthalmol.2022.3130
21. Russell JF, Al-khersan H, Shi Y, et al. Retinal nonperfusion in proliferative diabetic retinopathy before and after panretinal photocoagulation assessed by widefield OCT angiography. Am J Ophthalmol. 2020;213:177–185. doi:10.1016/j.ajo.2020.01.024
22. Bonnin S, Dupas B, Lavia C, et al. Anti-vascular endothelial growth factor therapy can improve diabetic retinopathy score without change in retinal perfusion. Retina. 2019;39(3):426–434. doi:10.1097/IAE.0000000000002422
23. Couturier A, Rey PA, Erginay A, et al. Widefield OCT-angiography and fluorescein angiography assessments of nonperfusion in diabetic retinopathy and edema treated with anti–vascular endothelial growth factor. Ophthalmology. 2019;126(12):1685–1694. doi:10.1016/j.ophtha.2019.06.022
24. Wykoff CC, Shah C, Dhoot D, et al. Longitudinal retinal perfusion status in eyes with diabetic macular edema receiving intravitreal aflibercept or laser in vista study. Ophthalmology. 2019;126(8):1171–1180. doi:10.1016/j.ophtha.2019.03.040
25. Wykoff CC, Nittala MG, Zhou B, et al. Intravitreal aflibercept for retinal nonperfusion in proliferative diabetic retinopathy: outcomes from the randomized RECOVERY trial. Ophthalmol Retina. 2019;3(12):1076–1086. doi:10.1016/j.oret.2019.07.011
26. World Medical Association. World medical association declaration of Helsinki: ethical principles for medical research involving human subjects. JAMA. 2013;310(20):2191–2194. doi:10.1001/jama.2013.281053.
27. Fleifil S, Azzouz L, Yu G, Powell C, Bommakanti N, Paulus YM. Quantitative biomarkers of diabetic retinopathy using ultra-widefield fluorescein angiography. Clin Ophthalmol. 2024;18:1961–1970. doi:10.2147/OPTH.S462223
28. Croft D, Hemert J, Wykoff C, et al. Precise montaging and metric quantification of retinal surface area from ultra-widefield fundus photography and fluorescein angiography. OSIL. 2014;45(4):312–317. doi:10.3928/23258160-20140709-07
29. Oishi A, Hidaka J, Yoshimura N. Quantification of the image obtained with a wide-field scanning ophthalmoscope. Invest Ophthalmol Vis Sci. 2014;55(4):2424. doi:10.1167/iovs.13-13738
30. Yushkevich PA, Piven J, Hazlett HC, et al. User-guided 3D active contour segmentation of anatomical structures: significantly improved efficiency and reliability. NeuroImage. 2006;31(3):1116–1128. doi:10.1016/j.neuroimage.2006.01.015
31. R Core Team. R: a language and environment for statistical computing. Vienna, Austria: R foundation for statistical computing; 2019. Available from: http://www.R-project.org/.
32. Ferris F. Early photocoagulation in patients with either type I or type II diabetes. Trans Am Ophthalmol Soc. 1996;94:505–537.
33. Diabetic Retinopathy Study Research Group. Indications for photocoagulation treatment of diabetic retinopathy: diabetic retinopathy study report no. 14. the diabetic retinopathy study research group. Int Ophthalmol Clin. 1987;27(4):239–253. doi:10.1097/00004397-198702740-00004
34. Pahor D. Visual field loss after argon laser panretinal photocoagulation in diabetic retinopathy: full- versus mild-scatter coagulation. Int Ophthalmol. 1998;22(5):313–319. doi:10.1023/a:1006367029134
35. Henricsson M, Heijl A. The effect of panretinal laser photocoagulation on visual acuity, visual fields and on subjective visual impairment in preproliferative and early proliferative diabetic retinopathy. Acta Ophthalmol. 1994;72(5):570–575. doi:10.1111/j.1755-3768.1994.tb07181.x
36. Suñer IJ, Peden MC, Hammer ME, Grizzard WS, Traynom J, Cousins SW. RaScaL: a pilot study to assess the efficacy, durability, and safety of a single Intervention with ranibizumab plus peripheral laser for diabetic macular edema associated with peripheral nonperfusion on ultrawide-field fluorescein angiography. Ophthalmologica. 2014. doi:10.1159/000367902
37. Takamura Y, Tomomatsu T, Matsumura T, et al. The effect of photocoagulation in ischemic areas to prevent recurrence of diabetic macular edema after intravitreal bevacizumab injection. Invest Ophthalmol Vis Sci. 2014;55(8):4741–4746. doi:10.1167/iovs.14-14682
38. Brown DM, Ou WC, Wong TP, Kim RY, Croft DE, Wykoff CC. Targeted retinal photocoagulation for diabetic macular edema with peripheral retinal nonperfusion. Ophthalmology. 2018;125(5):683–690. doi:10.1016/j.ophtha.2017.11.026
39. Gross JG, Glassman AR, Jampol LM; Writing Committee for the Diabetic Retinopathy Clinical Research Network, et al. Panretinal photocoagulation vs intravitreous ranibizumab for proliferative diabetic retinopathy: a randomized clinical trial. JAMA. 2015;314(20):2137–2146. doi:10.1001/jama.2015.15217.
40. Gross JG, Glassman AR, Liu D, et al. Five-Year outcomes of panretinal photocoagulation vs intravitreous ranibizumab for proliferative diabetic retinopathy: a randomized clinical trial. JAMA Ophthalmol. 2018;136(10):1138–1148. doi:10.1001/jamaophthalmol.2018.3255
41. Ip MS, Domalpally A, Sun JK, Ehrlich JS. Long-term effects of therapy with ranibizumab on diabetic retinopathy severity and baseline risk factors for worsening retinopathy. Ophthalmology. 2015;122(2):367–374. doi:10.1016/j.ophtha.2014.08.048
42. Ip MS, Domalpally A, Hopkins JJ, Wong P, Ehrlich JS. Long-term effects of ranibizumab on diabetic retinopathy severity and progression. Arch Ophthalmol. 2012;130(9):1145–1152. doi:10.1001/archophthalmol.2012.1043
43. Hsieh YT, Alam MN, Le D, et al. OCT angiography biomarkers for predicting visual outcomes after ranibizumab treatment for diabetic macular edema. Ophthalmol Retina. 2019;3(10):826–834. doi:10.1016/j.oret.2019.04.027
44. Nathan DM, Genuth S; Diabetes Control and Complications Trial Research Group, et al. The effect of intensive treatment of diabetes on the development and progression of long-term complications in insulin-dependent diabetes mellitus. N Engl J Med. 1993;329(14):977–986. doi:10.1056/NEJM199309303291401.
45. Dahl-Jørgensen K, Brinchmann-Hansen O, Hanssen KF, Sandvik L, Aagenaes O. Rapid tightening of blood glucose control leads to transient deterioration of retinopathy in insulin dependent diabetes mellitus: the Oslo study. Br Med J. 1985;290(6471):811–815. doi:10.1136/bmj.290.6471.811
46. Russell JF, Shi Y, Hinkle JW, et al. Longitudinal wide-field swept-source Oct angiography of neovascularization in proliferative diabetic retinopathy after panretinal photocoagulation. Ophthalmol Retina. 2019;3(4):350–361. doi:10.1016/j.oret.2018.11.008
47. Shiihara H, Terasaki H, Sonoda S, et al. Objective evaluation of size and shape of superficial foveal avascular zone in normal subjects by optical coherence tomography angiography. Sci Rep. 2018;8(1):10143. doi:10.1038/s41598-018-28530-7
48. Sawada O, Ichiyama Y, Obata S, et al. Comparison between wide-angle OCT angiography and ultra-wide field fluorescein angiography for detecting non-perfusion areas and retinal neovascularization in eyes with diabetic retinopathy. Graefes Arch Clin Exp Ophthalmol. 2018;256(7):1275–1280. doi:10.1007/s00417-018-3992-y
 © 2024 The Author(s). This work is published and licensed by Dove Medical Press Limited. The
full terms of this license are available at https://www.dovepress.com/terms.php
and incorporate the Creative Commons Attribution
- Non Commercial (unported, 3.0) License.
By accessing the work you hereby accept the Terms. Non-commercial uses of the work are permitted
without any further permission from Dove Medical Press Limited, provided the work is properly
attributed. For permission for commercial use of this work, please see paragraphs 4.2 and 5 of our Terms.
© 2024 The Author(s). This work is published and licensed by Dove Medical Press Limited. The
full terms of this license are available at https://www.dovepress.com/terms.php
and incorporate the Creative Commons Attribution
- Non Commercial (unported, 3.0) License.
By accessing the work you hereby accept the Terms. Non-commercial uses of the work are permitted
without any further permission from Dove Medical Press Limited, provided the work is properly
attributed. For permission for commercial use of this work, please see paragraphs 4.2 and 5 of our Terms.