")
Back to Journals » Clinical Ophthalmology » Volume 19
Real-World Outcomes with Complement Inhibitors for Geographic Atrophy: A Comparative Study of Pegacetacoplan versus Avacincaptad Pegol
Authors Rush RB , Klein W , Reinauer RM
Received 19 January 2025
Accepted for publication 27 March 2025
Published 31 March 2025 Volume 2025:19 Pages 1167—1174
DOI https://doi.org/10.2147/OPTH.S518398
Checked for plagiarism Yes
Review by Single anonymous peer review
Peer reviewer comments 4
Editor who approved publication: Dr Scott Fraser
Ryan B Rush,1– 3 Westin Klein,1 Robert M Reinauer4
1Department of Ophthalmology, Panhandle Eye Group, Amarillo, TX, USA; 2Department of Surgery, Texas Tech University Health Science Center, Amarillo, TX, USA; 3Department of Ophthalmology, Southwest Retina Specialists, Amarillo, TX, USA; 4Department of Ophthalmology, New Vision Eye Center, Vero Beach, FL, USA
Correspondence: Ryan B Rush, Department of Ophthalmology, Panhandle Eye Group, 7400 Fleming Blvd, Amarillo, TX, 79106, USA, Tel +1 806 351-1870, Email [email protected]
Purpose: To compare real-world outcomes in subjects who underwent treatment with intravitreal avacincaptad pegol (IVA) or intravitreal pegacetacoplan (IVP) for geographic atrophy (GA) secondary to age-related macular degeneration (AMD).
Methods: This study was undertaken as a retrospective, comparative assessment of subjects who underwent IVA or IVP treatment for GA secondary to AMD at two community-based ophthalmology practices. All subjects included in the study had a visual acuity of ≥ 20/200 at baseline, a total GA lesion area of ≥ 1.5 mm2 and ≤ 17.5 mm2at baseline, and follow-up of 12-months following IVA or IVP initiation. The primary outcome was change in GA lesion size at 12 months. Secondary outcomes were change in logMAR vision at 12 months, total number of complement injections administered over 12 months, and the incidence of exudation at 12 months.
Results: A total of 112 subjects were analyzed. There were no significant differences in baseline characteristics between treatment groups. There were no significant differences between IVA and IVP in change in total GA lesion size [1.19 (± 0.33) mm2 versus 1.28 (± 0.37) mm2; p = 0.61], change in visual acuity [− 0.1 (− 0.04 to − 0.16) logMAR versus − 0.09 (− 0.05 to − 0.13) logMAR; p = 0.57], or exudation (p = 0.66) over the 12 month study period, respectively. However, the IVA cohort received more injections compared to the IVP group at 12 months (9.05 (± 1.06) versus 5.96 (± 2.01); p < 0.01).
Conclusion: This real-world study reports that treatment with IVA and IVP have similar visual and anatomic outcomes at 12-months, although subjects undergoing treatment with IVP may receive fewer injections to obtain these outcomes. Further studies comparing the safety and efficacy of IVA and IVP are warranted.
Keywords: geographic atrophy, avacincaptad pegol, age-related macular degeneration, complement inhibition, izervay, syfovre, pegacetacoplan
Introduction
Geographic atrophy (GA) is a late-stage manifestation of age-related macular degeneration (AMD) characterized by retinal thinning and cell death in the macula, leading initially to patchy regions of visual impairment followed later by permanent vision loss. Pegacetacoplan (Syfovre; Apellis Pharmaceuticals, USA) (15 mg/0.1 mL) became the first treatment to gain Food and Drug Administration (FDA) approval for the treatment of GA secondary to AMD based on the positive results of the pivotal OAKS and DERBY clinical trials.1 In these trials, intravitreal pegacetacoplan (IVP) demonstrated significantly slowed GA progression compared to sham at two years and has been labeled by the FDA for use every 25 to 60 days. Avacincaptad Pegol (Izervay; Iveric Bio, USA) (2 mg/0.1 mL) became the second treatment to gain FDA approval for the treatment of GA secondary to AMD based on the positive results of the Gather 1 and Gather 2 clinical trials.2,3 From baseline to month 12 in Gather 2, the mean rate of square-root-transformed GA area growth was about 14% less in the intravitreal avacincaptad pegol (IVA) group compared to sham, and IVA received labeling by the FDA for use every 4 weeks.
Although both IVP and IVA treat GA by inhibiting the complement cascade system, the point of inhibition is distinctly different; IVP is a targeted C3 inhibitor that binds to and prevents the activation of C3 and C3b, whereas IVA binds to C5, thereby preventing it from splitting into C5a and C5b, which result in the formation of a membrane attack complex.4 There has been much debate regarding which point of inhibition is most clinically effective in GA as well as which has the lowest rate of side-effects, especially the development of macular neovascularization (MNV).5,6 In the GATHER 1 trial,2 MNV occurred in approximately 12% of subjects receiving monthly IVA treatments at 18 months (compared to 3.6% receiving sham), whereas MNV occurred around 12% in subjects receiving monthly IVP treatments and 7% for those receiving every-other-month IVP treatments (compared to 3% receiving sham) in the OAKS/DERBY trials.1 In this study, the authors compare real-world outcomes in subjects undergoing treatment with IVA and IVP in order to provide managing specialists data to help guide the decision-making process when considering GA treatment in AMD subjects.
Methods
This research was carried out as a retrospective, comparative analysis of AMD subjects started on either IVA or IVP therapy for GA at two community-based ophthalmology practices in Florida and Texas between September and December of 2023. The study was undertaken in compliance with the Health Insurance Portability and Accountability Act of 1996 and the principles of the Declaration of Helsinki. The conduct of this research was approved by the Panhandle Eye Group Institutional Review Board (IORG0009239; IRB00011013-18). Informed consent was waived because the data collection was performed retrospectively and all identifying subject information was eliminated.
A list of patients who were started on IVP or IVA therapy for GA secondary to AMD in the above time window was compiled from a electronic medical records query. Subjects were allocated into 2 treatment groups according to the type of complement inhibitor used during the study period: 1) A Treatment Group in which IVA therapy was exclusively used, and 2) A Treatment Group in which IVP therapy was exclusively used. The inclusion/exclusion criteria of the study are presented in Table 1. Only one eye per patient was eligible for analysis. If both eyes of the same subject met the criteria for participation, the eye with the better visual acuity was selected for inclusion.
 |
Table 1 Criteria for Inclusion and Exclusion |
The diagnosis of GA was established by utilizing multi-modal imaging7 [optical coherence tomography (OCT), fundus autofluorescence (FAF), fluorescein angiography (FA), and indocyanine green angiography (ICGA)] and by the clinical observation of a well-delineated area of atrophy in the outer layers of the retina (ie photoreceptors and retinal pigment epithelium) and loss of the choriocapillaris. The GA classification terminology in this study was according to consensus definitions recently accepted based on OCT findings.8 The OCT, FAF, FA, and ICGA pictures were taken exclusively with the Heidelberg Spectralis system (Heidelberg Engineering). OCT protocols included a 97-line volume scan (20° × 20°, high-resolution mode, ART = 9) and 73-line volume scan (20° × 15°, high-resolution mode, ART = 9). The GA measurements were independently measured by two fellowship-trained retina specialists (RBR and RMR), and RegionFinder software (Heidelberg Engineering, version 2.6.4.0) tabulated the GA total area on FAF according to formerly reported techniques.9–11 When there was a < 10% disparity in the total area of GA between masked graders, image concordance was established. If there was a > 10% disparity in the total area of GA between masked graders, a third researcher (WK) arbitrated the case.
The baseline examination of this study was the encounter in which the decision to start IVA or IVP therapy for GA was made. The decision as to which complement inhibition agent to initiate treatment with was at the managing physician’s discretion and took into account the patient’s insurance coverage as well as the managing physician’s preferences. Subjects in both treatment groups variably underwent IVA or IVP treatment either on the same day or within 1 week of the evaluation in which the decision to treat was determined. The intended IVP treatment schedule was within a 29–60 day window, whereas the IVA treatment schedule was within a 29–35 day window according to their respective FDA labeling. This study defined MNV as exudation (eg subretinal edema, intraretinal edema, cystoid macular edema, with or without a serous pigment epithelial detachment) within the macula region secondary to a choroidal neovascular membrane (CNVM) complex on clinical examination and documented with multi-modal imaging. When MNV occurred, the anti-vascular endothelial growth factor (VEGF) treatment strategy was a “treat-and-extend” protocol.12 In brief, monthly anti-VEGF injections were administered until the macula was free from intraretinal and/or subretinal fluid on OCT and there was an absence of macular hemorrhage on biomicroscopy. The interval of treatment was extended by 2-week increments until the inter-visit interval was maximized. If intraretinal and/or subretinal fluid reappeared, macular hemorrhage recurred, or the visual acuity decreased by two or more Snellen lines, the interval of treatment was lowered by 1 or 2 weeks. If MNV occurred during the study period, the decision to stop complement inhibition treatment in favor of anti-VEGF monotherapy versus continuing with complement inhibition treatment in addition to anti-VEGF treatment varied according to the best-judgment of the managing ophthalmologist and the preferences of the individual subject. Subjects undergoing both complement inhibition treatment and anti-VEGF therapy received injections either on the same day or within 1 week from each other according to the preferences of the managing ophthalmologist and the individual subject.
Primary and Secondary Outcomes
The primary outcome was change in GA total surface area between treatment groups at the end of the 12-month (48–56 weeks) study period. The secondary outcomes were change in visual acuity between treatment groups at the end of the 12-month (48–56 weeks) study period, incidence of MNV development during the study period, and number of complement inhibitor treatments administered during the study period.
Statistical Analyses
Visual acuity was measured using the Snellen eye chart with pinhole approximations; the Snellen visual acuity was then converted into logMAR units for analysis. The JMP 11 (SAS Institute, USA) statistical software was utilized, and quantitative data was assessed by employing the nonparametric Wilcoxon rank sum test or Wilcoxon signed-rank test (for paired data). Nominal outcomes were evaluated using contingency analysis with likelihood ratios, and numerical outcomes were evaluated using the one-way analysis of the variance.
Results
A total of 112 patients (60 in the IVA Group and 52 in the IVP Group) were analyzed. All study patients (100%) in both treatment groups consumed an AREDS II (Age-related Eye Disease Studies II) vitamin throughout the entire duration of the research period. Concordance in image grading between the two masked reviewers was 90.2% (101/112).
The baseline characteristics of the treatment groups are exhibited in Table 2. Of note, there were no significant differences between the two treatment groups at baseline.
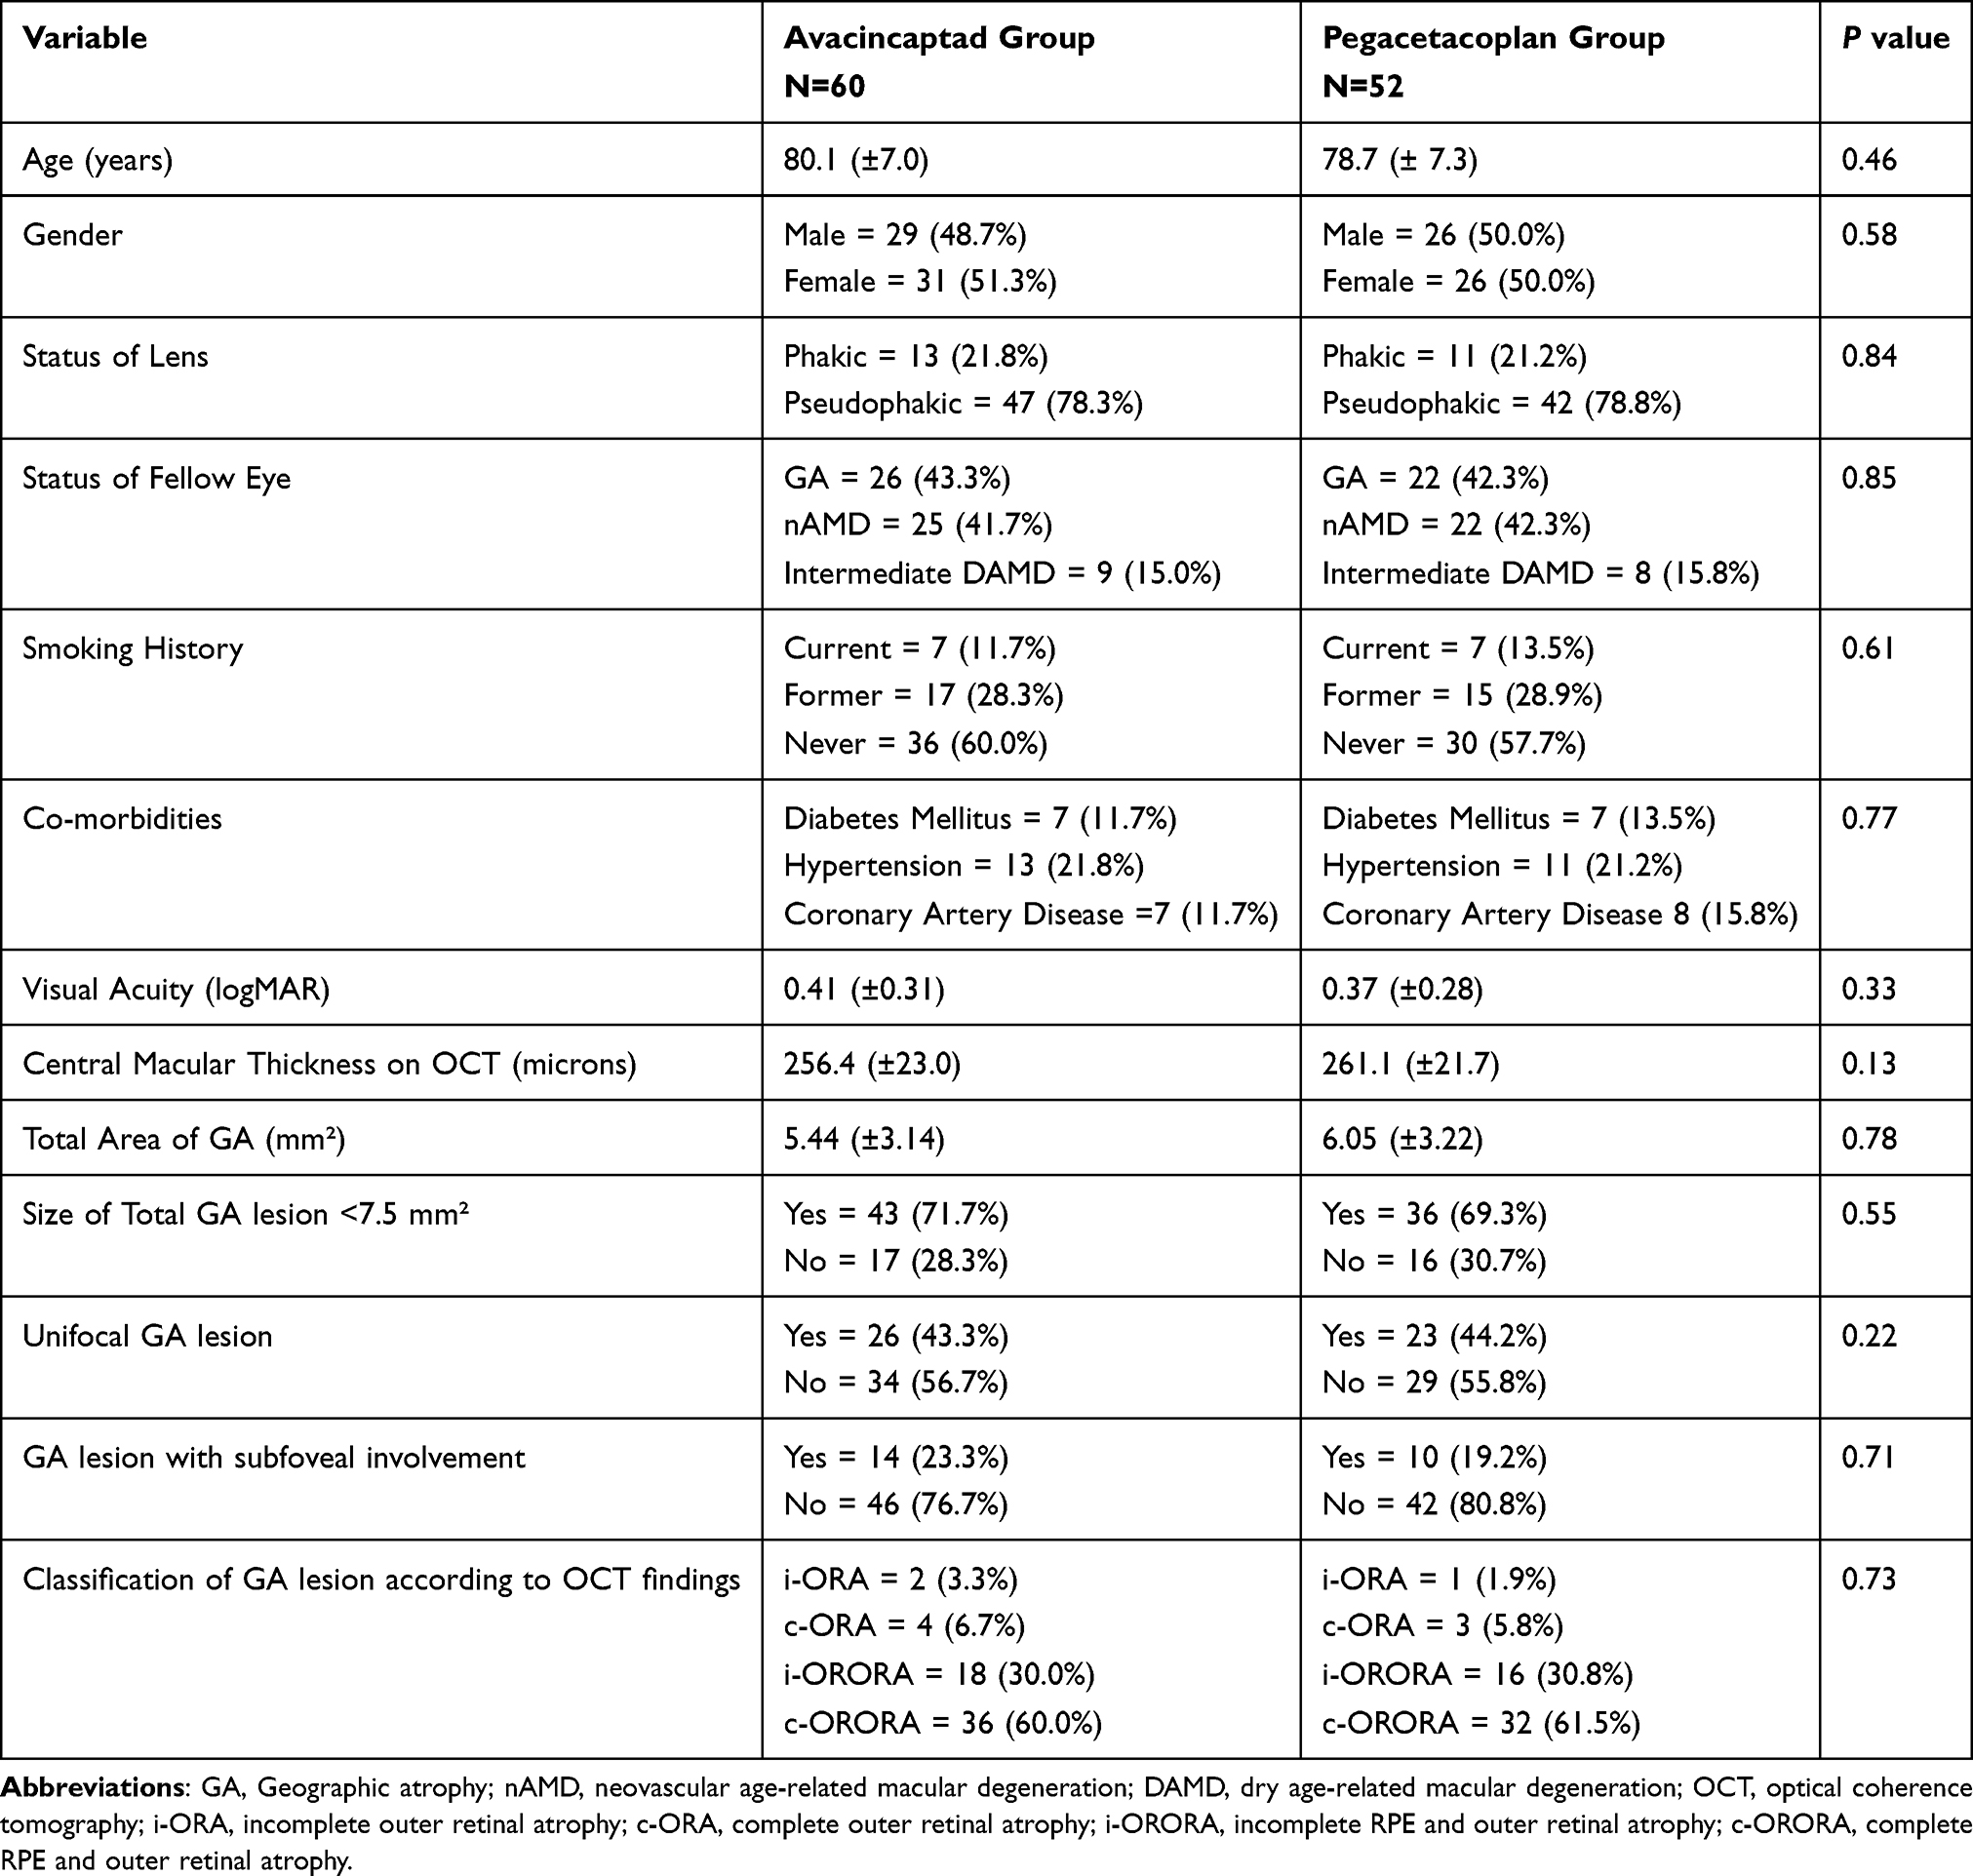 |
Table 2 Treatment Group Features at Baseline. Means with (95% Confidence Intervals) |
No significant differences were observed between the IVA and IVP treatment cohorts in regards to change in total GA lesion size [1.19 (±0.33) mm2 versus 1.28 (±0.37) mm2; p = 0.61], change in visual acuity [−0.1 (−0.04 to −0.16) logMAR versus −0.09 (−0.05 to −0.13) logMAR; p = 0.57], or MNV development (p = 0.66) over the 12 month study period, respectively. However, the IVA cohort received more injections during the study period compared to the IVP cohort (9.05 (±1.06) versus 5.96 (±2.01); p < 0.01), respectively. Table 3 summarizes the 12-month outcomes of this study.
 |
Table 3 Treatment Group Outcomes at 12 Months. Means with (95% Confidence Intervals) |
Regarding the 7 subjects in the IVA cohort who developed MNV during the study period, 85.7% (6/7) continued to receive IVA in addition to anti-VEGF therapy, whereas 14.3% (1/7) opted to discontinue IVA in favor of anti-VEGF monotherapy. The average time for MNV onset was 3.2 (±1.2) months after initiation of IVA, and the average number of anti-VEGF injections given during the study period in these subjects was 5.1 (±1.4) injections. The brand of anti-VEGF medication utilized in this subgroup during the study period were as follows: 42.9% (3/7) bevacizumab (Avastin; Genentech, Inc)(1.25 mg/0.05mL), 28.6% (2/7) aflibercept (VEGF-Trap Eye/Eylea; Regeneron, Tarrytown, NY) (2 mg/0.05mL), and 14.3% (1/7) Faricimab (Vabysmo; Roche/Genentech; Basel, Switzerland)(6mg/0.05mL). Regarding the CNVM features of the 7 subjects in the IVA cohort who developed MNV during the study period, 42.9% (3/7) were classified as having a Type 1 lesion, 28.6% (2/7) had a Type 2 lesion, and 28.6% (2/7) had a Type 3 lesion. The FA leaking pattern at the time of the MNV diagnosis was occult in 71.4% (5/7) of subjects and classic in 28.6% (2/7) of subjects. At the end of the study period, 28.6% (2/7) of subjects in the IVA cohort were observed to still have evidence of persistent exudation (ie subretinal fluid, intraretinal fluid, and/or macular hemorrhage) on examination.
Regarding the 4 subjects in the IVP cohort who developed MNV during the study period, 75.0% (3/4) continued IVP treatment in addition to anti-VEGF therapy, whereas 25.0% (1/4) chose to stop IVP in favor of anti-VEGF monotherapy. The mean time for MNV onset was 4.5 (±1.8) months after initiation of IVP, and the mean number of anti-VEGF injections given during the study period in these subjects was 4.0 (±1.6) treatments. The brand of anti-VEGF medication employed during the study period in this subgroup were as follows: 50.0% (2/4) bevacizumab, 25.0% (1/4) aflibercept, and 25.0% (1/4) Faricimab. Regarding the CNVM features of the 4 subjects in the IVP cohort who developed MNV during the study period, 50.0% (2/4) were classified as having a Type 1 lesion, 25.0% (1/4) had a Type 2 lesion, and 25.0% (1/4) had a Type 3 lesion. The FA leaking pattern at the time of the MNV diagnosis was occult in 75.0% (3/4) of subjects and classic in 25.0% (1/4) of subjects. At the end of the study period, 25.0% (1/4) of subjects in the IVP cohort were observed to still have evidence of persistent exudation on clinical examination.
There were no cases of retinal vasculitis, vitritis, endophthalmitis, hypotony, or vitreous hemorrhage occurring during the study period for either treatment group. There were no subjects included in the analysis who discontinued complement inhibition therapy during the study period for any reason (except for the 2 subjects mentioned above who developed MNV and opted for anti-VEGF monotherapy). When subgroup analysis was performed in regards to baseline GA size ≤7.5 mm2, the growth rate was not significantly different for either the IVA or IVP treatment cohort (p = 0.45 and p = 0.37, respectively). When subgroup analysis was performed in regards to extrafoveal location of GA, the growth rate was not significantly different for either the IVA or IVP treatment cohort (p = 0.68 and p = 0.31, respectively).
Discussion
Clinical trial outcomes are typically superior to those outcomes reported in the “real-world” for a variety of reasons such as enhanced patient compliance with treatment and follow-up, strict inclusion/exclusion criteria for patient selection, and involvement of only the most motivated patients to receive care for their underlying conditions. In the real world, patients miss follow-up appointments and scheduled treatments, they undergo personalized management strategies according to physician and/or patient preferences that often differ to the FDA-labeling of the treatment, frequency limitations of 29 days and beyond are imposed by most insurance providers for the treatments, and treatments are discontinued or switched for a variety of reasons. Therefore, since most patients will be treated in a setting outside of a clinical trial, there is a need to report real-world outcomes with all novel therapies such as complement inhibition for GA in order to provide patients with meaningful expectations and appropriate counseling prior to initiation of treatment. This study provides novel information on real-world outcomes in AMD patients initiated on IVP or IVA with baseline GA lesion sizes similar to those included in OAKS and DERBY (≥2.5 and ≤17.5 mm2).1
There has been much discussion within the retina specialist community regarding which intravitreal complement inhibition treatment is superior both in regards to clinical efficacy and side-effect profile.5,6 Although both IVP and IVA treat GA by inhibiting the complement cascade system, the point of inhibition is markedly different as detailed above in the Introduction section of this manuscript. This study provides the first comparison between IVA and IVP in regards to efficacy and side-effects in a case-controlled fashion. Indeed, the baseline characteristics between the IVA and IVP cohorts in this study were statistically similar (no significant differences observed across all key baseline features), suggesting that the treatment groups were well-matched in this study. Our study did not demonstrate a significant difference between the IVA and IVP cohorts in functional (vision) or anatomic (total GA lesion growth) outcomes at 12-months, suggesting that both treatments may work-equally well. The rate of GA lesion growth in both cohorts of this study was notably less than the median growth rate of 1.78 mm2/year reported in large observational studies for this patient population.13 Also of note, subgroup analysis as it relates to baseline GA size or location did not reveal a significant correlation with total GA growth over 12 months for either treatment group.
It has been acknowledged that complement inhibition treatment for GA raises the occurrence of CNV compared to sham.14,15 In regards to the rate of development of MNV during the 12 month study period, the rates were similar to that reported in the pivotal clinical trials for both the IVA and IVP cohorts.1–3 However, this study was underpowered to detect a rate difference in MNV between the two treatment groups. The CNVM features in subjects developing MNV during the study period were similar in regards to the type, FA leakage pattern, and outcomes of what has been previously reported in this patient population.10 Although there were no cases of retinal vasculitis, vitritis, endophthalmitis, hypotony, or vitreous hemorrhage occurring during the study period for either treatment group, this study was substantially underpowered to detect a difference for these relatively rare complications.
The mean number of injections administered during the 12-month study period was significantly less in the IVA cohort compared to the IVP cohort. This difference can be accounted for by how each medication has been labeled by the FDA (29–60 days for IVP versus every 4 weeks for IVA). However, since the mean number of injections administered during this study was at a frequency somewhat less than how the treatments were labeled by the FDA and were actually used in the pivotal clinical trials (especially in the IVA cohort where a mean injection number of just 9.05 was administered instead of 12 injections over 12 months), under treatment may have had some impact on the overall efficacy, especially in the IVA cohort. Nevertheless, with this being a real-world study, it might be expected that the overall injection frequency would be less, and the outcomes of this study may in fact be more relevant to those practicing in a setting outside of a clinical trial.
Strengths of this project include the novelty of the information presented in a real-world setting, its use of validated and user-friendly software for GA size determination, and the implementation of a case-controlled design. Limitations of this study consist of its utilization of Snellen acuity with pinhole approximation (as opposed to ETDRS letter scoring), its collection of data retrospectively, and the relatively small number of subjects involved in the analysis. However, this project does provide useful data for retina specialists to counsel their AMD patients when considering IVA or IVP therapy for the management of GA. In conclusion, this real-world study reports that treatment with IVA and IVP have similar visual and anatomic outcomes at 12-months, although subjects undergoing treatment with IVP may receive fewer injections in order to obtain these outcomes. Future studies comparing IVA and IVP should be undertaken, ideally as a randomized clinical trial, in order to further clarify the relative safety and efficacy of these new medications.
Abbreviations
GA, geographic atrophy; AMD, age-related macular degeneration; VEGF, vascular endothelial growth factor; CMT, central macular thickness; OCT, optical coherence tomography; VA, visual acuity; IVA, intravitreal avacincaptad pegol; IVP, intravitreal pegacetacoplan.
Data Sharing Statement
The datasets used and/or analyzed during the current study are available from the corresponding author on reasonable request.
Declarations
The study was approved by the Panhandle Eye Group Institutional Review Board (IORG0009239; IRB00011013-18) in accordance with the Ethical Standards laid down in the Declaration of Helsinki. Informed consent from study participants was waived because this was a retrospective study with no identifying patient information presented.
Funding
There is no funding to report.
Disclosure
The authors report no conflicts of interest in this work.
References
1. Heier JS, Lad EM, Holz FG, et al. Pegcetacoplan for the treatment of geographic atrophy secondary to age-related macular degeneration (OAKS and DERBY): two multicentre, randomised, double-masked, sham-controlled, Phase 3 trials. Lancet. 2023;402(10411):1434–1448. doi:10.1016/S0140-6736(23)01520-9
2. Patel SS, Lally DR, Hsu J, et al. Avacincaptad pegol for geographic atrophy secondary to age-related macular degeneration: 18-month findings from the GATHER1 trial. Eye. 2023;37(17):3551–3557. doi:10.1038/s41433-023-02497-w
3. Khanani AM, Patel SS, Staurenghi G, et al. Efficacy and safety of avacincaptad pegol in patients with geographic atrophy (GATHER2): 12-month results from a randomised, double-masked, phase 3 trial. Lancet. 2023;402(10411):1449–1458. doi:10.1016/S0140-6736(23)01583-0
4. Desai D, Dugel PU. Complement cascade inhibition in geographic atrophy: a review. Eye. 2022;36(2):294–302. doi:10.1038/s41433-021-01765-x
5. Lin JB, Halawa OA, Miller JW, Vavvas DG. Complement inhibition for geographic atrophy: a tempting target with mixed results. J Clin Med. 2021;10(13):2890. doi:10.3390/jcm10132890
6. Spaide RF, Vavvas DG. Complement inhibition for geographic atrophy: review of salient functional outcomes and perspective. Retina. 2023;43(7):1064–1069. doi:10.1097/IAE.0000000000003796
7. Guymer R, Wu Z. Age-related macular degeneration (AMD): more than meets the eye. The role of multimodal imaging in today’s management of AMD-A review. Clin Exp Ophthalmol. 2020;48(7):983–995. doi:10.1111/ceo.13837
8. Sadda SR, Guymer R, Holz FG, et al. Consensus definition for atrophy associated with age-related macular degeneration on OCT: classification of atrophy report 3. Ophthalmology. 2018;125(4):537–548. doi:10.1016/j.ophtha.2017.09.028
9. Schmitz-Valckenberg S, Brinkmann CK, Alten F, et al. Semiautomated image processing method for identification and quantification of geographic atrophy in age-related macular degeneration. Invest Ophthalmol Vis Sci. 2011;52(10):7640–7646. doi:10.1167/iovs.11-7457
10. Rush RB, Klein W, Rush SW, Reinauer R. One-year outcomes in subjects developing macular neovascularization while undergoing avacincaptad pegol therapy for geographic atrophy. Clin Ophthalmol. 2025;19:111–118. doi:10.2147/OPTH.S498985
11. Rush RB, Klein W, Rush SW, Reinauer RM. Real-world outcomes in pre-existing neovascular age-related macular degeneration subjects undergoing avacincaptad therapy for geographic atrophy. Clin Ophthalmol. 2024;18:4011–4018. doi:10.2147/OPTH.S497678
12. Rush RB, Simunovic MP, Vandiver L, et al. Treat-and-extend bevacizumab for neovascular age-related macular degeneration: the importance of baseline characteristics. Retina. 2014;34(5):846–852. doi:10.1097/IAE.0000000000000033
13. Fleckenstein M, Mitchell P, Freund KB, et al. The progression of geographic atrophy secondary to age-related macular degeneration. Ophthalmology. 2018;125(3):369–390. doi:10.1016/j.ophtha.2017.08.038
14. Liao DS, Grossi FV, El Mehdi D, et al. Complement C3 inhibitor pegcetacoplan for geographic atrophy secondary to age related macular degeneration: a randomized Phase 2 trial. Ophthalmology. 2020;127(2):186–195. doi:10.1016/j.ophtha.2019.07.011
15. Wykoff CC, Rosenfeld PJ, Waheed NK, et al. Characterizing new-onset exudation in the randomized phase 2 FILLY trial of complement inhibitor pegcetacoplan for geographic atrophy. Ophthalmology. 2021;128(9):1325–1336. doi:10.1016/j.ophtha.2021.02.025
 © 2025 The Author(s). This work is published and licensed by Dove Medical Press Limited. The
full terms of this license are available at https://www.dovepress.com/terms.php
and incorporate the Creative Commons Attribution
- Non Commercial (unported, 4.0) License.
By accessing the work you hereby accept the Terms. Non-commercial uses of the work are permitted
without any further permission from Dove Medical Press Limited, provided the work is properly
attributed. For permission for commercial use of this work, please see paragraphs 4.2 and 5 of our Terms.
© 2025 The Author(s). This work is published and licensed by Dove Medical Press Limited. The
full terms of this license are available at https://www.dovepress.com/terms.php
and incorporate the Creative Commons Attribution
- Non Commercial (unported, 4.0) License.
By accessing the work you hereby accept the Terms. Non-commercial uses of the work are permitted
without any further permission from Dove Medical Press Limited, provided the work is properly
attributed. For permission for commercial use of this work, please see paragraphs 4.2 and 5 of our Terms.