")
Back to Journals » Clinical Ophthalmology » Volume 18
Refractive Predictability of Two Intraocular Lens Power Formulas in Long, Medium, and Short Eyes Using a Swept Source Optical Coherence Tomography Biometer
Authors Blehm C , Balest Z, Blehm AC, Hall B
Received 22 March 2024
Accepted for publication 21 August 2024
Published 5 September 2024 Volume 2024:18 Pages 2531—2537
DOI https://doi.org/10.2147/OPTH.S470158
Checked for plagiarism Yes
Review by Single anonymous peer review
Peer reviewer comments 3
Editor who approved publication: Dr Scott Fraser
Clayton Blehm,1 Zach Balest,1 Ashton C Blehm,1 Brad Hall2
1North Georgia Eye Associates, Gainesville, GA, USA; 2Sengi, Penniac, NB, Canada
Correspondence: Clayton Blehm, North Georgia Eye Associates, 2061, Beverly Road, Gainesville, GA, 30501, USA, Tel +1 770-532-4444, Email [email protected]
Purpose: To compare the refractive predictability of Argos measurements with Barrett Universal II (BUII) and Barrett True Axial Length (BTAL) formulas in a large sample of long, medium, and short axial length (AL) eyes.
Methods: A retrospective chart review identified 445 eyes of 247 patients for inclusion. The Argos was used for preoperative biometry, and BUII formula for intraocular lens (IOL) power calculations. Back calculations were performed using data from the Argos for the BTAL formula. Data were collected for postoperative absolute prediction error (APE), refractive outcomes, and monocular uncorrected and distance corrected visual acuities at distance (UDVA, CDVA).
Results: Overall, mean APE was 0.36 ± 0.33 D for BUII and for 0.34 ± 0.32 D BTAL (p = 0.04). In short AL eyes, mean APE was 0.45 ± 0.37 D for BUII and for 0.37 ± 0.31 D BTAL (p < 0.001). No significant differences between BUII and BTAL were identified for long AL or medium AL eyes. The percentages of eyes with APE of 0.5 D or less in long, medium, and short eyes were 79%, 79% and 51%, respectively, for BUII and 82%, 78% and 69%, respectively, for BTAL.
Conclusion: The prediction accuracies were high with both the BUII and BTAL formulas in long, medium, and short eyes, leading to excellent refractive outcomes. The BTAL formula may have lower absolute prediction error in short eyes compared to BUII.
Plain Language Summary: When the natural lens inside the eye becomes opaque, it can be replaced during cataract surgery with a clear artificial intraocular lens (IOL). It is critical for good postoperative outcomes that the optimal power for the IOL is implanted. Biometers are devices used to measure the eye and typically have built-in formulas to calculate the most appropriate IOL power for implantation. However, it is challenging to select the optimal power in eyes that are longer or shorter than average. The purpose of this study was to compare the refractive predictability of a novel biometer using two IOL power calculation formulas in a large sample of long, medium, and short eyes. The results of this study suggest that predictability was high with both formulas in long, medium, and short eyes, leading to excellent refractive outcomes.
Keywords: Argos, biometry, SS-OCT, BUII, BTAL
Introduction
Refractive outcomes are fundamental to the success of cataract surgery and intraocular lens (IOL) implantation. To achieve good refractive outcomes, surgeons use optical biometry, which allows precise and accurate measurements of the eye including keratometry, anterior chamber depth (ACD), and axial length (AL). These measurements can then be combined with the latest IOL power formulas to calculate the optimal power for the targeted refraction.
Optical biometers are available with a variety of technologies including partial coherence interferometry (PCI),1 optical low coherence interferometry (OLCI),2 optical low coherence reflectometry (OLCR),3 and swept-source optical coherence tomography (SS-OCT).4,5 Many optical biometers are also available with the latest IOL power formulas preprogrammed, and are reported to provide a high proportion of eyes within 0.5 D of target refraction.6–8
Though optical biometry technology and IOL power formulas are continuing to improve, hitting the refractive target in eyes with long and short AL remains a challenge. The consequence for missing the target in long eyes is often residual hyperopia.9,10 For short eyes, slight changes in the final IOL position can have significant effects on residual refractive error.11 For long and short eyes, sum-of-segments biometry has been reported to improve refractive outcomes compared to using a single refractive index.12–14
The Argos (Movu, a Santec company) is a SS-OCT biometer that utilizes sum-of-segments to determine AL. Refractive indices of 1.376, 1.410, and 1.336 are used for the cornea, lens, aqueous, and vitreous, respectively. This enables AL calculations to be adjusted based on the variability in the lengths of each segment. The Argos is available preprogrammed with the Barrett Universal II (BUII) formula, an update from the Barrett Universal I formula,15 and the Barrett True Axial Length (BTAL) formula, which is able to take advantage of the sum-of-segments approach. We recently reported on differences in outcomes between the Argos with BUII versus BTAL, with BTAL appearing to perform better than BUII in short eyes.16 However, the sample size was too small to draw definitive conclusions.
The purpose of this study is to compare the refractive predictability of Argos measurements with BUII and BTAL in a large sample of long, medium, and short eyes.
Methods
This was a non-interventional retrospective chart review. An institutional review board (Salus IRB, approval #CB-23-01) reviewed and approved the study. Salus IRB granted a waiver of informed consent as this was a non-interventional retrospective chart review of anonymized data. All data were maintained with confidentiality. An independent institutional review board was used as this study was conducted in private practice. The study was retrospective and was thus not required to be registered in a clinical trials database (such as clinicaltrials.gov). The study followed Good Clinical Practice (GCP), the tenets of the Declaration of Helsinki, and International Harmonization (ICH) guidelines.
Consecutive charts were reviewed from January 2020 to December 2023 to identify eyes that met the inclusion/exclusion criteria. Inclusion criteria were adults, previous uncomplicated cataract surgery, corrected visual outcomes of 20/40 or better, Clareon monofocal (SY60WF or CNA0T0, Alcon Vision, LLC) implantation, biometry performed with the Argos SS-OCT biometer, and IOL calculations performed with the Barrett Universal II (BUII) formula. Charts were excluded if there was ocular pathology noted, moderate-severe corneal/retinal pathology, severe dry eye disease, or history of corneal refractive surgery.
Data were collected from preoperative and 1 month or greater postoperative visits. Biometry was performed using the Argos (software version 2.18.1263) and the BUII formula was used to calculate IOL power, targeting plano or first minus. Predicted spherical equivalents using the Barrett True Axial Length (BTAL) formula were back-calculated using the built-in software from the Argos. An a-constant of 119.1 was used for power calculations. Two experienced surgeons (CB and ZB) performed all surgeries using microincision phacoemulsification. Subjective refraction was done with a Snellen chart at 20 ft, and data were converted to logMAR for analysis. Absolute prediction error (APE) was determined by calculating the absolute value of the difference between the postoperative spherical equivalent and the predicted spherical equivalent.
The primary outcome measure was the percentage of eyes with APE for spherical equivalent ≤0.5 D using Argos with both BUII and BTAL formulas in each axial length (AL) group: long (>24.5 mm), medium (22.6 mm to 24.4 mm), short (< 22.5mm). Other outcome measures were median APE and mean APE for BUII and BTAL. The cutoffs for long (24.50 mm) and short eyes (22.50 mm) reported by Shammas and Jabre,17 were used to define the axial length groups; however, axial lengths of exactly 22.50 and 24.50 mm were included in the short eye and long eye groups, respectively.
The software programming environment R (version 4.3.1, the R Foundation for Statistical Computing, Vienna, Austria) was used for all analysis. Differences in the percentage of eyes with APE ≤ 0.5 D for both BUII and BTAL formulas in each axial length group were compared using the McNemar test. Mean APE was compared as suggested by Holladay et al.18 However, due to the inclusion of a large sample of long and short eyes, mean APE was not zeroed with lens constant optimization for each formula. The SEQ_PE function from the supplementary materials of Holladay et al18 was used for statistical comparisons of mean APE. Linear mixed effects models, adjusted for cases where more than 1 eye was included for a patient and for multiple measurements from the same patient, were used to confirm significant differences in prediction error. Final p-values were adjusted using the Hochberg method to account for multiple comparisons, and a final p < 0.05 was considered significant. Using R for sample size calculations, we estimated that 92 long, 225 medium, and 74 short eyes (391 eyes total) would be required, assuming a power of 80% and alpha of 0.05.
Results
The chart review identified 445 eyes (247 patients) that were eligible for inclusion. This comprised 92 long, 278 medium, and 75 short AL eyes. Preoperative and patient demographics are summarized in Table 1.
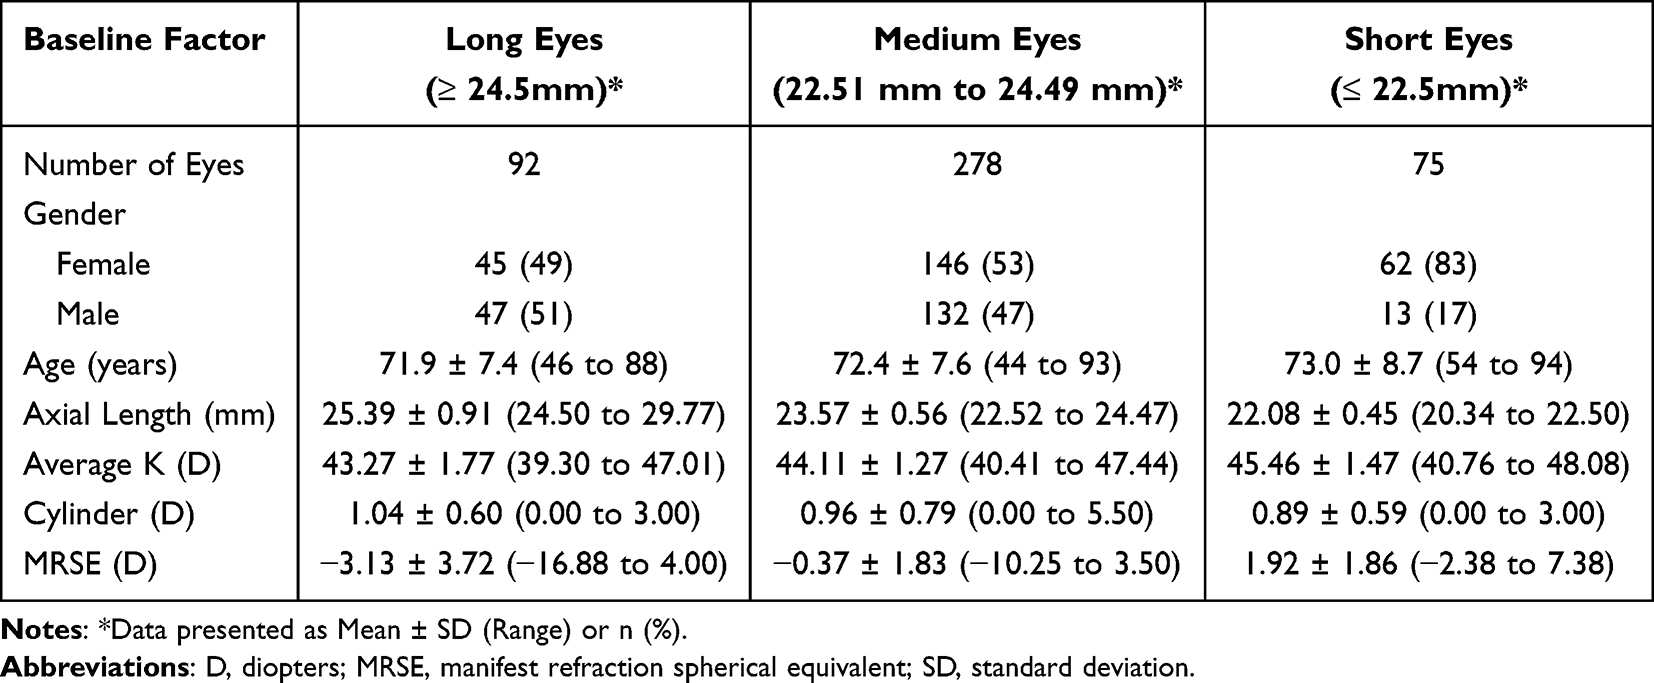 |
Table 1 Preoperative and Demographic Data |
The prediction errors (spherical equivalent) for BUII and BTAL are summarized in Table 2. There were no significant differences observed between BUII and BTAL for the percentage of eyes with APE ≤ 0.50 D overall, or in long, medium, and short AL eyes (p > 0.05). In addition, mean APE was not significantly different for long or medium AL eyes between BUIII and BTAL (p > 0.05). However, mean APE was significantly lower for BTAL compared to BUII overall (p = 0.04) and for short AL eyes (p < 0.001) using the SEQ_PE function18 and was confirmed using linear mixed effect models.
 |
Table 2 Prediction Error for Each Axial Length Group |
The postoperative refractive outcomes are summarized in Table 3. Generally, the refractive outcomes were acceptable at all AL. The percentages of eyes with ≤0.5 D of residual cylinder were 48%, 56%, and 59% for long, medium, and short AL eyes. The percentages of eyes with ≤0.5 D MRSE were 79%, 87%, and 80% for long, medium, and short AL eyes.
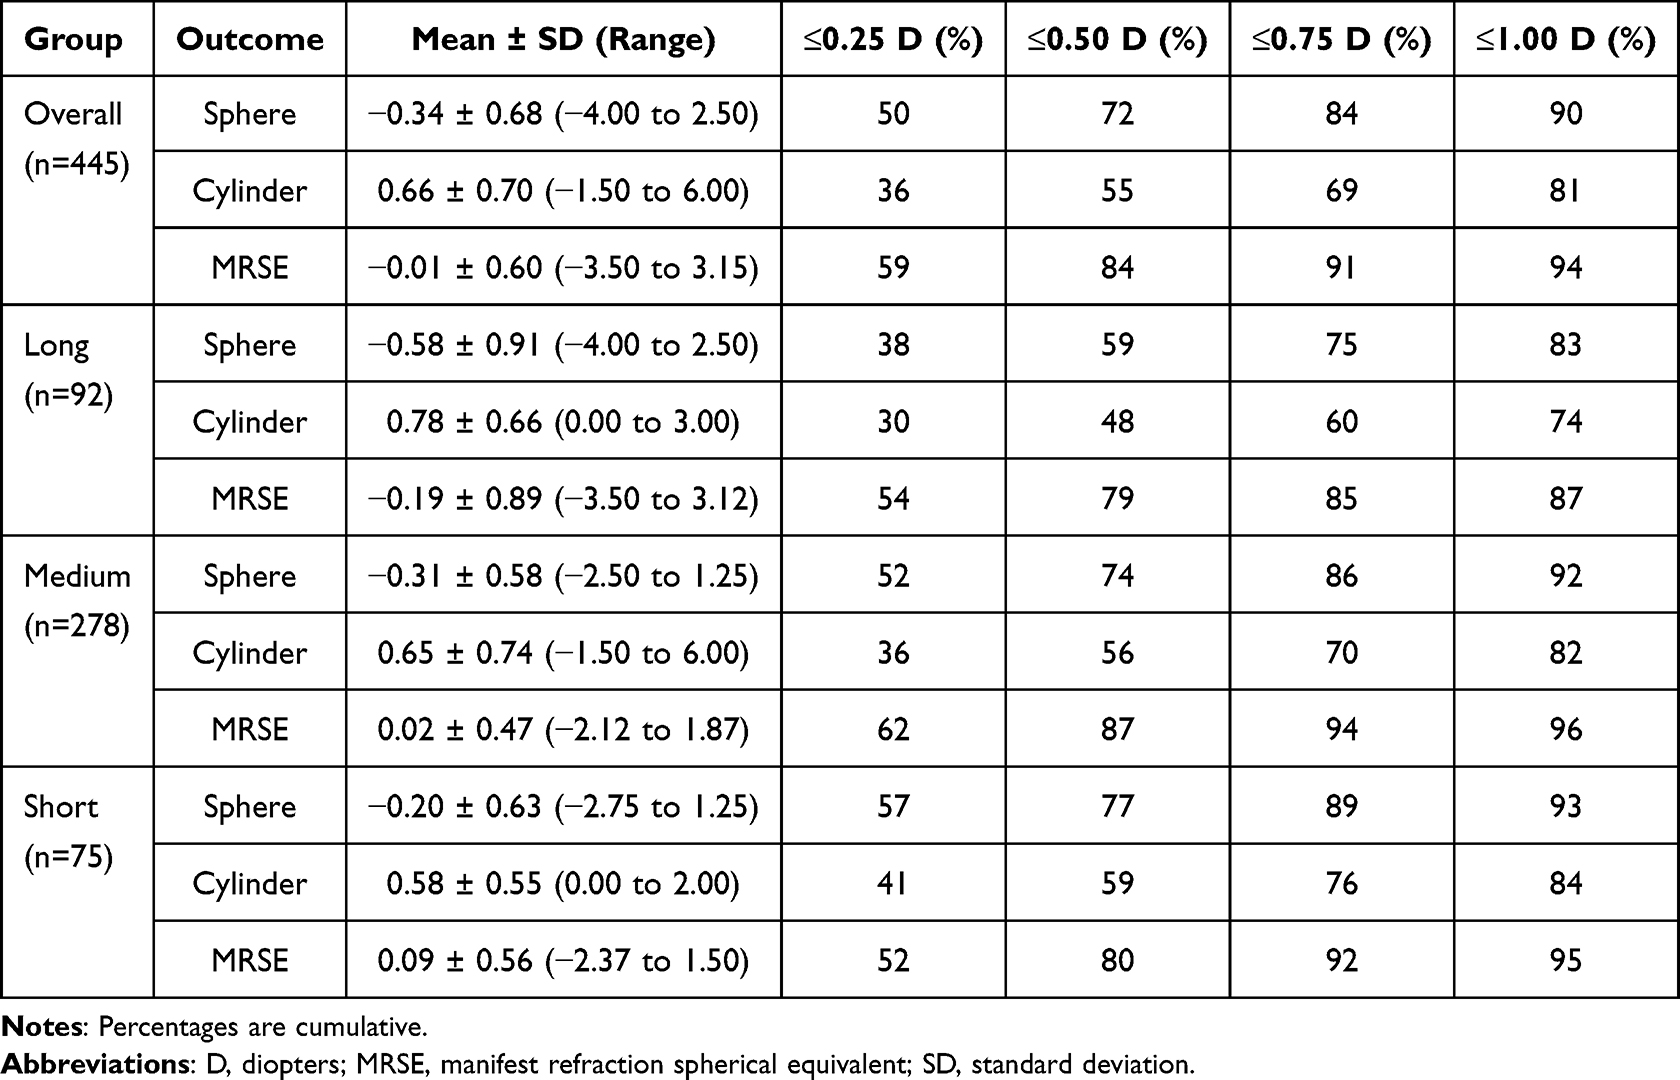 |
Table 3 Refractive Outcomes for Each Axial Length Group |
Postoperative visual outcomes are shown in Figure 1 and 2. Uncorrected visual acuities were acceptable, with 72%, 82% and 79% of long, medium, and short AL eyes, respectively, 20/32 or better. As expected, corrected distance visual acuities were higher, with 94%, 94% and 93% of long, medium, and short AL eyes, respectively, 20/25 or better.
 |
Figure 1 Cumulative postoperative monocular UDVA between groups. |
 |
Figure 2 Cumulative postoperative monocular CDVA between groups. |
Discussion
Hitting the refractive target with cataract surgery and IOL implantation is critical for happy patients—and happy surgeons. Refractive outcomes are influenced by preoperative biometry and IOL power calculation formulas. Achieving a refraction within 0.5 D of target may only occur in 73% of eyes;19 however, long and short axial length eyes present an even greater challenge. In this study, we compared the refractive predictability of Argos measurements with BUII and BTAL in long, medium, and short eyes.
We previously reported on a potential difference in APE in short eyes between BUII and BTAL with the Argos.16 In the current study, we observed a significant difference in mean APE between the BTAL and BUII formulas in short eyes, confirming our previous report. In the current study, mean APE in short eyes with BTAL was 0.37 D compared to 0.45 D with BUII (n = 75). Our previous study16 reported that mean APE in short eyes with BTAL was 0.31 D compared to 0.33 D with BUII (n = 29). However, Shammas et al20 observed minimal differences in short eyes, with mean APE for BTAL 0.33 D compared to 0.35 D with BUII (n = 78). The study by Shammas et al20 was also retrospective and had a similar sample size to our current study; however, differences may be due to differences in surgical technique or A-constant optimization.
We did not observe any significant differences in mean APE between BTAL and BUII for long eyes. This is consistent with previous reports.16,20 In the long eyes, the percentages with APE 0.5 D or less were 79% for BTAL and 82% for BUII (n = 92). Shammas et al20 reported the percentages of eyes with APE 0.5 D or less were 82% for BTAL and 83% for BUII (n = 102). We previously reported 90% for BUII and 84% for BTAL (n = 55).16 In addition, Omoto et al21 reported the percentages of eyes with APE 0.5 D or less were 70% in long eyes for BUII (n = 30). Differences between our results and other published reports may be due to differences in surgical technique or A-constant optimization. However, the results of our study and others suggest similar results with BUII and BTAL in long eyes.
A limitation of this study was the inclusion of both eyes from some patients, which could introduce bias. Nevertheless, linear mixed effects models, adjusted for cases where more than 1 eye was included for a patient and for multiple measurements from the same patient, confirmed our results. Another limitation was the retrospective study design. However, with approximately 450 eyes in this study, a retrospective design has significant time and cost advantages. Finally, the data analyzed was from a single site and may reduce applicability to other surgeons.
Conclusion
The results of this study suggest that the prediction accuracies were high with both the BUII and BTAL formulas in long, medium, and short eyes, leading to excellent refractive outcomes. The BTAL formula may have lower absolute prediction error in short eyes compared to BUII.
Acknowledgments
This paper will be presented at the 2024 American Society of Cataract and Refractive Surgery (ASCRS) Annual Meeting as an electronic poster.
Funding
This study was supported with an investigator-initiated study grant (88553537) from Alcon Vision, LLC, Fort Worth, TX, USA.
Disclosure
Brad Hall reports that he has received consulting fees from Ace Vision Group. The authors report no other conflicts of interest for this work.
References
1. Vogel A, Dick BH, Krummenauer F. Reproducibility of optical biometry using partial coherence interferometry: intraobserver and interobserver reliability. J Cataract Refract Surg. 2001;27:1961–1968. doi:10.1016/S0886-3350(01)01214-7
2. Hoffer KJ, Shammas HJ, Savini G, Huang J. Multicenter study of optical low-coherence interferometry and partial-coherence interferometry optical biometers with patients from the United States and China. J Cataract Refract Surg. 2016;42:62–67. doi:10.1016/j.jcrs.2015.07.041
3. Hoffer KJ, Shammas HJ, Savini G. Comparison of 2 laser instruments for measuring axial length. J Cataract Refract Surg. 2010;36:644–648. doi:10.1016/j.jcrs.2009.11.007
4. Montes-Mico R, Pastor-Pascual F, Ruiz-Mesa R, Tana-Rivero P. Ocular biometry with swept-source optical coherence tomography. J Cataract Refract Surg. 2021;47:802–814. doi:10.1097/j.jcrs.0000000000000551
5. Yang CM, Lim DH, Kim HJ, Chung TY, Grulkowski I. Comparison of two swept-source optical coherence tomography biometers and a partial coherence interferometer. PLoS One. 2019;14:e0223114. doi:10.1371/journal.pone.0223114
6. Barrett GD. An improved universal theoretical formula for intraocular lens power prediction. J Cataract Refract Surg. 1993;19:713–720. doi:10.1016/S0886-3350(13)80339-2
7. Cheng H, Kane JX, Liu L, Li J, Cheng B, Wu M. Refractive Predictability Using the IOLMaster 700 and Artificial Intelligence-Based IOL Power Formulas Compared to Standard Formulas. J Refract Surg. 2020;36:466–472. doi:10.3928/1081597X-20200514-02
8. Melendez RF, Smits G, Nguyen T, Ruffaner-Hanson CD, Ortiz D, Hall B. Comparison of astigmatism prediction accuracy for toric lens implantation from two swept-source optical coherence tomography devices. Clin Ophthalmol. 2022;16:3795–3802. doi:10.2147/OPTH.S378019
9. Zaldivar R, Shultz MC, Davidorf JM, Holladay JT. Intraocular lens power calculations in patients with extreme myopia. J Cataract Refract Surg. 2000;26:668–674. doi:10.1016/S0886-3350(00)00367-9
10. Wang L, Shirayama M, Ma XJ, Kohnen T, Koch DD. Optimizing intraocular lens power calculations in eyes with axial lengths above 25.0 mm. J Cataract Refract Surg. 2011;37:2018–2027. doi:10.1016/j.jcrs.2011.05.042
11. Hoffer KJ, Savini G. IOL power calculation in short and long eyes. Asia Pac J Ophth. 2017;6:330–331. doi:10.22608/APO.2017338
12. Shammas HJ, Shammas MC, Jivrajka RV, Cooke DL, Potvin R. Effects on IOL power calculation and expected clinical outcomes of axial length measurements based on multiple vs single refractive indices. Clin Ophthalmol. 2020;14:1511–1519. doi:10.2147/OPTH.S256851
13. Wang L, Cao D, Weikert MP, Koch DD. Calculation of Axial Length Using a Single Group Refractive Index versus Using Different Refractive Indices for Each Ocular Segment: theoretical Study and Refractive Outcomes. Ophthalmology. 2019;126:663–670. doi:10.1016/j.ophtha.2018.12.046
14. Cooke DL, Cooke TL. Approximating sum-of-segments axial length from a traditional optical low-coherence reflectometry measurement. J Cataract Refract Surg. 2019;45:351–354. doi:10.1016/j.jcrs.2018.12.026
15. Barrett GD. Intraocular lens calculation formulas for new intraocular lens implants. J Cataract Refract Surg. 1987;13:389–396. doi:10.1016/S0886-3350(87)80037-8
16. Blehm C, Hall B. Refractive predictability of a swept source optical coherence tomography biometer in long and short eyes implanted with extended depth of focus intraocular lenses. Clin Ophthalmol. 2023;17:3525–3530. doi:10.2147/OPTH.S430535
17. Shammas HJ, Jabre JF. Validating e-norms methodology in ophthalmic biometry. BMJ Open Ophth. 2020;5:e000500. doi:10.1136/bmjophth-2020-000500
18. Holladay JT, Wilcox RR, Koch DD, Wang L. Review and recommendations for univariate statistical analysis of spherical equivalent prediction error for IOL power calculations. J Cataract Refract Surg. 2021;47:65–77. doi:10.1097/j.jcrs.0000000000000370
19. Lundstrom M, Dickman M, Henry Y, et al. Risk factors for refractive error after cataract surgery: analysis of 282 811 cataract extractions reported to the European Registry of Quality Outcomes for cataract and refractive surgery. J Cataract Refract Surg. 2018;44:447–452. doi:10.1016/j.jcrs.2018.01.031
20. Shammas HJ, Taroni L, Pellegrini M, Shammas MC, Jivrajka RV. Accuracy of newer intraocular lens power formulas in short and long eyes using sum-of-segments biometry. J Cataract Refract Surg. 2022;48:1113–1120. doi:10.1097/j.jcrs.0000000000000958
21. Omoto MK, Torii H, Masui S, Ayaki M, Tsubota K, Negishi K. Ocular biometry and refractive outcomes using two swept-source optical coherence tomography-based biometers with segmental or equivalent refractive indices. Sci Rep. 2019;9:6557. doi:10.1038/s41598-019-42968-3
 © 2024 The Author(s). This work is published and licensed by Dove Medical Press Limited. The
full terms of this license are available at https://www.dovepress.com/terms.php
and incorporate the Creative Commons Attribution
- Non Commercial (unported, 3.0) License.
By accessing the work you hereby accept the Terms. Non-commercial uses of the work are permitted
without any further permission from Dove Medical Press Limited, provided the work is properly
attributed. For permission for commercial use of this work, please see paragraphs 4.2 and 5 of our Terms.
© 2024 The Author(s). This work is published and licensed by Dove Medical Press Limited. The
full terms of this license are available at https://www.dovepress.com/terms.php
and incorporate the Creative Commons Attribution
- Non Commercial (unported, 3.0) License.
By accessing the work you hereby accept the Terms. Non-commercial uses of the work are permitted
without any further permission from Dove Medical Press Limited, provided the work is properly
attributed. For permission for commercial use of this work, please see paragraphs 4.2 and 5 of our Terms.