")
Back to Journals » Clinical Ophthalmology » Volume 18
Retinal and Choroidal Vascularization Parameters in Patients with Type 2 Diabetes Without Diabetic Retinopathy
Authors Małyszczak A , Przeździecka-Dołyk JW, Szydełko-Paśko U , Misiuk-Hojło M
Received 28 May 2024
Accepted for publication 12 September 2024
Published 25 October 2024 Volume 2024:18 Pages 3019—3029
DOI https://doi.org/10.2147/OPTH.S480207
Checked for plagiarism Yes
Review by Single anonymous peer review
Peer reviewer comments 2
Editor who approved publication: Dr Scott Fraser
Artur Małyszczak,1 Joanna Wiktoria Przeździecka-Dołyk,2 Urszula Szydełko-Paśko,1 Marta Misiuk-Hojło1
1Department and Clinic of Ophthalmology, Wroclaw Medical University, Wroclaw, Dolnoslaskie, Poland; 2Ophthalmology Clinical Center SPEKTRUM, Research and Development Center CREO, Wroclaw, Dolnoslaskie, Poland
Correspondence: Artur Małyszczak, Department and Clinic of Ophthalmology, Wroclaw Medical University, Borowska 213, Wrocław, Dolnoslaskie, 50-556, Poland, Tel +71 736 43 00, Email [email protected]
Purpose: The purpose of this study was to evaluate retinal and choroidal vascularization parameters in patients with type 2 diabetes mellitus (DM), without diabetic retinopathy (DR), and to compare them to healthy controls.
Patients and methods: Seventy-four eyes from 74 patients (40 eyes in the DM group and 34 eyes in the control group) were included in the study. Optical coherence tomography angiography RTVue XR Avanti was used to obtain 3× 3mm scans of the macula. The choroidal vascularity index (CVI), superficial and deep capillary plexus vascular densities (SCP and DCP, respectively), and choroidal thickness (CT) were measured.
Results: In the diabetic group, SCP was lower in the superior and nasal segments (48.68 vs 50.62, p=0.02; 45.50 vs 48.82, p=0.02, respectively). The DCP did not differ between the groups. CVI was significantly lower in the study group in all measured segments, including central and parafoveal (31.73 vs 48.86 and 50.32 vs 59.58, p< 0.001, respectively). CT was larger in the study group only at the center of the macula (281.89μm vs 268.37μm p< 0.001) and in the inferior segment (337.47μm vs 329.40μm, p< 0.001). In the multivariate regression, clinical and vascularization parameters affecting CVI and CT were analyzed after adjusting for age and sex. Decreased central CVI was associated with the presence of DM, lower central SCP, and bigger foveal avascular zone area (b=− 0.68, b=0.47, b=− 0.21). Parafoveal CVI was also negatively affected by DM (b= − 0.46) and positively by parafoveal SCP (b= 0.44). Increased central CT was found to be positively associated with higher central SCP (b=0.48) and male sex (b=0.20).
Conclusion: The results of our study confirmed a reduction of SCP and CVI in diabetic patients without DR. DM and SCP are age and sex independent parameters affecting CVI. Central CT is affected by SCP and sex, rather than the presence of diabetes.
Keywords: choroidal vascularity index, choroidal thickness, OCTA, diabetes
Introduction
Diabetic retinopathy (DR) is the primary cause of blindness among working-age adults globally, as it affects up to 35% of patients with diabetes.1 Hyperglycemia and its resulting complications, including oxidative stress and inflammation, lead to damage to the vascular endothelium and pericytes that form the retinal vasculature.2 Although most diabetes-related vision loss is caused by damage to the retina, choroidal circulation also appears to play an important role in the pathophysiology of diabetic eye disease.3 This is particularly important because the choroid is responsible for nourishing the outer layer of the retina, primarily the fovea.4
Previous studies have shown impaired vascularization of the retinal plexuses in patients with diabetes. Parameters representing these, such as superficial capillary plexus density (SCP), deep capillary plexus density (DCP), and foveal avascular zone area (FAZ), are correlated with the severity of diabetic retinopathy.5,6 However, the relationship between choroidal parameters and diabetes has not been clearly defined. One of the first parameters developed to describe the state of the choroid was choroidal thickness (CT). Some researchers report thicker choroid in patients with diabetes without DR, while others report a decrease from the early stages of the disease.7–10 Additionally, CT has been found to be depended on factors such as age and axial length.11,12 In the search for a parameter that can accurately determine the state of the choroid, in 2016 Agrawal et al proposed the choroidal vascularity index (CVI). Since CVI was developed, it has been shown to be reduced in diabetic patients and to correlate with DR progression.9,13–17 However, some studies do not confirm the difference in CVI between healthy population and diabetic patients without DR.18,19 As the current state of knowledge is inconclusive, there is a need to assess retinal and choroidal vascularization parameters in patients with diabetes to fully understand how diabetes affects the vascular bed of the eye, before diabetic retinopathy lesions appear.
The purpose of our study was to compare choroidal and retinal vascularization parameters, CVI, CT, SCP, DCP, and FAZ, in patients with type 2 diabetes without diabetic retinopathy to a healthy control group. Additionally, we aimed to evaluate the clinical and vascular factors that affect CT and CVI values. Understanding these relationships is crucial for fully comprehending the pathophysiology of DR.
Materials and Methods
This observational study included patients diagnosed with type 2 diabetes without diabetic retinopathy and healthy controls. The exclusion criteria were age < 18 years, ocular diseases that may influence retinal and choroidal circulation (age-related macular degeneration, glaucoma, macular edema, central serous chorioretinopathy, uveitis), type 1 diabetes, intraocular pressure > 21 mmHg, and previous ocular treatment. HbA1C and hypertension history data were collected. Systolic and diastolic blood pressure were measured using an automatic arm blood pressure monitor. Patients underwent a complete ophthalmological examination, including best-corrected visual acuity on a Snellen chart (upper limit of 1.0), slit-lamp anterior segment and fundus examination, air-puff intraocular pressure measurement (TRK-2p, Topcon, Japan), and axial length measurement (ARGOS biometer, Alcon, Switzerland). RTVue XR Avanti (Optovue Inc., Fremont, CA, USA) spectral domain optical coherence tomography (SD-OCT) was used to obtain 3×3 mm OCT scans of the macula. Angio-OCT, visualizing the SCP and DCP, was performed, and their densities were calculated using built-in software (Figure 1). All the measurements were performed under the same room lighting conditions in the evening.
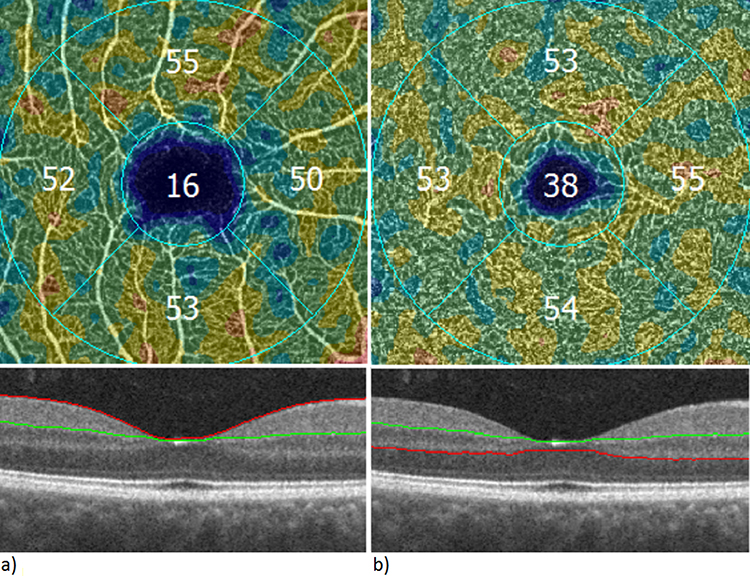 |
Figure 1 Superficial (a) and deep (b) capillary plexus densities. |
Raw OCT files, including the 3×3 mm area centered on the fovea, were analyzed using MATLAB (R2018a, MathsWorks, Inc., Natick, MA, USA). The FAZ area was calculated using an active contour method and a low-pass filter, as described in more detail in a study by one of the co-authors.20 Choroidal thickness was calculated as the distance between Bruch’s membrane and the border of the choroid-scleral interface called the choroidoscleral junction (CSJ), using the automated method of CSJ-type evaluation and visibility of ciliary vessels. Artificial intelligence and machine learning libraries of CSJ types, visibility, and location characteristics of ciliary vessels were used to enable good reproducibility of the CSJ line. Each scan was used to create a 3D model of the choroidal space with a centration on the macula, and the ETDRS chart was plotted over the choroid. The central region was defined as a 1.0 mm diameter circle around the center of the fovea. The parafoveal area, extending 2.0 mm around the central region, was divided into four quadrants (superior, nasal, inferior, and temporal). OCT scans were converted from grayscale to binary images. The binarization method was used to calculate the luminal area (LA), defined as the area of dark pixels, and the total choroidal area (TCA). The choroidal vascularity index was calculated using the formula CVI = LA/TCA, as described by Agraval et al.21 During the regression analysis of macular parameters, the values for SCP, DCP, CVI, and CT within the parafoveal quadrants were averaged and presented as a single combined parameter. For each participant, only one eye with a better image quality was selected for analysis.
Statistical Analysis
Statistical analysis was conducted using Statistica Software version 13.3 (TIBCO Statistica 1984–2017 TIBCO Software Inc). Normality of the distribution was assessed using the Lilliefors test. Intergroup comparisons were performed using the Mann–Whitney U-test for continuous variables without a normal distribution and the Student’s t-test for variables with a normal distribution. The equality of variance was assessed using Levene’s test. Univariate linear regression was performed with central CT, parafoveal CT, central CVI, and parafoveal CVI as dependent variables, and clinical and vascularization parameters as independent variables. Subsequently, multivariate linear regression was conducted, incorporating all parameters that were statistically significant in the univariate regression along with age and sex, regardless of their significance in the univariate analysis. Data in tables is presented as means.
Results
The characteristics of the study population are summarized in Table 1. A total of 74 eyes of 74 patients were included in the study, with 40 eyes in the DM group and 34 eyes in the control group. The study group was not statistically significantly older (mean age 57.59 years vs 52.74 years, p=0.09), but it had fewer women compared to the control group (45% vs 67.65%, p=0.05). The groups did not differ in terms of systolic and diastolic blood pressure, or presence of hypertension and ocular features including visual acuity, intraocular pressure, axial length and spherical equivalent of refractive error. The image quality was also similar in both the groups.
 |
Table 1 Clinical Characteristics |
Choroidal thickness was greater in the study group only at the center of the macula (281.89 µm vs 268.37 µm p<0.001) and in the inferior segment (337.47 µm vs 329.40 µm p<0.001). In the diabetic group, FAZ was larger (0.40 mm2 vs 0.33 mm2, p=0.01), and the SCP was lower in the superior and nasal segments (48.68 vs 50.62, p=0.02; 45.50 vs 48.82, p=0.02, respectively). The DCP did not differ between the groups. The choroidal vascularity index was significantly lower in the study group than in the control group for all the segments (Table 2). Considering the potential effect of sex on choroidal parameters, a subgroup analysis with an age and sex matched data was performed. As in the main analysis, the diabetic group showed an increase in CT in the central and inferior segments and a decrease in CVI in every segment (Supplementary Tables 1 and 2).
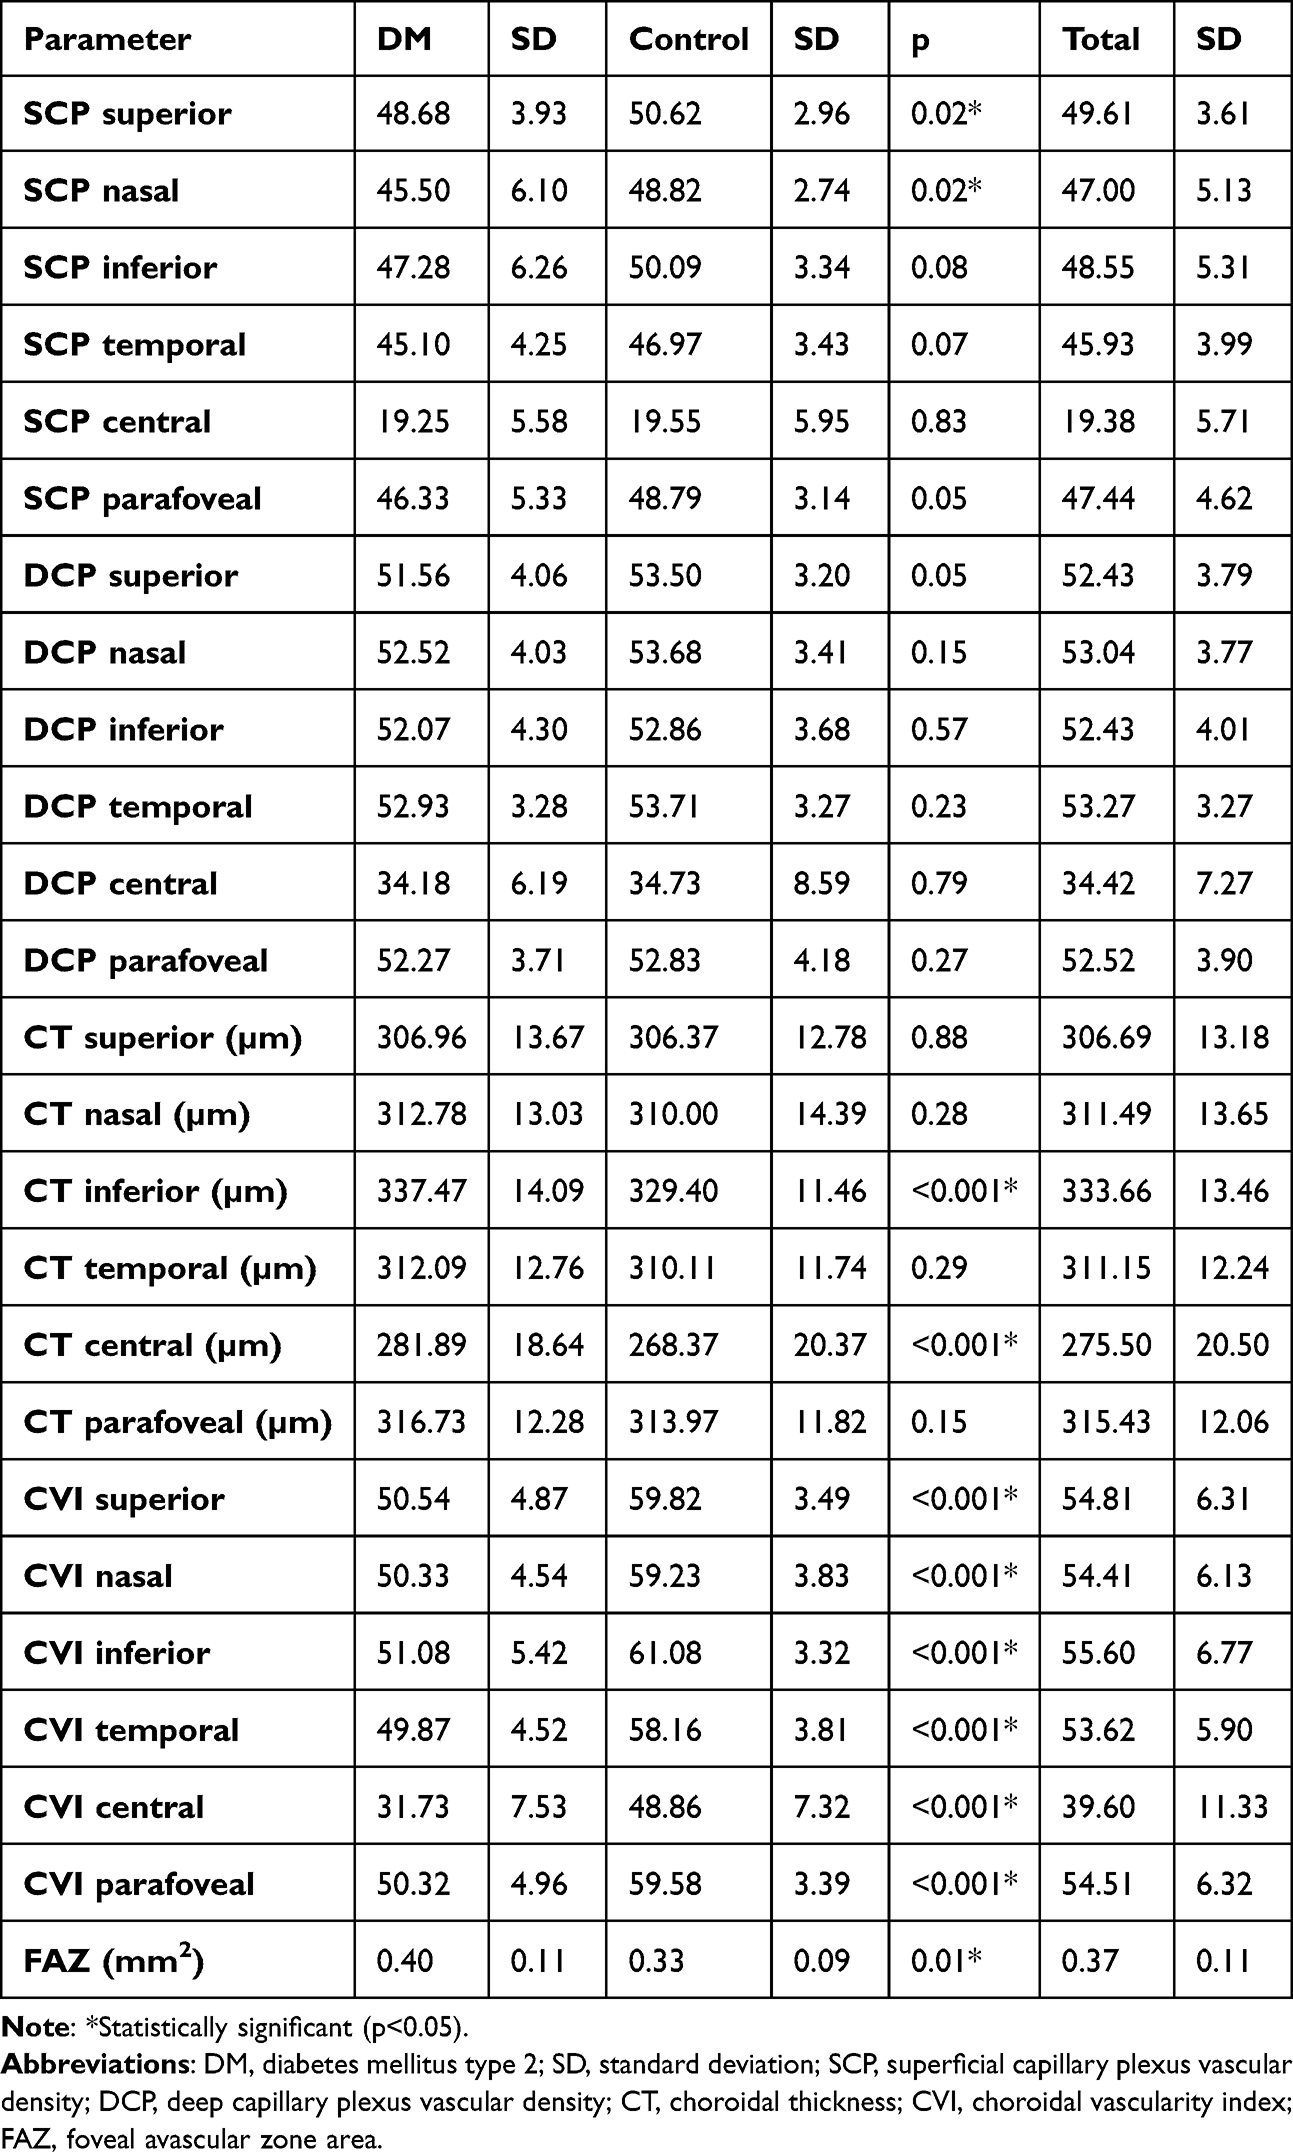 |
Table 2 Comparison of Vascularization Parameters |
Choroidal Thickness
In the univariate linear regression analysis, central CT was found to be significantly associated with several clinical characteristics and vascularization parameters (Table 3). Specifically, an increase in central CT was associated with male sex (b = 0.47, p <0.001), presence of DM (b = 0.33, p <0.001), and longer AXL (b = 0.37, p <0.001). Regarding vascularization parameters, greater central CT was associated with higher central SCP (b = 0.63, p <0.001) and central DCP (b = 0.72, p <0.001). In contrast, an increase in central CT was negatively associated with bigger FAZ area (b = −0.50, p <0.001) and greater parafoveal CVI (b = −0.32, p = 0.01). In the multivariate analysis, after adjusting for age and sex, central CT was found to be increasing with higher central SCP (b = 0.48, p <0.001) and male sex (b = 0.20, p = 0.03). As central SCP showed collinearity with central DCP, therefore central DCP was not included in the multivariate model. In the univariate analysis, none of the parameters significantly affected the parafoveal CT parameter (data not shown).
 |
Table 3 Univariate and Multivariate Linear Regression Results, Systemic and Ocular Factors Associated with Central CT |
Choroidal Vascularity Index
In the univariate linear regression analysis, increase in parafoveal CVI was associated with the presence of DM (b = 0.08, p < 0.001), higher systolic (b = 0.24, p = 0.04) and diastolic blood pressure (b = 0.31, p = 0.01), increased parafoveal SCP (b = 0.67, p < 0.001), and DCP (b = 0.46, p < 0.001). Conversely, parafoveal CVI was decreased with greater age (b = −0.31, p = 0.01), male sex (b = −0.31, p = 0.01), higher HbA1C levels (b = −0.46, p < 0.001), and higher central CT (b = −0.32, p = 0.01). In the multivariate analysis, after adjusting for age and sex, parafoveal CVI was lower with the presence of DM (b = −0.46, p < 0.001) and higher with increased parafoveal SCP density (b = 0.44, p < 0.001) (Table 4). As systolic blood pressure showed collinearity with diastolic blood pressure, the latter was not included into multivariate model. Similarly, parafoveal SCP showed collinearity with parafoveal DCP, therefore parafoveal DCP was not included into multivariate model. In the univariate linear regression analysis, central CVI was increased with greater central SCP (b = 0.56, p = < 0.001), parafoveal SCP (b = 0.34, p = < 0.001), and central DCP (b = 0.57, p < 0.001). On the other hand, central CVI was decreased with the presence of DM (b = −0.76, p < 0.001), higher HbA1C (b = −0.42, p < 0.001), and bigger FAZ area (b = −0.65, p < 0.001). In the multivariate analysis, after adjusting for age and sex, central CVI was lower with the presence of DM (b = −0.68, p < 0.001) and bigger FAZ area (b = −0.21, p = 0.03) and it was higher with greater central SCP (b = 0.47, p = < 0.001) (Table 5). As central SCP showed collinearity with central DCP, central DCP was not included in the multivariate model.
 |
Table 4 Univariate and Multivariate Linear Regression Results, Systemic and Ocular Factors Associated with Parafoveal CVI |
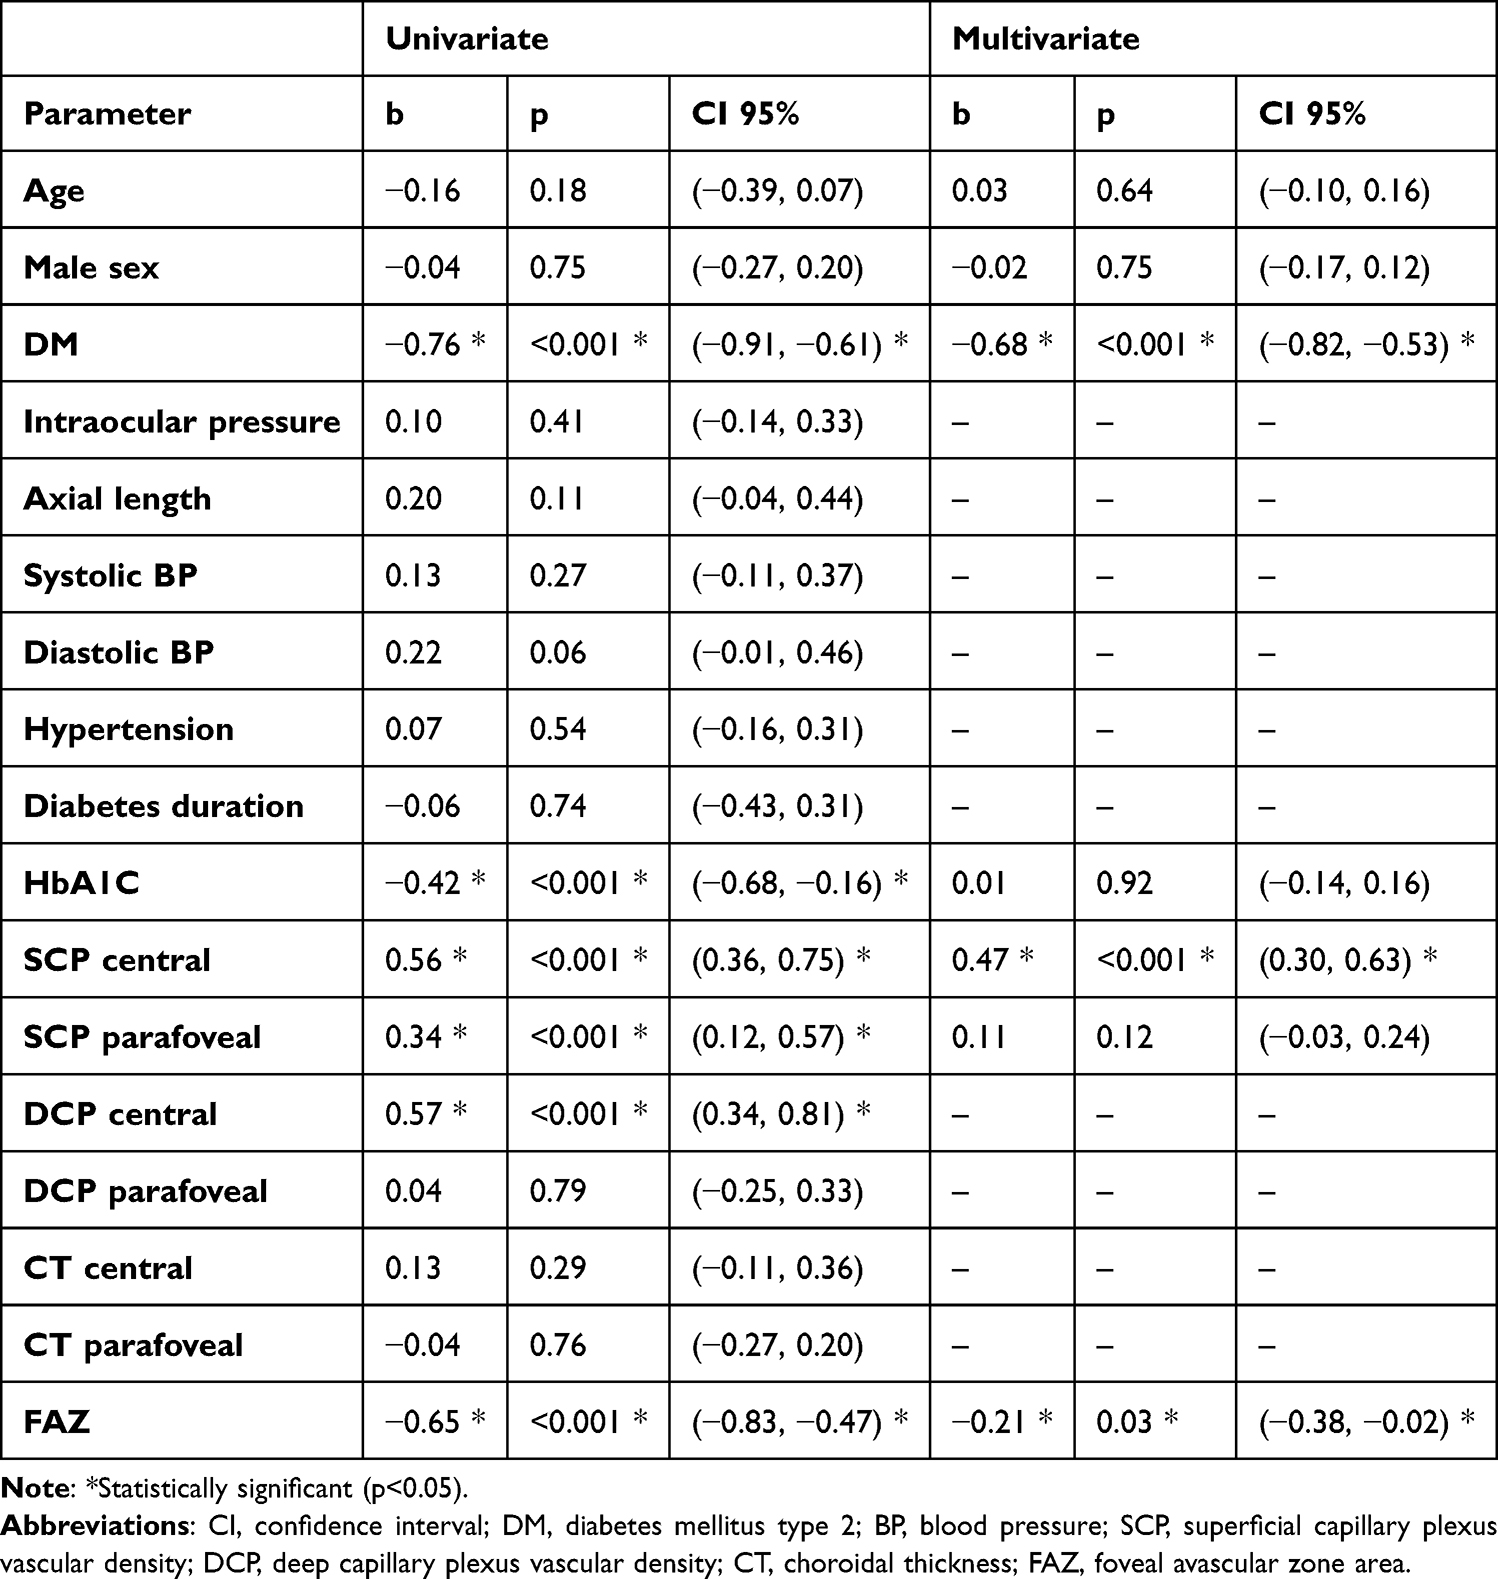 |
Table 5 Univariate and Multivariate Linear Regression Results, Systemic and Ocular Factors Associated with Central CVI |
Discussion
We have demonstrated that CVI and SCP were significantly decreased in diabetic patients. Additionally, we found that CVI and central CT were positively associated with SCP. The key findings are included in Table 6.
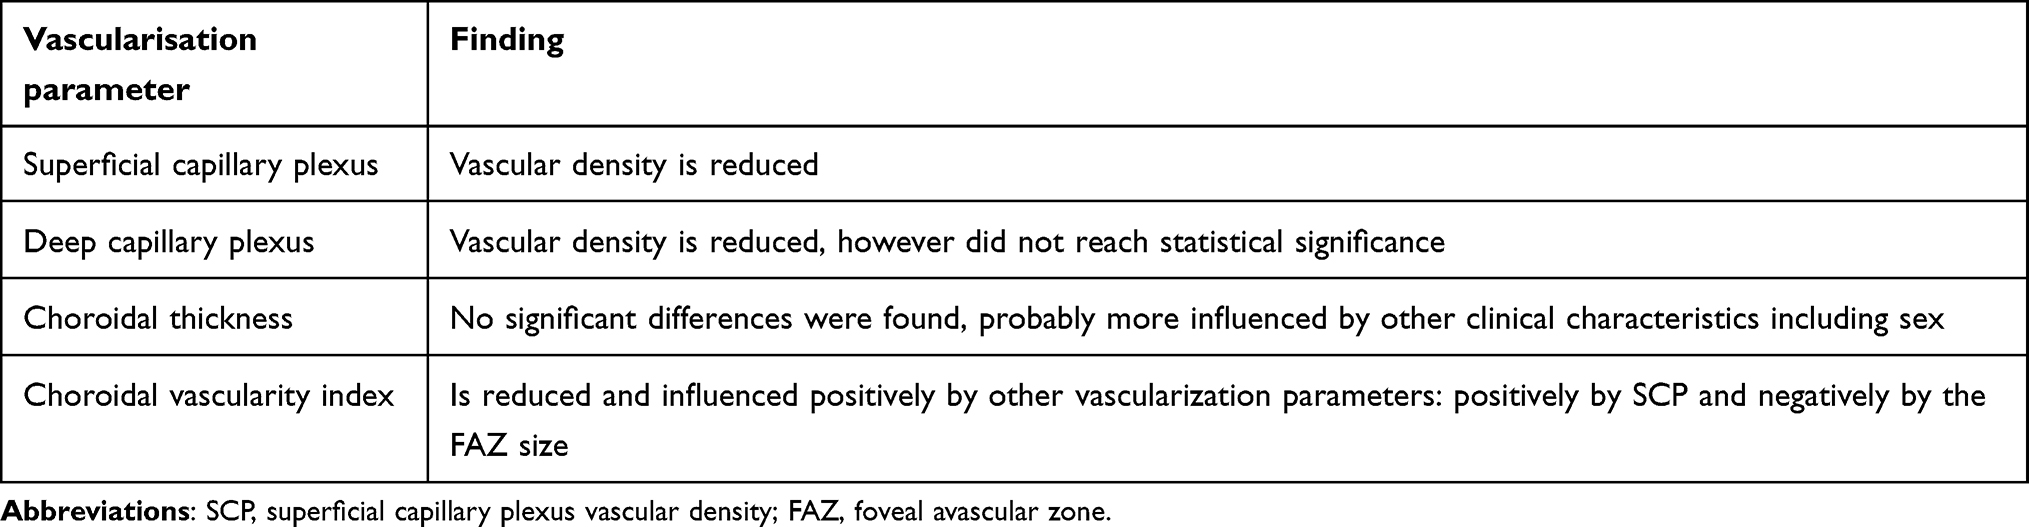 |
Table 6 Summary of Key Findings on the Different Vascularization Parameters in Type 2 Diabetes Patients Without Diabetic Retinopathy, Compared to Healthy Controls |
Choroidal Thickness
The choroid was thicker in the DM group, than in the control group, but only in the central and inferior fields. However, in the regression analysis, we found that central CT was influenced by sex and central SCP but not by DM.
In our studied populations, the central CT was 281.89 µm for the DM group and 268.37 µm for the control group. CT values vary considerably between studies, which is also due to the use of different types of OCT.22 Adhi et al using SD-OCT showed a sub foveal choroidal thickness of 276.4 µm in the healthy control group and 252.9 µm in the non-proliferative diabetic retinopathy group.23 In another study, authors reported CT of 327.1 µm in the control group and 307 µm in the DM no DR group.24 Kim et al using SS-OCT showed a subfoveal CT of 320 µm in the healthy group and 258.13 µm in DM no DR group.9
In the Beijing Eye Study, subfoveal choroidal thickness was significantly associated with the presence of diabetes mellitus, being slightly thicker in DM patients.10 Wang et al calculated CT In patients with different stages of DR, non-DR group and healthy control. The average CT was highest in the non-DR DM group and lowest in the proliferative DR group.25 In patients with diabetes, CT seem to decrease when ischemic lesions and signs of retinopathy appear. Many studies have reported reduced CT in patients with diabetes, stating ischemia as a potential cause. Indeed, hyperglycemia has been shown to reduce vascular blood flow, potentially contributing to thinner choroidal layers.26 Kim et al suggested that eyes of diabetic patients exhibit lower CT compared to healthy controls due to factors such as choroidal hypoxia, choriocapillary loss, or vascular constriction.9 Similarly, Temel et al showed decreased CT in patients with DR, compared to controls. While CT was also decreased in DM patients without DR, the reduction was not statistically significant.27 Additionally, Obada et al found no difference in sub foveal choroidal thickness between DM group without DR and healthy controls.28
This variability in findings highlights the complexity of the factors influencing CT, making it difficult to use CT as a reliable marker for assessing the risk of DR. In our regression model, after adjusting for age and sex, CT was not affected by the presence of DM. The severity of DR is likely to affect CT, but other parameters such as sex and type of OCT device should be taken into account in its assessment and comparisons.
Superficial and Deep Capillary Plexus
SCP was significantly lower in patients with diabetes in the superior and nasal segments and borderline lower in the inferior and temporal segments, compared to the control group. Although DCP levels were also lower in diabetic patients, this difference did not reach statistical significance.
The results of our study are consistent with a study by Kolkedi et al, who found that patients with DM had a significant decrease in retinal vessel density in the superior, temporal, and nasal quadrants of the SCP compared to healthy controls. Only the superior vascular density in DM patients showed a significant decrease in DCP.29 Similarly, Eid et al found lower SCP, but not DCP in diabetic patients, compared to healthy controls.30
In contrast, several studies have reported a decrease in both SCP and DCP in diabetic patients. Zeng et al found lower SCP in diabetic patients without DR, however, in their study, DCP was also reduced, a finding further supported by Dimitrova et al31,32 It is possible that DCP analysis is more challenging because of its deeper location and artifacts from overlying vessels. Another explanation could be that changes in the SCP precede DCP changes. Falavarjani et al analyzed capillary nonperfusion areas (CNP) in patients with diabetic retinopathy. They showed that the CNP in SCP were significantly larger than in DCP and, in addition, were not spatially co-localized, as it is typically observed in vascular obstructions.31 This finding is in line with our results, showing changes in SCP preceding DCP. It is worth noting, however, that while the DCP in our study was lower in the DM group, it did not reach statistical significance. A larger study group could increase the relevance of these changes.
Alterations in the SCP may also involve the peripapillary area, as previous studies have shown decreased SCP density in this region in diabetic patients. This is an area of increased RNFL thickness, a marker that is reduced in the course of diabetes. RNFL axons are embedded within the SCP, so the decreased SCP density in this region may be also related to the thinner RNFL present in diabetes.33 One of the proposed ways of correcting this is to remove the contribution of retinal blood vessels.34
Our study confirms the reduced SCP in diabetic eyes. We have also found a decrease in DCP, although this reduction did not reach statistical significance, reinforcing the notion that SCP changes might occur earlier and be more pronounced in the progression of diabetes-related retinal changes.
Choroidal Vascularity Index
CVI values were significantly lower in all segments in the DM group. In the multivariate regression analysis, after adjusting for sex and age, CVI showed a positive relationship with the corresponding central or parafoveal SCP and a negative relationship with the presence of diabetes. Additionally, central CVI was negatively associated with FAZ.
Our results are consistent with previous studies that have also observed a decrease in CVI in patients with diabetes both with and without DR.9,13,17,35 Compared with CT, CVI seems to be a more precise parameter in assessing DR complications, as clinical factors such as age, sex, and axial length did not significantly affect CVI, which aligns with the results of our study.13,21
While both CVI and SCP were reduced in all segments, SCP reached statistical significance only in the superior and nasal segments. This finding suggests that choroidal changes in diabetes may develop earlier than those in the retinal vessels. Indeed, it has been suggested that primary damage in diabetic eye disease may occur in the choroidal vasculature.36 Large choriocapillaris flow deficits, were noted before in diabetics patients.37
Our study also indicates a link between CVI and SCP, as SCP showed a positive association with CVI in the multivariate regression analysis. This finding aligns with Oh et al who evaluated the relationship between retinal and choroidal vascularization in a healthy population. Similar to our findings, after adjusting for age, CVI was negatively associated with FAZ.38 However, unlike our study, they did not find a relationship between CVI and SCP, possibly due to differences in methodology, as they did not separate CVI and SCP into corresponding size and location segments. This difference in parameter measurement could explain the discrepancies between the studies.
The choroid delivers nutrients and oxygen to the outer retinal layers, whereas the retinal capillary plexuses supply the inner retinal layers. Any alteration in the choroidal vascular structure and function may influence the metabolic demands of the outer retina, potentially affecting the density and function of the retinal capillary plexus. Furthermore, there might be shared regulatory pathways that influence the development and maintenance of both the choroidal and retinal vasculature. Factors like vascular endothelial growth factor (VEGF) play crucial roles in angiogenesis and vascular maintenance in both regions.39–41
Our findings reinforce the role of CVI as a new marker for choroidal function. CVI values are reduced in diabetic patients, and this relationship is independent of sex and age. This marker is also indicative of the condition of the retinal vasculature, as it is positively associated with SCP.
Limitations
Our study has several limitations. First, the groups were not gender-balanced, with more women in the control group than in the study group. Second, the angio-OCT SCP and DCP values were obtained directly from the device and not recalculated considering the magnification effect. However, the groups did not differ in AXL or SE.
Conclusion
The results of our study confirm a significant reduction in retinal and choroidal vascularization parameters, SCP and CVI, in diabetic patients without visible ophthalmoscopic changes of diabetic retinopathy. These parameters are related, as SCP is an age and sex independent parameter positively affecting CVI. In addition, we showed that CT may not be significantly changed in this group, and is probably more influenced by other clinical characteristics including sex. Understanding the mechanisms underlying the development of diabetic vascular changes in the retina and choroid is crucial for further progress in the treatment and prevention of diabetic eye disease.
Acknowledgments
The study was conducted in accordance with the guidelines of the Declaration of Helsinki and approved by the Institutional Ethics Committee of Wroclaw Medical University (KB-510/2022). Informed consent was obtained from all subjects involved in the study.
Funding
This research received no external funding.
Disclosure
The authors report no conflicts of interest in this work.
References
1. Yau JWY, Rogers SL, Kawasaki R, et al. Global prevalence and major risk factors of diabetic retinopathy. Diabetes Care. 2012;35(3):556–564. doi:10.2337/dc11-1909
2. Lechner J, O’Leary OE, Stitt AW. The pathology associated with diabetic retinopathy. Vis Res. 2017;139:7–14. doi:10.1016/j.visres.2017.04.003
3. Scuderi L, Fragiotta S, Di Pippo M, Abdolrahimzadeh S. The role of diabetic choroidopathy in the pathogenesis and progression of diabetic retinopathy. IJMS. 2023;24(12):10167. doi:10.3390/ijms241210167
4. Nickla DL, Wallman J. The multifunctional choroid. Prog Retinal Eye Res. 2010;29(2):144–168. doi:10.1016/j.preteyeres.2009.12.002
5. Ting DSW, Tan GSW, Agrawal R, et al. Optical coherence tomographic angiography in type 2 diabetes and diabetic retinopathy. JAMA Ophthalmol. 2017;135(4):306. doi:10.1001/jamaophthalmol.2016.5877
6. Kim M, Choi SY, Park YH. Quantitative analysis of retinal and choroidal microvascular changes in patients with diabetes. Sci Rep. 2018;8(1):12146. doi:10.1038/s41598-018-30699-w
7. Wang W, Liu S, Qiu Z, et al. Choroidal thickness in diabetes and diabetic retinopathy: a swept source OCT study. Invest Ophthalmol Vis Sci. 2020;61(4):29. doi:10.1167/iovs.61.4.29
8. Torabi H, Saberi Isfeedvajani M, Ramezani M, Daryabari SH. Choroidal thickness and hemoglobin A1c levels in patients with type 2 diabetes mellitus. JOVR. 2019;14(3):285. doi:10.18502/jovr.v14i3.4784
9. Kim M, Ha MJ, Choi SY, Park YH. Choroidal vascularity index in type-2 diabetes analyzed by swept-source optical coherence tomography. Sci Rep. 2018;8(1):70. doi:10.1038/s41598-017-18511-7
10. Xu J, Xu L, Du KF, et al. Subfoveal choroidal thickness in diabetes and diabetic retinopathy. Ophthalmology. 2013;120(10):2023–2028. doi:10.1016/j.ophtha.2013.03.009
11. Hirata M, Tsujikawa A, Matsumoto A, et al. Macular choroidal thickness and volume in normal subjects measured by swept-source optical coherence tomography. Invest Ophthalmol Vis Sci. 2011;52(8):4971. doi:10.1167/iovs.11-7729
12. Ding X, Li J, Zeng J, et al. Choroidal thickness in healthy Chinese subjects. Invest Ophthalmol Vis Sci. 2011;52(13):9555. doi:10.1167/iovs.11-8076
13. Tan K, Laude A, Yip V, Loo E, Wong EP, Agrawal R. Choroidal vascularity index – a novel optical coherence tomography parameter for disease monitoring in diabetes mellitus? Acta Ophthalmologica. 2016;94(7). doi:10.1111/aos.13044
14. Foo VHX, Gupta P, Nguyen QD, et al. Decrease in choroidal vascularity index of Haller’s layer in diabetic eyes precedes retinopathy. BMJ Open Diab Res Care. 2020;8(1):e001295. doi:10.1136/bmjdrc-2020-001295
15. Gupta C, Tan R, Mishra C, et al. Choroidal structural analysis in eyes with diabetic retinopathy and diabetic macular edema—A novel OCT based imaging biomarker. PLoS One. 2018;13(12):e0207435. doi:10.1371/journal.pone.0207435
16. Nicolini N, Tombolini B, Barresi C, et al. Assessment of diabetic choroidopathy using ultra-widefield optical coherence tomography. Trans Vision Sci Technol. 2022;11(3):35. doi:10.1167/tvst.11.3.35
17. Keskin Ç, Dilekçi ENA, Üçgül AY, Üçgül RK, Toprak G, Cengiz D. Choroidal vascularity index as a predictor for the development of retinopathy in diabetic patients. J Endocrinol Invest. 2023;47(5):1175–1180. doi:10.1007/s40618-023-02236-8
18. Marques JH, Marta A, Castro C, et al. Choroidal changes and associations with visual acuity in diabetic patients. Int J Retin Vitr. 2022;8(1):6. doi:10.1186/s40942-021-00355-z
19. Damian I, Roman G, Nicoară SD. Analysis of the choroid and its relationship with the outer retina in patients with diabetes mellitus using binarization techniques based on spectral-domain optical coherence tomography. JCM. 2021;10(2):210. doi:10.3390/jcm10020210
20. Arede P, Przezdziecka-Dolyk J, Debowy F, et al. Glaucomatous macular vasculature: a quantitative analysis. Med Hypothesis Discov Innov Ophthalmol. 2020;9(3):185–197. doi:10.51329/mehdiophthal1403
21. Agrawal R, Gupta P, Tan KA, Cheung CMG, Wong TY, Cheng CY. Choroidal vascularity index as a measure of vascular status of the choroid: measurements in healthy eyes from a population-based study. Sci Rep. 2016;6(1):21090. doi:10.1038/srep21090
22. Matsuo Y, Sakamoto T, Yamashita T, Tomita M, Shirasawa M, Terasaki H. Comparisons of choroidal thickness of normal eyes obtained by two different spectral-domain oct instruments and one swept-source oct instrument. Invest Ophthalmol Vis Sci. 2013;54(12):7630. doi:10.1167/iovs.13-13135
23. Adhi M, Brewer E, Waheed NK, Duker JS. Analysis of morphological features and vascular layers of choroid in diabetic retinopathy using spectral-domain optical coherence tomography. JAMA Ophthalmol. 2013;131(10):1267. doi:10.1001/jamaophthalmol.2013.4321
24. Abalem MF, Nazareth Santos Veloso H, Garcia R, et al. The effect of glycemia on choroidal thickness in different stages of diabetic Retinopathy. Ophthalmic Res. 2020;63(5):474–482. doi:10.1159/000506381
25. Wang JC, Laíns I, Providência J, et al. Diabetic choroidopathy: choroidal vascular density and volume in diabetic retinopathy with swept-source optical coherence tomography. Am J Ophthalmol. 2017;184:75–83. doi:10.1016/j.ajo.2017.09.030
26. Muir ER, Rentería RC, Duong TQ. Reduced ocular blood flow as an early indicator of diabetic retinopathy in a mouse model of diabetes. Invest Ophthalmol Vis Sci. 2012;53(10):6488. doi:10.1167/iovs.12-9758
27. Temel E, Özcan G, Yanık Ö, et al. Choroidal structural alterations in diabetic patients in association with disease duration, HbA1c level, and presence of retinopathy. Int Ophthalmol. 2022;42(12):3661–3672. doi:10.1007/s10792-022-02363-w
28. Obadă O, Pantalon AD, Rusu-Zota G, Hăisan A, Lupuşoru SI, Chiseliţă D. Choroidal assessment in patients with type 2 diabetes mellitus and non-proliferative diabetic retinopathy by swept-source ocular coherence tomography and image binarization. Medicina. 2022;58(7):918. doi:10.3390/medicina58070918
29. Kolkedi Z, Csutak A, Szalai E. Pre-ophthalmoscopic quantitative biomarkers in diabetes mellitus. Trans Vision Sci Technol. 2023;12(3):24. doi:10.1167/tvst.12.3.24
30. Eid P, Creuzot-Garcher C, Aho LS, et al. Early retinal microvascular changes assessed with swept-source oct angiography in type 1 diabetes patients without retinopathy. JCM. 2023;12(7):2687. doi:10.3390/jcm12072687
31. Zeng Y, Cao D, Yu H, et al. Early retinal neurovascular impairment in patients with diabetes without clinically detectable retinopathy. Br J Ophthalmol. 2019;103(12):1747–1752. doi:10.1136/bjophthalmol-2018-313582
32. Dimitrova G, Chihara E, Takahashi H, Amano H. Quantitative retinal optical coherence tomography angiography in patients with diabetes without diabetic retinopathy. Invest Ophthalmol Vis Sci. 2017;58(1):190–196.
33. Verma S, Singh VK, Rana J, Kumar S, Singh K, Srivastava R. Quantitative measurement of retinal nerve fiber layer thickness and its correlation with optical coherence tomography angiography vascular biomarker changes in preclinical diabetic retinopathy. Indian J Ophthalmol. 2024;72(Suppl 1):S11–S15. doi:10.4103/IJO.IJO_340_23
34. Chua J, Wong D, Yow AP, et al. Segregation of neuronal and vascular retinal damage in patients with hypertension and diabetes. Ann NY Acad Sci. 2024;1531(1):49–59. doi:10.1111/nyas.15089
35. Aksoy M, Simsek M, Apaydın M. Choroidal vascularity index in patients with type-1 diabetes mellitus without diabetic retinopathy. Curr Eye Res. 2021;46(6):865–870. doi:10.1080/02713683.2020.1846755
36. Markan A, Agarwal A, Arora A, Bazgain K, Rana V, Gupta V. Novel imaging biomarkers in diabetic retinopathy and diabetic macular edema. Ophthalmol Eye Dis. 2020;12:251584142095051. doi:10.1177/2515841420950513
37. Ahmed TS, Shah J, Zhen YNB, et al. Ocular microvascular complications in diabetic retinopathy: insights from machine learning. BMJ Open Diab Res Care. 2024;12(1):e003758. doi:10.1136/bmjdrc-2023-003758
38. Oh J, Baik DJ, Ahn J. Inter-relationship between retinal and choroidal vasculatures using optical coherence tomography angiography in normal eyes. Eur J Ophthalmol. 2020;30(1):48–57. doi:10.1177/1120672118816225
39. Saint-Geniez M, Maldonado AE, D’Amore PA. VEGF expression and receptor activation in the choroid during development and in the adult. Invest Ophthalmol Vis Sci. 2006;47(7):3135. doi:10.1167/iovs.05-1229
40. Ford KM, Saint-Geniez M, Walshe T, Zahr A, D’Amore PA. Expression and role of VEGF in the adult retinal pigment epithelium. Invest Ophthalmol Vis Sci. 2011;52(13):9478. doi:10.1167/iovs.11-8353
41. Stone J, Itin A, Alon T, et al. Development of retinal vasculature is mediated by hypoxia-induced vascular endothelial growth factor (VEGF) expression by neuroglia. J Neurosci. 1995;15(7):4738–4747. doi:10.1523/JNEUROSCI.15-07-04738.1995
 © 2024 The Author(s). This work is published and licensed by Dove Medical Press Limited. The
full terms of this license are available at https://www.dovepress.com/terms.php
and incorporate the Creative Commons Attribution
- Non Commercial (unported, 3.0) License.
By accessing the work you hereby accept the Terms. Non-commercial uses of the work are permitted
without any further permission from Dove Medical Press Limited, provided the work is properly
attributed. For permission for commercial use of this work, please see paragraphs 4.2 and 5 of our Terms.
© 2024 The Author(s). This work is published and licensed by Dove Medical Press Limited. The
full terms of this license are available at https://www.dovepress.com/terms.php
and incorporate the Creative Commons Attribution
- Non Commercial (unported, 3.0) License.
By accessing the work you hereby accept the Terms. Non-commercial uses of the work are permitted
without any further permission from Dove Medical Press Limited, provided the work is properly
attributed. For permission for commercial use of this work, please see paragraphs 4.2 and 5 of our Terms.