")
Back to Journals » Eye and Brain » Volume 17
Retinal Vessel Oxygen Saturation in Patients with Unilateral Edema of the Optic Nerve Head: A Pilot Study
Authors Březík M , Matušková V, Vysloužilová D, Šín M, Chovancová V , Sičová K, Jankaničová N , Chrapek O
Received 2 April 2025
Accepted for publication 20 June 2025
Published 8 July 2025 Volume 2025:17 Pages 81—94
DOI https://doi.org/10.2147/EB.S524274
Checked for plagiarism Yes
Review by Single anonymous peer review
Peer reviewer comments 2
Editor who approved publication: Dr Rustum Karanjia
Michal Březík,1,2 Veronika Matušková,1,3 Daniela Vysloužilová,1,3 Martin Šín,4 Veronika Chovancová,1 Kristína Sičová,1 Natália Jankaničová,5 Oldřich Chrapek1,3
1Department of Ophthalmology, Faculty of Medicine Masaryk University, Brno, Czech Republic; 2Eye Clinic, University Hospital Ostrava, Ostrava, Czech Republic; 3Eye Clinic, University Hospital Brno, Brno, Czech Republic; 4Department of Ophthalmology, Military University Hospital Prague, Prague, Czech Republic; 5Biostatistics, St Anne’s University Hospital, Brno, Czech Republic
Correspondence: Oldřich Chrapek, Department of Ophthalmology, Faculty of Medicine Masaryk University, Kamenice 5, Brno, 62500, Czech Republic, Tel +420 532 233 002, Email [email protected]
Purpose: Evaluate whether optic disc edema results in changes in retinal microcirculation.
Patients and Methods: The study group consisted of 11 patients with unilateral optic disc edema (papilledema). The control group consisted of the healthy eyes of the same 11 patients. Patients underwent non-invasive photo-spectrometric retinal oximetry using Oxymap T1 retinal oximeter (Oxymap, Reykjavik, Iceland). In the eyes of these 11 patients, we examined the diameter of the retinal arteries and veins, arterial and venous blood oxygen saturation, and the difference in oxygen saturation between arterioles and venules (A-V difference).
Results: In the papilledema group, the decrease in the retinal arterial diameter was statistically significant (p=0.001). The median diameter of the retinal artery was 11.70 px (IQR 1.47) or after conversion 109.00 μm (IQR 14.00) in the papilledema group and 13.75 px (IQR 1.61) or 128.00 μm (IQR 15.00) in the control group. The increase in the diameter of the retinal veins in the papilledema group was statistically significant (p=0.012), where the median diameter in the papilledema group was 20.88 px (IQR 3.72) or 194.00 μm (IQR 35.00), and in the control group was 18.18 px (IQR 3.60) or 169 μm (IQR 33.00). There was a statistically significant decrease (p< 0.001) in the venous saturation in the papilledema group with a median value of 53.16% (IQR 17.38) and 60.02% (IQR 11.98) in the control group. The median of the A-V difference was 51.92 (IQR 15.96) in the papilledema group, resp. 38.49 (IQR 9.75) in the control group and a significant increase in the papilledema group (p< 0.001) was reported.
Conclusion: Automatic retinal oximetry demonstrated changes in the retinal microcirculation in patients with optic disc edema.
Keywords: retina, oximetry, papilledema, microcirculation
Introduction
It is well established that the development of optic disc edema is associated with disruption of axoplasmic transport in the axons of retinal ganglion cells anterior to the lamina cribrosa sclerae. Bilateral optic nerve edema most commonly results from elevated intracranial pressure but may also be associated with systemic conditions such as hypertension, anemia, uremia, and others.1
In contrast, unilateral optic disc edema is typically linked to primary ocular pathologies, most notably optic neuritis (ON) and anterior ischemic optic neuropathy (AION). Optic neuritis may arise from infectious or para-infectious causes and is frequently associated with neurological disorders such as Myelin Oligodendrocyte Glycoprotein Antibody-Associated Disease (MOGAD), Neuromyelitis Optica Spectrum Disorder (NMOSD), and Multiple Sclerosis (MS).2
AION, on the other hand, results from occlusion of the short posterior ciliary arteries, either due to autoimmune vasculitis (arteritic form) or atherosclerotic disease (non-arteritic form). Beyond ON and AION, compressive causes must also be considered in cases of unilateral optic disc edema, including optic nerve gliomas, meningiomas, and endocrine orbitopathy.2
Despite the wide range of potential etiologies, the clinical presentation may appear remarkably similar. Therefore, accurate and timely diagnosis is essential, as the underlying cause of optic disc edema may reflect conditions that are potentially vision- or life-threatening.2 The central retinal artery enters the intraocular space, and the central retinal vein exits through the edematous tissue of the optic nerve. It can be assumed that the optic disc edema exerts pressure on the walls of the central retinal artery and vein. It has not yet been definitively established whether such compression influences retinal oxygen metabolism.
Over the past several years, retinal oximetry using dual-wavelength spectrophotometry has enabled non-invasive measurement of hemoglobin oxygen saturation in retinal arterioles and venules. This technique has been employed in the study of various ocular pathologies, including diabetic retinopathy, retinal vein occlusion, glaucoma, and retinitis pigmentosa.3 As such, retinal oxygen saturation has emerged as a promising biomarker in ophthalmology.4
This research aimed to investigate how optic disc edema (papilledema) affects retinal oxygen metabolism. We utilized the Oxymap T1 retinal oximeter to assess oxygen saturation levels in the retinal vessels of patients presenting with optic nerve head swelling, as we found no studies in the available literature specifically addressing this issue. We believe that a better understanding of these microcirculatory changes may contribute to elucidating the pathophysiological mechanisms that, in some cases, lead to irreversible damage of the optic nerve head.
Materials and Methods
We performed a prospective study to investigate the relationship between optic nerve head swelling and retinal vessel oxygen saturation. The study was conducted at the Eye Clinic of the University Hospital Brno, Czech Republic from 1 July 2023 to 31 December 2023. The study protocol was approved by the Ethics Committee of The University Hospital Brno, Czech Republic (protocol no. 08–070623/EK). The study was implemented in accordance with Good Clinical Practice and the Declaration of Helsinki. All patients provided written informed consent before enrollment into the study.
The sample consisted of 14 eyes in 14 patients with acute and newly diagnosed swelling of the optic nerve head of one eye. The control group consisted of the contralateral eyes of the same 14 patients, which had a normal optic disc. Participants were excluded if they had glaucoma, high-degree myopia, retinal, macular or choroidal pathology, intraocular inflammation, intraocular neoplasms, a history of ocular trauma, prior laser or intravitreal injection therapy, or previous carotid artery surgery. Only patients who had undergone uncomplicated cataract extraction at least six months prior were considered eligible, as other ocular conditions could potentially bias the findings. Individuals with significant media opacities - such as dense lens opacification or corneal scarring - were not included, given the potential to compromise image quality in retinal oximetry and fundus photography.
Furthermore, systemic disorders that might influence retinal oxygenation measurements - such as advanced pulmonary disease, diabetes mellitus, severe anemia, or sickle cell disease - were also grounds for exclusion. In every case, retinal oximetry was carried out on the day following the initial diagnosis, and always prior to initiating any therapeutic intervention. Three patients (three eyes with swelling of the optic nerve head and three eyes of the control group) were excluded from the study based on insufficient oximetry image quality. A total of 11 patients (11 eyes in the swelling group and 11 eyes in the control group) entered the final evaluation of the study.
In the evaluated group, the median age was 54 years (min. 26, max. 79 years, IQR 14) and the male-to-female ratio was 7/4, the right eye-to-left eye ratio was 5/6.
Data Collection
A thorough medical history was obtained from all subjects through personal interviews. Comprehensive ophthalmological assessments were conducted, including best-corrected visual acuity, intraocular pressure measurements, slit-lamp biomicroscopy, and dilated fundus examinations using a 78D lens to rule out any pre-existing retinal pathology.
For the purpose of this study, the Oxymap T1 retinal oximeter (Oxymap, Reykjavik, Iceland) was employed. This device is mounted onto a fundus camera (Topcon DX-50, Topcon Inc., Tokyo, Japan) and determines hemoglobin oxygen saturation in retinal vessels by analyzing the absorbance ratio of two wavelengths - 600 nm and 570 nm (OD600/OD570). Technical specifications and operational principles of the device have been described in previous literature.5
The oximetry software automatically identifies retinal vessels, classifying image pixels as either vessel or non-vessel. Vessel diameter is calculated by counting the number of vessel-classified pixels along perpendicular cross-sections, with more than 100 such measurements averaged to determine the final diameter. This method has been validated in prior research.6 Retinal vessels smaller than 8.0 pixels in diameter (approximately 75 µm) were excluded from the mean value analysis per eye.
The Oxymap T1 is calibrated for younger populations, which may occasionally produce arterial oxygen saturation readings exceeding 100%.7,8 Despite this, the device provides reproducible measurements with high sensitivity to physiological changes in hemoglobin oxygen saturation.
All retinal oximetry procedures were performed by a skilled ophthalmologist. Prior to imaging, pupil dilation was achieved using 1% tropicamide drops (Unimed Pharma, Slovak Republic). Subjects were comfortably positioned at the fundus camera with their head stabilized and were instructed to fixate on a target until imaging was completed. Once the patient assumed the appropriate examination position, the room lights were turned off to eliminate ambient light interference, and the procedure was conducted in a darkened room.9 It is important to note that the purpose of dimming the examination room was not to induce dark adaptation in the examined eyes.
Fundus images were captured within a 50° field centered on the temporal margin of the optic disc. The camera flash was set to 50Ws, and the photograph was taken approximately five seconds after the focus light was turned off. Resulting images were displayed in pseudocolor (see Figures 1 and 2): arterioles appeared in shades of orange to red, corresponding to oxygen saturation levels of approximately 90–100%, while venules were shown in colors ranging from blue to yellow, typically indicating saturations between 50–60%. A masked ophthalmologist conducted all saturation measurements using the Oxymap Analyzer software in accordance with a standardized protocol.
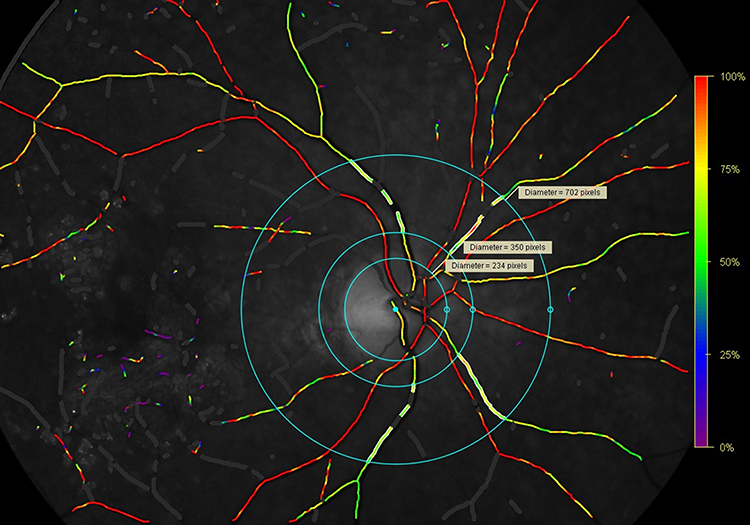 |
Figure 1 The oxygen saturation and vessel diameters were measured in the range between the two circles (1.5 times the diameter of the optic disc and 3.0 times diameter of the optic disc centered on the optic disc). |
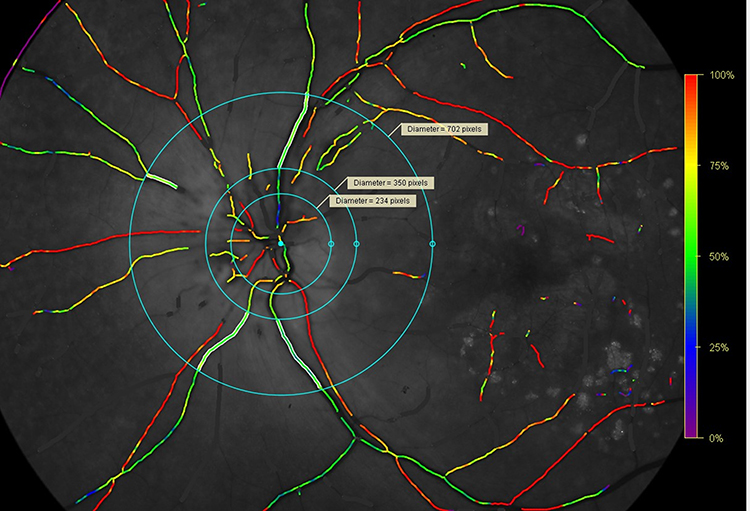 |
Figure 2 We used the diameters of the circles on the healthy eye as the diameters of the circles on the eye with edema of the optic disc. |
Automatic Retinal Oximetry Analysis
All image analyses were performed using Oxymap software (version 2.5.2; Oxymap, Reykjavik, Iceland). Fundus image quality was assessed prior to inclusion, with only photographs scoring above 5.0 on a 10-point scale deemed suitable for evaluation.
The measurement region was delineated using two concentric rings centered on the optic disc, with inner and outer radii corresponding to 1.5 and 3.0 times the optic disc diameter, respectively. Within this defined zone, first- and second-order retinal arteries and veins were selected for analysis if they exceeded 100 pixels in length (approximately 0.9 mm) and were wider than 8.0 pixels in diameter.
Oxygen saturation and vessel diameter were measured in both arterioles and venules across all four quadrants situated between the two concentric circles. For each vessel type, the final oxygen saturation values were calculated as the mean of the four quadrants. Segments of vessels that branched, overlapped, or intersected were excluded from the analysis to avoid artifacts.
The difference in oxygen saturation between arterioles and venules was computed and reported as the arteriovenous oxygen difference (A-V difference), representing a key parameter in assessing retinal oxygen extraction.
Data Analysis
All statistical analyses were performed using R version 4.2.1. Continuous variables were expressed/presented as median and interquartile range (IQR) and categorical variables as numbers and corresponding percentages. For the quantitative parameters, the Wilcoxon signed-rank test (one-tailed) was used to assess whether the value of each parameter increased or decreased on the “swelling” side compared to the contralateral side. The Wilcoxon signed-rank test was chosen because the assumption of normality, tested using the Shapiro–Wilk test, was not met. Additionally, the compared groups consisted of either the healthy or the affected eye from each patient. A p-value less than 0.05 was considered statistically significant.
Results
A total of 11 patients with unilateral swelling of the optic nerve head were enrolled in the study. Table 1 presents the basic characteristics calculated for the measured values of diameter and saturation in both arteries and veins in the eyes with optic disc edema and in the control group and also the counted value of the A-V difference.
 |
Table 1 Characteristics of the Measured Parameters |
For eyes in the papilledema group, the median arterial diameter was 11.70 pixels (IQR 1.47), resp. 109.00 µm (IQR 14.00). For eyes in the control group, the median arterial diameter was 13.75 pixels (IQR 1.61) resp. 128.00 µm (IQR 15.00). Measurements in the pixels were compared using a one tailed Wilcoxon signed-rank test with a resulting p-value of 0.001. There is a significant decrease in the arterial diameter in the papilledema group. The measured values of the arterial diameter in the papilledema group and the control group are shown as a boxplot in Figures 3 and 4.
 |
Figure 3 The resulting values of arterial diameter are shown in pixels. The dark grey boxplot represents the papilledema group, while the light grey boxplot represents the control group. |
 |
Figure 4 The resulting values of arterial diameter are shown in micrometers. The dark grey boxplot represents the papilledema group, while the light grey boxplot represents the control group. |
In the papilledema group, the median venous diameter was 20.88 pixels (IQR 3.72), resp. 194.00 µm (IQR 35.00). In the control group, the median venous diameter was 18.18 pixels (IQR 3.60) resp. 169.00 µm (IQR 33.00). Measurements of the venous diameter were tested again in pixels with a resulting p-value of 0.012, which can be interpreted as the presence of a significant increase in the diameter of the vein in the papilledema group in comparison to the control group. The measured values of venous diameter in the papilledema group and the control group are shown in Figures 5 and 6.
 |
Figure 5 The resulting values of venous diameter in pixels. The dark grey boxplot represents the papilledema group, while the light grey boxplot represents the control group. |
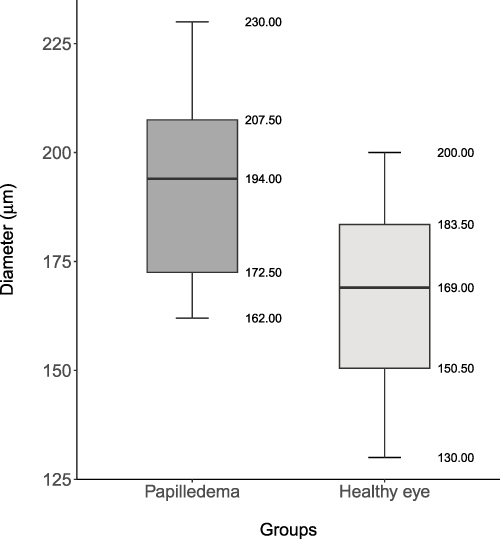 |
Figure 6 The resulting values of venous diameter in micrometers. The dark grey boxplot represents the papilledema group, while the light grey boxplot represents the control group. |
The median arterial saturation was 99.56% (IQR 12.68) in the papilledema group, resp. 95.43% (IQR 8.08) in the control group. The resulting p-value was 0.088, and no significant increase was found. The measured values of arterial saturation in the papilledema group and the control group are shown in Figure 7.
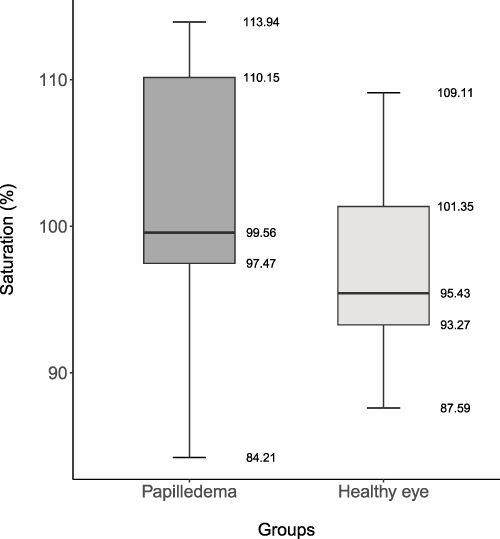 |
Figure 7 The resulting values of arterial saturation measured by the device. The dark grey boxplot represents the papilledema group, while the light grey boxplot represents the control group. |
In the papilledema group, during certain measurements, arterial blood oxygen saturation values exceeding 100% were recorded, indicating an objective measurement error. We recalculated the results, adjusting values of arterial blood oxygen saturation above 100% to exactly 100%. Even after this technical adjustment of the measurements, the resulting p-value was 0.181. The measured values of arterial saturation after recalibration are shown in Figure 8. We included these recalibrated results to demonstrate our awareness of the technical limitations associated with arterial saturation measurements using automated retinal oximetry. Additionally, presenting both the original and recalibrated data highlights that, despite the correction, the statistical outcome remained non-significant, reinforcing the robustness of our findings.
 |
Figure 8 The resulting values of arterial saturation after recalibration. The dark grey boxplot represents the papilledema group, while the light grey boxplot represents the control group. |
The median venous saturation was 53.16% (IQR 17.38) in the papilledema group, resp. 60.02% (IQR 11.98) in the control group, with the p-value of the test smaller than 0.001. The values of the venous saturation in the papilledema group are significantly smaller than the ones in the control group.The variability of venous saturation values, particularly the wide interquartile range, may indicate a certain degree of heterogeneity within the study cohort. This is likely attributable to individually variable severity of optic disc edema in each patient, leading to differences in venous lumen narrowing, venous flow velocity, and consequently, venous saturation levels. The measured values of venous saturation in the papilledema group and the control group are shown in Figure 9.
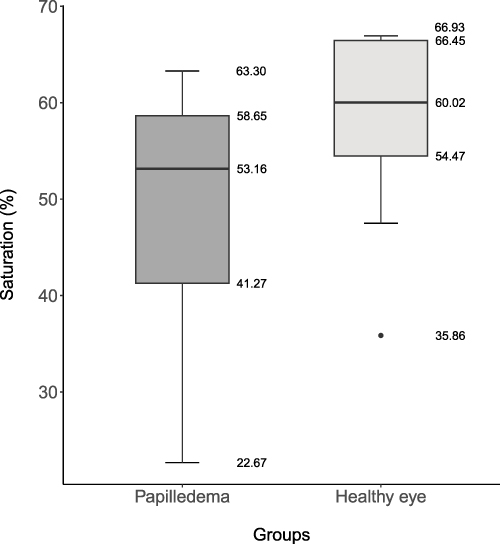 |
Figure 9 The resulting values of venous saturation. The dark grey boxplot represents the papilledema group, while the light grey boxplot represents the control group. |
We analyzed the ratio of retinal artery diameter to retinal vein diameter, first for eyes in the papilledema group and subsequently in the control group. For eyes with optic disc edema, the median ratio of retinal artery diameter to retinal vein diameter was 0.62 (IQR 0.13), while in the control group, it was 0.76 (IQR 0.10), with a resulting p-value smaller than 0.001. There was a significant decrease in the ratio in the papilledema group. The results are shown in Figure 10.
 |
Figure 10 The resulting values of the ratio of retinal artery diameter to retinal vein diameter in the papilledema group (dark grey boxplot) and the control group (light grey boxplot). |
As a final measure, we evaluated the ratio of oxygen saturation measured by the device in arterial blood to oxygen saturation in venous blood, known as the arteriovenous difference (A-V difference). In the papilledema group, the median A-V difference was 51.92 (IQR 15.92), while in the control group, it was 38.49 (IQR 9.75). The p-value of the test was smaller than 0.001, indicating a statistically significant increase in the papilledema group. The results are shown in Figure 11.
 |
Figure 11 The resulting values of the A-V difference in the papilledema group (dark grey boxplot) and the control group (light grey boxplot). |
Discussion
To the best of our knowledge, this study is the first to explore the impact of papilledema on oxygen saturation levels in retinal vessels.
In several cases, measured oxygen saturation in retinal arterioles exceeded 100%. This phenomenon can be attributed to the nature of the retinal oximeter, which provides relative rather than absolute oxygen saturation values. The device’s calibration is primarily optimized for the venous signal, as venous oxygen saturation is considered a more accurate indicator of retinal metabolic activity compared to arterial readings. As a result, this configuration may limit the accuracy of arterial saturation measurements, occasionally producing values beyond the physiological maximum.10 This represents a clear technical limitation of both the device and the measurement method used. Similar findings have been reported in previous studies.7,8,11,12
Despite these limitations, retinal oximetry has demonstrated strong repeatability.13 Moreover, oxygen saturation values obtained with this method show good correlation with systemic arterial blood gas measurements.14 Consequently, these data remain highly valuable for longitudinal monitoring within individuals and for comparative analyses across different patient groups.
In eyes with optic disc edema, we observed a statistically significantly lower diameter of retinal arteries and a statistically significantly higher diameter of retinal veins compared to the control group. Additionally, in eyes with optic disc edema, there was a statistically increased arteriovenous (A-V) difference compared to the control group. All these findings suggest the presence of microcirculation disorders and changes in oxygen metabolism in the retina of patients with optic disc edema.
Previous studies have demonstrated that a reduction in incoming blood volume leads to a narrowing of the retinal artery lumen.15 This occurs despite the known autoregulation of retinal blood vessels. Initially, when there is a drop in perfusion blood pressure, retinal arterioles dilate to maintain constant blood flow and retinal perfusion. However, if the decrease in perfusion pressure continues, the compensatory mechanisms are overwhelmed, and the retinal arterioles subsequently constrict.16,17 The statistically significant reduction in retinal arteriole diameter observed in eyes with optic disc edema may indicate a disruption of the autoregulatory compensatory mechanisms of retinal vessels. We explain the statistically significant increase in retinal vein diameter observed in eyes with optic disc edema compared to the control group as a problem with venous blood outflow through the central retinal vein. The central retinal vein is compressed by the edema after entering the optic nerve, leading to venous blood congestion before the obstruction and subsequent dilation of the retinal veins. We also believe that this is related to the increased arteriovenous (A-V) difference. The A-V difference reflects the oxygen uptake by retinal cells. A decrease in the A-V difference is often associated with reduced oxygen consumption in the retina, as described in atrophic retinal diseases such as retinitis pigmentosa.4 Oximetry studies in glaucomatous eyes have reported that while venous saturation increases, arteriolar saturations are not affected, thereby causing a decrease in the A-V difference, which is consistent with tissue loss.18 Šín described a decrease in the A-V difference in patients with diabetic retinopathy and retinal ischemia as a sign of reduced metabolic activity in the retina due to ischemic damage to retinal ganglion cells.19 Šínová noted a decrease in the A-V difference in patients with venous occlusion due to ischemic damage to retinal ganglion cells.20
In our study, we observed an increase in the A-V difference with decreased oxygen saturation of venous blood and increased dilatation of retinal veins. The increase in the A-V difference with decreased oxygen saturation of venous blood indicates increased oxygen consumption by retinal cells. In the present study, patients with optic disc edema exhibited an otherwise normal fundoscopic appearance, implying that retinal tissue may be extracting more oxygen per unit volume of blood under these conditions. Given that blood flow is directly proportional to flow velocity and to the square of the vessel radius,21 it is reasonable to infer a reduction in retinal blood flow among patients with optic disc swelling.
Reduced perfusion is typically associated with an elevated oxygen extraction fraction.22,23 When capillary blood flow diminishes over time, the retina compensates by extracting a greater proportion of available oxygen to satisfy metabolic demands. This compensatory mechanism results in an increased arteriovenous oxygen saturation difference (A-V difference), which serves as an indirect indicator of heightened oxygen extraction. Therefore, we believe that the increased A-V difference is a sign of the good function of retinal cells, which do not undergo apoptosis during acute changes in retinal microcirculation. Simultaneously, observed stasis in the venous system leads to increased oxygen consumption by these cells, resulting in a reduced oxygen level in venous blood and thus increasing the A-V difference. We believe that this finding indicates that changes in the retinal vascular system caused by optic disc edema do not result in retinal ischemia with damage to retinal ganglion cells and their metabolic activity in the acute phase of the disease.
The influence of pathological changes in the optic nerve on retinal microcirculation remains insufficiently understood. In a study examining retinal microcirculation alterations in patients with retrobulbar neuritis associated with MS, no optic disc edema was present. Nevertheless, an increased A-V difference was observed, which was attributed to elevated oxygen consumption during inflammation.24
In patients with unilateral optic disc edema, we observed that arterial oxygen saturation did not differ compared to the contralateral, unaffected eye. However, we recorded an increased A-V difference and decreased venous saturation. We interpret these findings as being caused by an obstruction in venous outflow, likely due to slowed blood flow through the capillary bed, resulting in prolonged oxygen extraction from the capillary circulation.
Our observations are in line with findings reported in some original and review studies focusing on central retinal vein occlusion (CRVO). These authors, like us, describe a reduction in venous oxygen saturation, an increased A-V difference, and unchanged arterial saturation when compared to the unaffected eye.22,25–28
In trying to explain the similarity between our findings and those in the aforementioned studies, we can only speculate. However, it is possible that optic disc edema leads to compression of the central retinal vein, narrowing its lumen. This scenario closely resembles the early stage of CRVO developing at the level of the lamina cribrosa sclerae, with both situations creating a comparable obstruction to venous outflow and triggering similar microcirculatory changes in the venous system. Further research is necessary to confirm this hypothesis.
This study has certain limitations. Primarily, the relatively small sample size reduces statistical power and may lead to bias in the results. Therefore, further research with a larger cohort is essential to validate our preliminary findings. The small sample size also prevented the use of multivariate analysis to adjust for potential confounding variables.
Three patients in the cohort were treated for hypertension, one patient for hyperlipidemia, and one patient had both hypertension and hyperlipidemia concurrently. We are aware that the influence of hypertension and hyperlipidemia on retinal oxygen saturation is not yet reliably understood. Secondly, we did not measure retinal blood flow, which complicates the interpretation of oxygen delivery to the retina and the interpretation of retinal oxygen metabolism. Thirdly, during the analysis it was impossible to mark the edge of the optic disc edema using a circle and subsequently determine the evaluating zones. We resorted to delineating the optic disc of the healthy eye because the software automatically displays the diameter of the currently created circle in pixels. We used the diameter of the circle on the healthy eye as the diameter of the circle on the eye with edema of the optic disc. We assumed the same size of the optic disc for both healthy and diseased eyes in one and the same patient, as the measuring area was later defined by two concentric circles at 1.5 times the diameter of the optic disc and three times the diameter of the optic disc.
A notable strength of this study was the inclusion of patients with unilateral optic disc edema, enabling intraindividual comparisons between the affected and unaffected eyes. This design helped minimize the influence of systemic variables on retinal oxygen saturation.
Given that individuals with diabetes mellitus typically exhibit elevated levels of glycosylated hemoglobin - which has a higher oxygen-binding affinity than normal hemoglobin and tends to retain oxygen within the vasculature more effectively11 - patients with diabetes were deliberately excluded to avoid potential bias in oxygen saturation measurements.
Overall, this study provides the first evidence that optic disc edema leads to a significant decrease in the diameter of retinal arterioles, a significant increase in the diameter of retinal venules, a significant decrease in venous oxygen saturation, and an increase in the A-V difference. These findings indicate a disturbance in retinal microcirculation, most likely without apoptosis of retina neuroepithelial cells, at least in the acute stage of the disease. From the perspective of accuracy and the scientific credibility of the results, it is important to consider that in eyes with optic disc edema, the edema extended into the neuroepithelium adjacent to the optic disc, including the zones where measurements were conducted. This edema likely affected the retinal nerve fiber layer (RNFL). We know that there is a relationship between the thickness of the RNFL and measured values of oxygen blood saturation. Mohan studied the relationship and correlation of perivascular retinal nerve fiber layer (pRNFL) thickness and retinal vessel oxygen saturation corrected for vessel width (SatCor), and described a strong negative correlation of arteriolar and venular SatCor with the thickness of the pRNFL. He also confirmed a significant correlation between the diameter of the vessels and SatCor (negative) as well as between the diameter of the vessels and pRNFL (positive) in univariate analysis.29 We are aware that the values of oxygen blood saturation we obtained may be distorted by the presence of edema in the nerve fiber layer and by the increased thickness of the pRNFL. The scientific validity of our measurements will require further investigation. However, from the perspective of real clinical practice, since we always compared the findings of the right and left eyes of the same patient, we believe that the differences in the measurements between two eyes of the same patient described by us can be used in real clinical practice as beneficial for diagnosing unilateral optic disc edema. We also identify two promising areas for further research with potential clinical relevance. First, investigating the correlation between the height of optic disc edema and changes in retinal microcirculation could help determine whether automated retinal oximetry may assist in diagnosing early stages of optic disc edema. Second, long-term follow-up of patients with unilateral optic disc edema could reveal the time course of declining A-V difference, potentially serving as an indicator of emerging retinal ganglion cell apoptosis and, consequently, the onset of optic nerve atrophy. Addressing these questions will require further studies in the future.
Conclusion
Automatic retinal oximetry indicates changes in retinal microcirculation in unilateral optic disc edema and can thus be a helpful method in diagnosing this condition in real clinical practice.
Acknowledgments
The authors gratefully acknowledgments the Biostatistics Core Facility of FNUSA-ICRC for their support and assistance in this work.
Funding
This study is supported by research projects FNBr, 652 69705 given by the Czech Ministry of Health.
Disclosure
The authors report no conflicts of interest in this work.
References
1. Diblík P. Neurooftalmologie. In: Heissigerová J, editor. Oftalmologie. Prague: Maxdorf sro. 2021:303–306.
2. Rambousek J, Preiningerová Lízrová J, Česká M B, Hložánek M. Otoky terčů zrakového nervu - společné téma oftalmologů a neurologů. Neurol praxi. 2023;24(2):88–93. doi:10.36290/neu.2022.074
3. Hübnerová P, Mlčák P, Šínová I, Karhanová M, Šín M. Current use of automatic retinal oximetry – a review. Cesk Slov Oftalmol. 2020;76(1):3–11. doi:10.31348/2020/1
4. Stefansson E, Olafsdottir OB, Einarsdottir AB, et al. Retinal oximetry discovers novel biomarkers in retinal and brain diseases. Invest Ophthalmol Vis Sci. 2017;58(6):BIO0227–BIO0233. doi:10.1167/iovs.17-21776
5. Geirsdottir A, Palsson O, Hardarson SH, Olafsdottir OB, Kristjansdottir JV, Stefánsson E. Retinal vessel oxygen saturation in healthy individuals. Invest Ophthalmol Vis Sci. 2012;53(9):5433–5442. doi:10.1167/iovs.12-9912
6. Blondal R, Sturludottir MK, Hardarson SH, Halldorsson GH, Stefansson E. Reliability of vessel diameter measurements with a retinal oximeter. Graefes Arch Clin Exp Ophthalmol. 2011;249(9):1311–1317. doi:10.1007/s00417-011-1680-2
7. Guduru A, Martz TG, Waters A, Kshirsagar AV, Garg S. Oxygen saturation of retinal vessels in all stages of diabetic retinopathy and correlation to ultra-wide field fluorescein angiography. Invest Ophthalmol Vis Sci. 2016;57(13):5278–5284. doi:10.1167/iovs.16-20190
8. Hardarson SH, Stefansson E. Retinal oxygen saturation is altered in diabetic retinopathy. Br J Ophthalmol. 2012;96(4):560–563. doi:10.1136/bjophthalmol-2011-300640
9. Hardarson SH, Basit S, Jonsdottir TE, et al. Oxygen saturation in human retinal vessels is higher in dark than in light. Invest Ophthalmol Vis Sci. 2009;50(5):2308–2311. doi:10.1167/iovs.08-2576
10. Rilven S, Torp TL, Grauslund J. Retinal oximetry in patients with ischaemic retinal diseases. Acta Ophthalmol. 2017;95(2):119–127. doi:10.1111/aos.13229
11. Khoobehi B, Firn K, Thompson H, Reinoso M, Beach J. Retinal arterial and venous oxygen saturation is altered in diabetic patients. Invest Ophthalmol Vis Sci. 2013;54(10):7103–7106. doi:10.1167/iovs.13-12723
12. Zhang W, Li L, Zou D, et al. Retinal vessel oxygen saturation in patients with unilateral carotid artery stenosis: a pilot study. Acta Ophthalmol. 2021;99(1):e13–e18. doi:10.1111/aos.14503
13. Goharian I, Iverson SM, Ruiz RC, Kishor K, Greenfield DS, Sehi M. Reproducibility of retinal oxygen saturation in normal and treated glaucomatous eyes. Br J Ophthalmol. 2015;99(3):318–322. doi:10.1136/bjophthalmol-2014-305718
14. Traustason S, Jensen AS, Arvidsson HS, Munch IC, Sondergaard L, Larsen M. Retinal oxygen saturation in patients with systemic hypoxemia. Invest Ophthalmol Vis Sci. 2011;52(8):5064–5067. doi:10.1167/iovs.11-7275
15. Alnawaiseh M, Ertmer C, Seidel L, et al. Feasibility of optical coherence tomography angiography to assess changes in retinal microcirculation in ovine haemorrhagic shock. Crit Care. 2018;22(1):138. doi:10.1186/s13054-018-2056-3
16. Tani T, Nagaoka T, Nakabayashi S, Yoshioka T, Yoshida A. Autoregulation of retinal blood flow in response to decreased ocular perfusion pressure in cats: comparison of the effects of increased intraocular pressure and systemic hypotension. Invest Ophthalmol Vis Sci. 2014;55(1):360–367. doi:10.1167/iovs.13-12591
17. Wang L, Cull GA, Fortune B. Optic nerve head blood flow response to reduced ocular perfusion pressure by alteration of either the blood pressure of intraocular pressure. Curr Eye Res. 2014;40(4):359–367. doi:10.3109/02713683.2014.924146
18. Vandawalle E, Pinto LA, Olafsdottir OB, et al. Oximetry in glaucoma: correlation of metabolic change with structural and functional damage. Acta Ophthalmol. 2014;92(2):105–110. doi:10.1111/aos.12011
19. Šín M, Chrapek O, Karhanová M, et al. The effect of pars plana vitrectomy and nuclear cataract on oxygen saturation in retinal vessels, diabetic and non-diabetic patients compared. Acta Ophthalmol. 2016;94(1):41–47. doi:10.1111/aos.12828
20. Šínová I, Řehák J, Nekolová J, et al. Correlation between ischemic index of retinal vein occlusion an oxygen saturation in retinal vessels. Am J Opthalmol. 2018;188:74–80. doi:10.1016/j.ajo.2018.01.015
21. Williamson TH, Harris A. Color Doppler ultrasound imaging of the eye and orbit. Surv Ophthalmol. 1996;40(4):255–267. doi:10.1016/S0039-6257(96)82001-7
22. Eliasdottir TS, Bragason D, Hardarson SH, Kristjansdottir G, Stefansson E. Venous oxygen saturation is reduced and variable in central retinal vein occlusion. Graefes Arch Clin Exp Ophthalmol. 2015;253(10):1653–1661. doi:10.1007/s00417-014-2849-2
23. Shahidi M, Felder AE, Tan O, Blair NP, Huang D. Retinal oxygen delivery and metabolism in healthy and sickle cell retinopathy subjects. Invest Ophthalmol Vis Sci. 2018;59(5):1905–1909. doi:10.1167/iovs.17-23647
24. Svrčinová T, Mareš J, Chrapek O, et al. Changes in oxygen saturation and the retinal nerve fibre layer in patients with optic neuritis - a pilot study. Acta Ophthalmol. 2018;96(3):e309–e314. doi:10.1111/aos.13571
25. Belamkar AV, Jabbehdari S, Harris A, Hajrasouliha AR. Clinical implications of retinal oximetry in retinal vein occlusion: a review. Acta Ophthalmol. 2022;100(6):624–631. doi:10.1111/aos.15066
26. Hardarson SH. Retinal oximetry. Acta Ophthalmol. 2013;91(5):489–490. doi:10.1111/aos.12239
27. Hardarson SH, Stefansson E. Oxygen saturation in central retinal vein occlusion. Am J Ophthalmol. 2010;150(6):871–875. doi:10.1016/j.ajo.2010.06.020
28. Yoneya S, Saito T, Nishiyama Y, et al. Retinal oxygen saturation levels in patients with central retinal vein occlusion. Ophthalmology. 2002;109(8):1521–1526. doi:10.1016/S0161-6420(02)01109-0
29. Mohan A, Dabir S, Kurian M, Shetty R, Chidambara L, Kumar RS. Perivascular and quadrant nerve fiber layer thickness and its relationship with oxygen saturation. Curr Eye Res. 2016;41(9):1223–1228. doi:10.3109/02713683.2015.1104361
 © 2025 The Author(s). This work is published and licensed by Dove Medical Press Limited. The
full terms of this license are available at https://www.dovepress.com/terms.php
and incorporate the Creative Commons Attribution
- Non Commercial (unported, 4.0) License.
By accessing the work you hereby accept the Terms. Non-commercial uses of the work are permitted
without any further permission from Dove Medical Press Limited, provided the work is properly
attributed. For permission for commercial use of this work, please see paragraphs 4.2 and 5 of our Terms.
© 2025 The Author(s). This work is published and licensed by Dove Medical Press Limited. The
full terms of this license are available at https://www.dovepress.com/terms.php
and incorporate the Creative Commons Attribution
- Non Commercial (unported, 4.0) License.
By accessing the work you hereby accept the Terms. Non-commercial uses of the work are permitted
without any further permission from Dove Medical Press Limited, provided the work is properly
attributed. For permission for commercial use of this work, please see paragraphs 4.2 and 5 of our Terms.