")
Back to Journals » Clinical Ophthalmology » Volume 18
Revisiting the Visual Acuity Curves. A Proposed Methodology for the Evaluation of Postoperative Visual Acuity in Presbyopia
Authors Labiris G , Bakirtzis M , Panagis C , Mitsi C, Vorgiazidou E , Konstantinidis A , Delibasis KK
Received 29 July 2024
Accepted for publication 19 November 2024
Published 25 December 2024 Volume 2024:18 Pages 3935—3947
DOI https://doi.org/10.2147/OPTH.S487400
Checked for plagiarism Yes
Review by Single anonymous peer review
Peer reviewer comments 2
Editor who approved publication: Dr Scott Fraser
Georgios Labiris,1 Minas Bakirtzis,1 Christos Panagis,1 Christina Mitsi,1 Eleftheria Vorgiazidou,2,3 Aristeidis Konstantinidis,1 Konstantinos K Delibasis2
1Department of Ophthalmology, University Hospital of Alexandroupolis, Alexandroupolis, Greece; 2Department of Computer Science and Biomedical Informatics, University of Thessaly, Lamia, Greece; 3School of Medicine, Aristotle University of Thessaloniki, Thessaloniki, Greece
Correspondence: Georgios Labiris, Department of Ophthalmology, University Hospital of Alexandroupolis, Dragana, Alexandroupolis, 68100, Greece, Tel +30 2551030990, Email [email protected]
Purpose: To identify the minimally required number of distances of visual acuity (VA) measurements for the reliable estimation of the visual acuity curve (VAC) and area of the curve (AoC) in presbyopia correction.
Patients and Methods: The study was divided into a validation and a clinical phase with a total recruitment of 120 participants (120 eyes) who underwent uncomplicated pseudophakic presbyopia surgery with bilateral premium intraocular lenses (IOL) implantation. This study was conducted in the Department of Ophthalmology, University Hospital of Alexandroupolis, Alexandroupolis, Greece. Postoperative VAC and AoC were calculated with VA measurements taken at nine pre-defined distances. A mathematical model based on cubic spline interpolation was developed and assessed comparing the VAC and AoC values obtained using nine distances, with the ones predicted when a subset of VA measurements was inserted into the model.
Results: Less than four measurements resulted in unreliable VAC and AoC assessment. Optimal distances for four to six VA measurements were determined. Mean error in the prediction of VAC and AoC of the clinical group ranged from 2.54 Letters/1.74% (6 measurements) to 2.90 letters/2.9% (4 measurements), respectively.
Conclusion: Mathematical models that use cubic spline interpolation provide reliable VAC and AoC estimation, even with four VA measurements, when obtained at specific distances.
Keywords: presbyopia, premium IOLs, visual acuity curve, area of the curve, DDART
Introduction
It is a truism that presbyopic corrections are gaining popularity among refractive and cataract surgeons. Numerous surgical options have been developed, both pseudophakic and laser assisted, that attempt to restore or even improve the pre-presbyopic visual capacity.1–4 However, none of the current treatments can fully replicate the pre-presbyopic functionality, since the human eye is an adaptive monofocal visual system with optimal retinal illuminance regardless of the focal point.5,6
Nevertheless, the presbyopic surgical options are associated with promising outcomes in terms of patients’ satisfaction, and in terms of visual acuity. Especially the pseudophakic ones, which demonstrate clear superiority against simple cataract extraction; therefore, a constantly increasing number of cataract surgeons are attempting to include them in their daily practice.7–10
Despite the technological and technical advances in the presbyopia correction field, the progress in the interpretation of the post-surgical visual outcomes has been mediocre.11,12 In fact, there is still no consensus among ophthalmologists on the assessment of the visual acuity and of the visual quality following any presbyopic correction. To our knowledge, among the primary reasons that contribute to this fact are a) the assessment of the patient’s visual acuity curve (VAC) is a complex and mathematically intensive task and b) visual disturbances are difficult to standardize and quantify.
Regarding VAC assessment, defocus curves testing (DCT) is still considered the gold-standard examination.11 It is an indirect method that simulates distant focal points with the use of corrective lenses. Recently, our group presented a novel technique for the visual acuity curve calculation using the validated Democritus Digital Acuity & Reading Test (DDART).13 DDART allows true visual acuity measurements at any user-defined distance since it generates the correct optotype size and is capable of monitoring the distance of the patient from the screen in real time. Moreover, it automatically plots the visual acuity (VAC) curve using spline curve fitting, which also allows the automatic calculation of the area of the curve (AoC).13–15
However, regardless of the methods used, either indirect like the DCT or direct with DDART, there is no consensus on the number of the necessary focal points to be examined nor on the exact distances. Therefore, the majority of published reports suggest against increasing the diopter step since it reduces the reliability of the measured VAC. Unfortunately, testing the visual acuity (VA) in nine or even more distances is a time-consuming and demanding process for both the patient and the ophthalmologist, contributing to the fact that VAC and AoC estimation have not been introduced as a routine examination in clinical settings.
Within this context, the primary objective of this study was to identify the minimal number of VA measurements and the corresponding distances, necessary for reliable VAC and AoC estimation in an attempt to simplify the overall process. We also investigate the interpolation methods for AoC calculation. We also propose a more robust measure to compare two VACs based on the non-overlapping area of the curves -NoA.
Materials and Methods
Setting
This was a prospective study that was conducted in two phases: a) the validation phase, in which we developed our VAC & AoC calculation methods and b) the clinical phase in which we confirmed our outcomes in a sample of patients. Study protocol adhered to the tenets of the Helsinki Declaration and all participants provided written informed consent. The institutional review board of the University Hospital of Alexandroupolis in Greece, where the study was conducted, approved the protocol. International registration number of the study is NCT06260852.
Participants
All participants for the validation (60 patients/60 eyes) and clinical phases (60 patients/60 eyes) of the study were recruited from the Cataract Service on a consecutive-if-eligible basis and randomly populated four study groups: a) Bilateral Multifocal Intraocular Lens Group (BMG), b) Premium Monovision, mix and match Intraocular Lens Group (PMG), c) Bilateral xEDOF intraocular group (BXG), d) Bilateral Bifocal Intraocular Lens Group (BFG). Eligibility criteria for all patients included: diagnosis of senile cataract with stage 2 nuclear opalescence according to the Lens Opacities Classification System III (LOCS-3) grading scale, mesopic pupil diameters below 5 mm, chord-mu below 0.4 mm, and comma below 0.32 um. Exclusion criteria included reports of headaches and/or eyestrain associated with visual activities and positive, pathologic ocular cover test (for distance and near) and/or the Mallett’s disparity test (for distance and near) and the double Maddox rod test, endothelial cell count less than 1900/mm2, glaucoma, intraocular pressure-lowering medications, former incisional surgery, former diagnosis of corneal disease, former diagnosis of fundus disease, diabetes, autoimmune, or mental diseases. Professional night workers were excluded, as well.
Surgical Technique
All operations were performed by the same surgeon (G.L.) in a consistent way using the Centurion Vision System platform and the Verion Image Guided System (Alcon, FortWorth, TX). Pupils were dilated with Tropicamide 0.5% (Tropixal, Demo, Greece) and Phenylephrine Hydrochloride 5% (Phenylephrine, Cooper, Greece). Periorbital skin and the lids were cleaned, and the conjunctival cul-de-sac was irrigated with povidone-iodine (Betadine). Patients received topical anesthesia with proparacaine hydrochloride 0.5% drops (3 drops prior to surgery). Digital guided capsulorhexis was set at 5.0 mm based on the visual axis.
BMG patients received bilaterally the Panoptix IOL targeting emmetropia in both eyes. PMG received the Panoptix IOL in the recessive eye and the Vivity IOL in the dominant one targeting emmetropia, while BXG group participants received the Vivity IOL in both eyes, targeting emmetropia, as well. BFG group patients received bilaterally the Restor IOL. For all participants, when the preoperative manifest astigmatism was above 1D, the corresponding Panoptix toric or Vivity toric IOL was implanted. In all cases, the non-dominant eye was initially operated, followed by the dominant one within a time window of a maximum of 2 months. The same postoperative regimen was prescribed to all patients, which included fixed combination of tobramycin 0.3% and dexamethasone 0.1% (FCTD), (Tobradex, Alcon, Greece) six times daily, and Sodium Hyaluronate 0.1% (Hylocomod, Pharmex, Greece) gradually tapered in a month.
Data Collection
All data were collected, by an independent researcher who was naive of the presbyopia correction that was applied. Bilateral and unilateral, postoperative uncorrected visual acuity (UVA) was measured at 25.5, 28, 33, 40, 50, 66, 100, 200 and 300 cm using the digital biometric distance feature of DDART, as described before.14,15
Interpolation Methods
In defocus studies, visual acuity (VA) is measured at a number of pre-defined distances di, simulated by correcting spectacles, for each patient, and the corresponding VA results are measured in units of either logMAR or letters. Interpolation is usually applied on the set of distance, or diopter and VA data points, ie (di,vi) or (xi, vi) respectively, to calculate a continuous curve that passes through all the measured points. The independent variable x denotes the diopter xi (with units length−1), equivalent to the distance of the test, di. The actual distance values di are in the range of [25cm, 300cm] with the selected distances more densely distributed for small distance values. The corresponding range for diopters is [−4, −0.33] m−1, equally spaced with a step of 0.5m−1 (except for the last distance of 300cm that may be considered as infinity), as can be seen in Table 1. In the remaining paper, we use the terms distance and diopter interchangeably, however the reader must keep in mind that the VA examination took place at different actual distances. The equivalent diopters are used in the mathematical calculations since their distribution is more even than the actual distances.
 |
Table 1 The 9 Distances Di, Used for VA Measurement and the Corresponding Diopters Xi |
Firstly, interpolation is applied, to determine VA for any given diopter value x0, within the defined diopter range. Secondly, we explore the potential for accelerating the examination process by identifying an optimal combination of ninc number of examinations at distances (equiv. diopters) per patient and use the interpolating function to predict the outcome of the VA test at the missing distances/diopters so that the overall accuracy examination is not compromised.
Let us assume that VA has been measured at a number of ninc distances, out of the 9 standard possible distances/diopters. Using the measured data  , one may generate a unique polynomial of degree ninc −1 that satisfies (passes through) all data points. Another alternative is to generate a spline consisting of ninc −1 cubic polynomials, each defined in consecutive ranges of the X-axis, exhibiting C2 continuity on the given ninc points. We will refer to the former method as polynomial interpolation and to the latter as spline interpolation.
Interpolation Assessment Scheme
Assessing the VA interpolation is of great importance, if the accuracy of the examination is to be maintained at a high level. Having obtained the analytical form of the interpolating polynomial(s), the VA at any examination distance can be predicted and quantities like the area of the interpolating curve (AoC) and the non-overlapping curve area (NoA) can be easily calculated, as it will be described below.
For all eyes that were included in the validation phase, VA was measured using DDART,14,15 for the n=9 distances shown in Table 1. The interpolating polynomial g(x) is obtained using the measured VA at a set of ninc<n selected diopters. Let Dexc be the set of n-ninc diopters for which the VA is considered unknown (ie Dexc has not been used for obtaining g(x)). The VA at the missing diopters can be predicted as  , whereas the actual VA values are denoted as v(xj). The interpolation was assessed for each eye using the mean absolute difference error and maximum absolute difference error (
 ,
,  , respectively) between the actual and the predicted values
 :
:


The main concepts are graphically presented in Figure 1, where ninc=5 distances Dinc={-4, −3, −1, −0.5, −0.33}m−1 (equiv.{25.5, 33, 100, 200, 300}cm), denoted by green squares) were used to generate the g(x), shown as the continuous curve. The difference between the measured and the predicted VA, v(x) and g(x) at the remaining 4 diopters x ϵ Dexc ={-3.5, −2.5, −2, −1.5} m−1 (equiv. {28,40,50,60} cm), is also shown as vertical line segments.
 |
Figure 1 Interpolated points and corresponding VA error from the points (Dinc, distance included; Dexc, distance excluded). |
At this point is it important to note that polynomials of high (8th) degree are bound to exhibit variations between measured points that are not acceptable in the context of a VA test. On the other hand, spline polynomials, especially cubic ones, exhibit mathematical properties more suitable for modeling VA curves. Such an example is shown in Figure 2, where the 8th degree polynomial that interpolates the 9 VA values is plotted for intermediate distances. Prominent inacceptable variations are observed, whereas the use of cubic spline exhibits a more plausible interpolating curve. Thus, the cubic spline interpolation, henceforth denoted as spline, is selected to be applied to the available data.
 |
Figure 2 Difference between interpolation methods using 8th degree polynomials and 3rddegree spline polynomials. |
Figure 3 shows the interpolation curves for 5 random eyes of the validation group, generated for the best combination of ninc=5 distances, denoted by squares. The VA for the remaining 4 distances are depicted as circles, for evaluation of the interpolation. The absolute difference between the measured and the predicted VA is shown as vertical segments.
 |
Figure 3 Interpolation curves for five random eyes, generated for ninc=5 diopters (denoted by squares). The VA for the remaining 4 diopters are depicted as circles, for evaluation of the interpolation. |
In the context of curve analysis, the area of the curve (AoC) is defined as the area of the region between the interpolation polynomial curve and the X axis. This area is computed by evaluating the integral of the polynomial g(x) within the integration limits, which are set by the minimum and maximum values of the x-axis, with VA given in Letters.

We further investigated another interpolation error metric, based on AoC, in order to compare two VA curves. Unfortunately, the absolute difference of two AoCs is not a reliable metric of the difference between two VACs, since it is known that two curves may present very similar AoCs, with significant shape differences, as shown in Figure 4. In this example, the visual curve was generated a) using 9 measurements (magenta curve) and b) using 5 measurements denoted by “o” (blue curve). It is evident that a new metric was needed to quantify the curves’ differences.
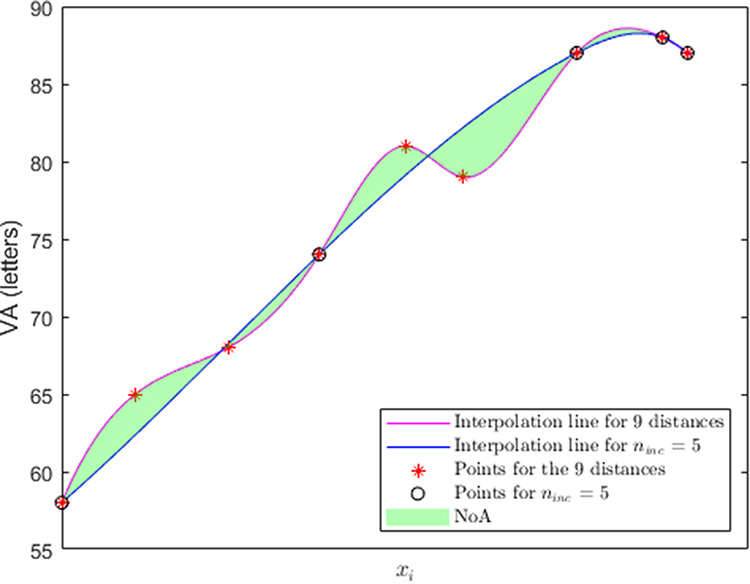 |
Figure 4 Interpolating spline polynomials for n=9 distances and =5 distances for the same patient. NoA is shown in color. |
Therefore, we introduced the Non-Overlapping Area (NoA) of two polynomials h(x) and g(x), as follows:

Performing the calculations in this specific example reveals that the AoC of the two curves presents minimal absolute difference (AoCall=279.37 and AoC5= 279.03, respectively), despite a NoA value of 5.008.
Statistical Analysis
As already mentioned, the primary objective of this work was to identify a subset of the n=9 possible distances at which the VA test was performed and subsequently apply an interpolation technique that can reliably predict the outcome of the VA test at the remaining distances. Since all patients were tested at all 9 distances, the assessment of distance combinations of the actual VA test and prediction accuracy could be performed unambiguously.
Let ninc<n be the number of distances that the VA test was measured. The number of possible combinations of ninc distances out of the n=9 available ones is given by:

where ! denotes factorial. Reducing the number of distances at which VA test was performed from nine to four, five or six measurements, results in C94= 126, C95 = 126 and C96 = 84 unique combinations.
For each distance combination c,  was defined as the averaged mean error
  and
and  as the averaged maximum error emax(c), incurred with respect to all Np60 eyes p in the validation group:


The quantity  was selected as the error metric for assessing the different distance combinations in terms of interpolation accuracy. Thus, the optimal distance combination cbest was determined as the one that minimized
  .
.
Utilizing the definition of NoA, we calculated for each patient p the NoA between the spline curve generated by the best combinations of distances cbest and the curve generated by all 9 available distances. The average NoA over all patients of the subset was defined as follows:

Finally, we defined the relative NoA with respect to the area of the 9-point AoCall visual curve:

All mathematical analysis and graphs were performed using Matlab ver 9.13.0 (R2022b) The MathWorks Inc.; 2022, Natick, Massachusetts.
Results
As stated earlier, in the validation phase of this study, we attempted to identify the optimal combination of VA measurements at specific distances that could simplify the measuring process, and at the same time produce reliable VAC and AoC outcomes. Therefore, the optimal distance combination cbest for different ninc values was defined as the one that minimizes the  and
and  values with respect to all patients in the validation group and is depicted in Table 2 with true value equal to 1 for included distances di
  Dinc, and false value (0) for excluded distances di
  Dexc. The optimal combinations for the different number of measurements shown in Table 2, achieved
  and
and  that ranged from 3.16 and 6.69 letters (4 distances) to 2.68 and 5.18 letters (6 distances), while
  and %
and %  ranged from 8.54 and 3.38% (4 distances) to 4.67 and 1.80% (6 distances), respectively. All other distance combinations, and especially, attempts with less than four VA measurements, regardless of the measuring distances, escalated
  and
and  , as well as
  and %
and %  .
.
 |
Table 2 The Best Distance Combinations Cbest for Ninc = 4, 5, 6 and the Achieved |


Since we identified the optimal combinations in the validation phase of the study, we applied the same calculations in the patients of the clinical phase, which achieved similar results (Table 3).  and
and  ranged from 2.90 and 6.21 letters (4 distances) to 2.54 and 4.15 letters (6 distances), while
  and %
and %  ranged from 7.85 and 2.92% (4 distances) to 4.59 and 1.74% (6 distances), respectively.
 |
Table 3 The Best Distance Combinations Cbest for Ninc = 4, 5, 6 and the Achieved |


Figure 5 demonstrates the boxplots of the estimated VA error  and
and  for the clinical group, for the optimal distances with ninc=4, 5 and 6.
 |
Figure 5 Boxplots of VA error and (blue and purple boxes respectively) for the clinical group for the optimal distance combinations cbest for ninc=4, 5 and 6 distances. |
When the interpolating polynomial passes through ninc = 4 points, 50% of the observations for the VA error lie within the range of [2.5, 4] Letters. In the first quartile, lower VA error values are observed, ranging from 0.5 to 2 Letters. In the  quartile, it is evident that the worst
  value is lower than 5 Letters. For ninc=5, the calculated error in the test patient cohort has lower variability, while the highest error in the 4th quartile is lower than its prior ninc observation. Finally, in the case where ninc=6 distances,
  has value less than 6 Letters, whereas only 1 outlier is detected. In the boxplots of
  the effect of increasing ninc is more evident. We consider
  a much safer metric for assessing the accuracy of VA prediction since it uses the maximum VA error per patient, rather than the average one.
On the other hand, Figures 6 and 7 demonstrate the boxplots of  , and
, and  , respectively.
 |
Figure 6 Boxplots of NoA between the VAC for each patient of the clinical group generated using all 9 distances and the VAC generated using the global best combinations for ninc=4, 5 and 6. |
 |
Figure 7 Boxplots of RNoA between the VAC for each patient of the clinical group generated using all 9 distances and the VAC generated using the global best combinations for ninc=4, 5 and 6. |
Discussion
It is a common belief that the reliable estimation of the patient’s visual acuity curve is very important for the accurate assessment of the outcomes of any presbyopia surgical technique and of the performance of any premium intraocular lens. Defocus curve testing, which is the gold-standard examination for the evaluation of presbyopia-related interventions, suffers from significant drawbacks,12,16 as indicated by Kohnen and coworkers in their recent excellent review.11 Most of these drawbacks derive from the fact that DCT simulates the distance by placing positive and negative lenses, while the patient remains at a constant distance from the chart.17 Thus, DCT cannot address issues such as the physiological pupil response, the ocular convergence in bilateral testing, the retinal illuminance, while the distance simulation is limited by the dioptric step of the lens. All aforementioned parameters significantly influence the accuracy of measured visual acuity at the simulated distance.18–25 On the other hand, DCT is not standardized regarding the number of the measured distances, therefore it is suggested that is preferable to measure VA in as many distances as possible, resulting in very tiring examination for the patient.26 DCT is even more demanding for the ophthalmologist since it requires complicated mathematics for accurate plotting of the visual curve and for the calculation of the AoC.26–29 Within this context, the primary objective of the present study was to explore whether reliable VAC plotting and AoC estimation could be achieved with six or even fewer VA measurements and identify at which distances these data should be collected.
In our department, we prefer the direct methods, therefore we traditionally use DDART at nine predetermined distances instead of the DCT; however, we are confident that our study outcomes are valid for DCT as well.
Regardless of the VA measuring method, certain precautions should be applied to secure reliable VAC and AoC comparisons. Firstly, we applied cubic spline curve fitting, which is the most commonly used mathematical method to predict VA data.13 Secondly, except for the mean absolute VA error  and the maximum VA error emax at the missing distances, we investigated the metric of the non-overlapping area NoA for VAC comparisons. We believe that NoA is a far more reliable metric for visual curve comparisons since it is possible that two different patients may present very different VACs with similar AoC.
Addressing the aforementioned methodological tasks, we were able to input VA data into our MATLAB mathematical model, which returned interesting outcomes. As expected, there is a negative correlation between the predictive VA error and the number of actual VA measurements. However, VA error was significantly reduced when the actual VA measurements were obtained at specific distances. Indeed, in the validation phase of our study, the mean VA error ranged from 3.16 letters (4 measurements) to 2.68 (6 measurements). Similar outcomes were detected at the clinical-phase group of patients, with mean VA error ranging from 2.90 letters (4 measurements) to 2.54 letters (6 measurements). Although there is no consensus on the acceptable limits of VA predictability, all mean differences were within the conventional ETDRS test–retest variability range of 0.1 logMAR, or 5 Letters.30
AoC comparisons demonstrated similar trends when actual VA data are obtained at the established distances. In the validation-phase participants, the average RNoA ranged from 3.38% (4 distances) to 1.80% (6 distances), respectively. Comparable outcomes demonstrated the clinical-phase participants with average RNoA ranging from 2.92% (4 distances) to 1.74% (6 distances), respectively. Similarly, to the VAC estimation, there is no consensus in the ophthalmological community on the acceptable limits in AoC variability; however, even the RNoA of 3.38% seems impressive.
It should be clearly stated that irrespectively of the selected strategy (4, 5 or 6 actual measurements), optimal VA prediction for VAC plotting and AoC estimation can only be achieved when VA is measured at the proposed distances. Other distance combinations increase significantly the measuring error. Moreover, less than actual four measurements, result in unreliable VAC and AoC assessments, regardless of the measuring distance. Direct comparisons with the literature are difficult, due to the different methods used that limit the number of relevant published reports. Nevertheless, literature suggests that it is not advised to use larger diopter step sizes.25 Contrary to the above, according to our outcomes, reliable VAC and AoC estimation can be obtained with fewer measurements at specific distances, which minimizes testing time and contributes to better patient concentration.
Among the objectives of the present paper was to reveal the necessity of using modern digital tests for the interpretation of surgical outcomes in presbyopia surgery. It seems odd to evaluate the efficacy of modern presbyopia IOLs and/or laser, or 3D-assisted presbyopia surgery with the same conventional tests that were developed in the previous century. VAC and AoC calculations are complicated, mathematically intensive tasks that require a significant amount of time and effort, even to input the actual VA data into the mathematical model. Therefore, it is strongly advised to use modern digital charts, like DDART,14,15 that facilitate the measuring process with the provision of a fully automated procedure for VAC and AoC estimation. Indeed, this is the translational impact of present study outcomes, that suggest a reliable, and almost effortless, method for VAC and AoC calculation, not only for research settings but for every patient that underwent premium presbyopia surgery. This can be achieved, since in modern digital charts, like DDART: a) VA measurements are automatically stored in a digital format, so there is no need for manual input, b) the digital chart identifies whether the patient has enough VA data for reliable VAC and AoC estimation, d) and automatically plots VAC using cubic spline fitting, estimates AoC, and calculates the estimated error depending on the measuring strategy (four, five or six VA measurements).14,15
Conclusion
Summarizing, to our knowledge, this is the first study that identifies the minimal necessary number and the exact distances of visual acuity measurements for the reliable VAC and AoC estimation, using an advanced mathematical model. Average VAC and AoC predictability, even at the four proposed distances, is within the conventional ETDRS test–retest variability. Five and especially six measurements returned even better predictability.
We are confident that our outcomes will assist cataract surgeons in the interpretation of their surgical outcomes and prospectively, in their effort to deliver better care to their presbyopia patients.
Data Sharing Statement
The authors intend to share deidentified participant data including study information leaflets and written consent forms for at least one year after the manuscript publication, acceptable in print form. The data are available upon request (email: [email protected]). All relevant data are in Greek.
Acknowledgments
- DDART is hosted at the Democritus University Server at: https://ddart.med.duth.gr.
- Present study was funded by the Hellenic Society of Intraocular Implant & Refractive Surgery (2022 Spyros Georgaras Research Award).
Disclosure
The authors report no conflicts of interest in this work.
References
1. Mahrous A, Ciralsky JB, Lai EC. Revisiting monovision for presbyopia. Curr Opin Ophthalmol. 2018;29:313–317. doi:10.1097/ICU.0000000000000487
2. Labiris G, Panagiotopoulou EK, Perente A, et al. Premium monovision versus bilateral myopic monovision, hybrid monovision and bilateral trifocal implantation: a comparative study. Clin Ophthalmol. 2022;16:619–629. doi:10.2147/OPTH.S351091
3. Torky MA, Nokrashy AE, Metwally H, Abdelhameed AG. Visual performance following implantation of presbyopia correcting intraocular lenses. Eye. 2022. Epub ahead of print. doi:10.1038/s41433-022-02188-y
4. Ribeiro FJ, Ferreira TB. Comparison of visual and refractive outcomes of 2 trifocal intraocular lenses. J Cataract Refract Surg. 2020;46:694–699. doi:10.1097/j.jcrs.0000000000000118
5. Labiris G, Panagiotopoulou EK, Ntonti P. Development and validation of a lighting facility for the objective assessment of the visual performance of presbyopic patients in a series of activities of daily living. Cureus. 2022;14:e24548. doi:10.7759/cureus.24548
6. Panagiotopoulou EK, Boboridis K, Seimenis I, Labiris G. Impact of light conditions on visual performance following premium pseudophakic presbyopia corrections. J Clin Med. 2023;12:4324. doi:10.3390/jcm12134324
7. Ntonti P, Bakirtzis M, Delibasis K, Seimenis I, Tsinopoulos I, Labiris G. Impact of personality on the decision process and on satisfaction rates in pseudophakic presbyopic correction. J Cataract Refract Surg. 2022;48:1433–1439. doi:10.1097/j.jcrs.0000000000001021
8. Asena L, Kırcı Dogan İ, Oto S, Dursun Altınors D. Comparison of visual performance and quality of life with a new nondiffractive EDOF intraocular lens and a trifocal intraocular lens. J Cataract Refract Surg. 2023;49:504–511. doi:10.1097/j.jcrs.0000000000001142
9. Tran DB, Owyang A, Hwang J, Potvin R. Visual acuity, quality of vision, and patient reported outcomes after bilateral implantation with a trifocal or extended depth of focus intraocular lens. Clin Ophthalmol. 2021;15:403–412. doi:10.2147/OPTH.S295503
10. Farvardin M, Johari M, Attarzade A, Rahat F, Farvardin R, Farvardin Z. Comparison between bilateral implantation of a trifocal intraocular lens (Alcon Acrysof IQ® PanOptix) and extended depth of focus lens (Tecnis® Symfony® ZXR00 lens). Int Ophthalmol. 2021;41:567–573 doi:10.1007/s10792-020-01608-w
11. Kohnen T, Lemp-Hull J, Suryakumar R. Defocus curves: focusing on factors influencing assessment. J Cataract Refract Surg. 2022;48:961–968. doi:10.1097/j.jcrs.0000000000000906
12. Pieh S, Kellner C, Hanselmayer G, et al. Comparison of visual acuities at different distances and defocus curves. J Cataract Refract Surg. 2002;28:1964–1967. doi:10.1016/S0886-3350(02)01317-2
13. Labiris G, Panagis C, Ntonti P, Konstantinidis A, Bakirtzis M. Mix-and-match vs bilateral trifocal and bilateral EDOF intraocular lens implantation: the spline curve battle. J Cataract Refract Surg. 2024;50:167–173. doi:10.1097/j.jcrs.0000000000001336
14. Labiris G, Panagiotopoulou EK, Delibasis K, et al. Validation of a web-based distance visual acuity test. J Cataract Refract Surg. 2023;49:666–671. doi:10.1097/j.jcrs.0000000000001176
15. Labiris G, Panagiotopoulou EK, Duzha E, et al. Development and validation of a web-based reading test for normal and low vision patients. Clin Ophthalmol. 2021;15:3915–3929. doi:10.2147/OPTH.S314943
16. Gupta N, Wolffsohn JS, Naroo SA. Optimizing measurement of subjective amplitude of accommodation with defocus curves. J Cataract Refract Surg. 2008;34:1329–1338. doi:10.1016/j.jcrs.2008.04.031
17. Kieval JZ. Understanding the defocus curve: it’s all about the optics. 2014. Available from: https://millennialeye.com/articles/2014-jul-aug/understanding-The-defocus-curveits-all-about-The-optics/.
18. Breyer DRH, Kaymak H, Ax T, Kretz FTA, Auffarth GU, Hagen PR. Multifocal intraocular lenses and extended depth of focus intraocular lenses. Asia Pac J Ophthalmol. 2017;6:339–349 doi:10.22608/APO.2017186
19. Salati C, Salvetat ML, Zeppieri M, Brusini P. Pupil size influence on the intraocular performance of the multifocal AMO-Array intraocular lens in elderly patients. Eur J Ophthalmol. 2007;17:571–578. doi:10.1177/112067210701700415
20. Alfonso JF, Fernandez-Vega L, Baamonde MB, Montes-Mico R. Correlation of pupil size with visual acuity and contrast sensitivity after implantation of an apodized diffractive intraocular lens. J Cataract Refract Surg. 2007;33:430–438. doi:10.1016/j.jcrs.2006.10.051
21. Dexl AK, Zaluski S, Rasp M, Grabner G. Visual performance after bilateral implantation of a new diffractive aspheric multifocal intraocular lens with a 3.5 D addition. Eur J Ophthalmol. 2014;24:35–43. doi:10.5301/ejo.5000315
22. Son HS, Kim SH, Auffarth GU, Choi CY. Prospective comparative study of tolerance to refractive errors after implantation of extended depth of focus and monofocal intraocular lenses with identical aspheric platform in Korean population. BMC Ophthalmol. 2019;19:187. doi:10.1186/s12886-019-1193-z
23. Munoz G, Albarran-Diego C, Javaloy J, Sakla HF, Cervino A. Combining zonal refractive and diffractive aspheric multifocal intraocular lenses. J Refract Surg. 2012;28:174–181. doi:10.3928/1081597X-20120215-02
24. Yang CM, Lim DH, Hwang S, Hyun J, Chung TY. Prospective study of bilateral mix-and-match implantation of diffractive multifocal intraocular lenses in Koreans. BMC Ophthalmol. 2018;18:73. doi:10.1186/s12886-018-0735-0
25. Lee JH, Lee H, Lee JA, Yoo A, Kim JY, Tchah H. Clinical outcomes after mix-and-match implantation of diffractive multifocal intraocular lenses with + 2.75 and + 4.00 diopter add powers. BMC Ophthalmol. 2020;20:193. doi:10.1186/s12886-020-01460-7
26. Wolffsohn JS, Jinabhai AN, Kingsnorth A, et al. Exploring the optimum step size for defocus curves. J Cataract Refract Surg. 2013;39:873–880. doi:10.1016/j.jcrs.2013.01.031
27. Buckhurst PJ, Wolffsohn JS, Naroo SA, et al. Multifocal intraocular lens differentiation using defocus curves. Invest Ophthalmol Vis Sci. 2012;53:3920–3926. doi:10.1167/iovs.11-9234
28. Terauchi R, Horiguchi H, Ogawa S, et al. Age-related visual outcomes in eyes with diffractive multifocal intraocular lenses. Eye. 2022;36:2260–2264. doi:10.1038/s41433-021-01854-x
29. Lapid-Gortzak R, Bala C, Schwiegerling J, Suryakumar R. New methodology for measuring intraocular lens performance using acuity reserve. J Cataract Refract Surg. 2021;47:1006–1010. doi:10.1097/j.jcrs.0000000000000561
30. Rosser DA, Cousens SN, Murdoch IE, Fitzke FW, Laidlaw DA. How sensitive to clinical change are ETDRS logMAR visual acuity measurements? Invest Ophthalmol Vis Sci. 2003;44:3278–3281. doi:10.1167/iovs.02-1100
 © 2024 The Author(s). This work is published and licensed by Dove Medical Press Limited. The
full terms of this license are available at https://www.dovepress.com/terms.php
and incorporate the Creative Commons Attribution
- Non Commercial (unported, 3.0) License.
By accessing the work you hereby accept the Terms. Non-commercial uses of the work are permitted
without any further permission from Dove Medical Press Limited, provided the work is properly
attributed. For permission for commercial use of this work, please see paragraphs 4.2 and 5 of our Terms.
© 2024 The Author(s). This work is published and licensed by Dove Medical Press Limited. The
full terms of this license are available at https://www.dovepress.com/terms.php
and incorporate the Creative Commons Attribution
- Non Commercial (unported, 3.0) License.
By accessing the work you hereby accept the Terms. Non-commercial uses of the work are permitted
without any further permission from Dove Medical Press Limited, provided the work is properly
attributed. For permission for commercial use of this work, please see paragraphs 4.2 and 5 of our Terms.