")
Back to Journals » Journal of Inflammation Research » Volume 17
Risk Factors and Prediction of 28-Day-All Cause Mortality Among Critically Ill Patients with Acute Pancreatitis Using Machine Learning Techniques: A Retrospective Analysis of Multi-Institutions
Authors Cai W, Wu X, Chen Y, Chen J, Lin X
Received 10 February 2024
Accepted for publication 22 June 2024
Published 11 July 2024 Volume 2024:17 Pages 4611—4623
DOI https://doi.org/10.2147/JIR.S463701
Checked for plagiarism Yes
Review by Single anonymous peer review
Peer reviewer comments 2
Editor who approved publication: Dr Tara Strutt
Weimin Cai,1 Xiao Wu,1 Yongxian Chen,2 Junkai Chen,3 Xinran Lin1
1Department of Gastroenterology and Hepatology, The First Affiliated Hospital of Wenzhou Medical University, Wenzhou, 325000, People’s Republic of China; 2Department of Respiratory, Xiamen Second hospital, Xiamen, People’s Republic of China; 3Department of Emergency, Wenzhou Hospital of Integrated Traditional Chinese and Western Medicine, Wenzhou, People’s Republic of China
Correspondence: Xinran Lin, Department of Gastroenterology and Hepatology, The First Affiliated Hospital of Wenzhou Medical University, Wenzhou, 325000, People’s Republic of China, Tel +86 18857838243, Email [email protected]
Objective: This study aimed to identify the risk factors and construct a reliable prediction model of 28-day all-cause mortality in critically ill patients with acute pancreatitis (AP) using machine learning techniques.
Methods: A total of 534 patients from three different institutions were included. Thirty-eight possible variables were collected from the Intensive care unit (ICU) admission for investigation. Patients were split into a training cohort (n = 400) and test cohort (n = 134) according to their source of hospital. The synthetic minority oversampling technique (SMOTE) was introduced to handle the inherent class imbalance. Six machine learning algorithms were applied in this study. The optimal machine learning model was chosen after patients in the test cohort were selected to validate the models. SHapley Additive exPlanation (SHAP) analysis was performed to rank the importance of variable. The predictive performance of the models was evaluated by the calibration curve, area under the receiver operating characteristics curves (AUROC), and decision clinical analysis.
Results: About 13.5% (72/534) of all patients eventually died of all-cause within 28 days of ICU admission. Eight important variables were screened out, including white blood cell count, platelets, body temperature, age, blood urea nitrogen, red blood cell distribution width, SpO2, and hemoglobin. The support vector machine (SVM) algorithm performed best in predicting 28-d all-cause death. Its AUROC reached 0.877 (95% CI: 0.809 to 0.927, p < 0.001), the Youden index was 0.634 (95% CI: 0.459 to 0.717). Based on the risk stratification system, the difference between the high-risk and low-risk groups was significantly different.
Conclusion: In conclusion, this study developed and validated SVM model, which better predicted 28-d all-cause mortality in critically ill patients with AP. In the future, we will continue to include patients from more institutions to conduct validation in different contexts and countries.
Keywords: all-cause mortality, machine learning, acute pancreatitis, prognosis, predict
Introduction
As one of the most common causes of gastrointestinal hospitalization, acute pancreatitis (AP) is a disease with a localized inflammatory state of the pancreas or a systemic inflammatory response mainly due to pancreatin overactivation.1 In developed countries, previous studies have shown that the incidence of AP is gradually increasing nowadays.2,3 The assessment of the severity of AP is usually based on the revised Atlanta classification and can be divided into three levels.4,5 Patients with mild AP progress slowly and have a relatively short clinical duration. However, approximately 20% of patients with mild AP may spontaneously progress to severe AP, which is often accompanied by systemic inflammatory response syndrome, infection, and persistent organ failure (including respiratory, cardiovascular, and renal systems) with an overall mortality rate of 20–40%.6 Moreover, previous study has reported that mortality rates were significantly higher among critically ill patients with AP.7 The mortality in critically ill patients with AP can be reduced through early detection and tailored precision treatment. Evidence from previous research indicates that implementing precision treatment within 48 hours of admission can markedly reduce the mortality rate in critically ill patients with AP cases.8 Therefore, it is essential for clinicians to assess the severity of AP disease earlier and to intervene in a timely manner to reduce patient mortality.
Machine learning (ML), a field of artificial intelligence, has been introduced to the development of precision medicine and has derived several tools to accurately predict outcomes and solve classification problems.9–11 ML can use a variety of algorithms to make predictions and incorporate a large number of previously unnoticed variables to improve predictions.12,13 In addition, ML-based models have often been rigorously validated against traditional statistical methods.14 Several studies have evaluated the use of ML as a predictive tool in conditions such as critical illness, chronic coronary disease and inflammatory bowel disease.15–18
Due to the complexity of ML models, many explanatory methods have been applied to help users better understand the results of ML models, including SHapley Additive exPlanation (SHAP) analysis.19 At present, the SHAP analysis is widely used in the medical field,20,21 and has also been applied as an interpretation approach for ML models.22,23
However, there are few studies that employ ML algorithms to predict mortality in critically ill patients with AP. Therefore, we collected relevant data on hospitalizations of patients with AP from different institutions. Then, the synthetic minority oversampling technique (SMOTE) algorithm was employed to construct the ML models. Our study aimed to develop various ML models based on relevant biological and clinical risk factors to predict 28-day-mortality in critically ill patients with AP, thus providing some help for clinical decision-making.
Methods
Selection of Participants
Patients diagnosed with AP in the ICU were included in this study. These individuals were admitted to three institutions: the First Affiliated Hospital of Wenzhou Medical University, Wenzhou Hospital of Integrated Traditional Chinese and Western Medicine, and Xiamen Second Hospital, between July 2016 and October 2023. The study was conducted in accordance with the Declaration of Helsinki and received the necessary approval from the Institutional Review Board (IRB)/Ethics Committee of each hospital. As the data used for this research were anonymized, removing all personal identifiers, the requirement for written informed consent was waived. Exclusion criteria were as follows: (1) patients aged less than 18 years at the time of first admission; (2) patients with severe diseases such as end-stage renal disease, cirrhosis, or cancer; (3) patients with ICU length of stay <24 hours. In total, 534 patients were included in this study.
Data Collection
Based on the literature search and review, 38 potential risk confounders were identified and extracted from the medical records. The extraction of potential variables could be divided into six main groups: (1) demographics, such as age, sex, BMI. (2) Admission vital signs, including heart rate, mean arterial pressure (MBP), systolic blood pressure (SBP), diastolic blood pressure (DBP), respiratory rate (RR). (3) Comorbidities, including hypertension, decompensated heart failure, obesity (BMI > 30kg/m2), diabetes, chronic obstructive pulmonary disease. (4) Laboratory indicators, including erythrocyte, erythrocyte distribution width (RDW), mean corpuscular volume, mean corpuscular hemoglobin concentration, mean corpuscular hemoglobin, hemoglobin, hematocrit, platelets, white blood cells, international normalized ratio (INR), total bilirubin, prothrombin time (PT), anion gap (AG), blood urea nitrogen (BUN), bicarbonate, serum calcium, serum potassium, serum chloride, serum sodium, serum creatinine, glucose. (5) Admission severity of illness scores, including Acute Physiology Score III (APSIII), Simplified Acute Physiology Score II (SAPS-II), Oxford Acute Severity of Illness Score (OASIS), and Sepsis-related Organ Failure Assessment Score (SOFA).24,25
Endpoint Events
Twenty-eight-day all-cause death after admission was the primary outcome of this study. Twenty-eight-day all-cause mortality was defined as the ratio of the total number of all-cause deaths during a 28-day hospital stay to the average population during the same period.
Class Imbalance
There was a class imbalance in our study. The proportion of survivors is almost eight times that of non-survivors, resulting in a significant class imbalance. Currently, the main approaches are resampling, cost-sensitive learning and ensemble learning.26 SMOTE sampling is the most widely used algorithm, proposed by Chawla in 2002.27 The SMOTE method adds new non-existent samples by inserting them into a small number of similarly located samples. This approach, compared to random oversampling, can potentially mitigate the risk of overfitting. To address the issue of class imbalance, we employed the SMOTE method in the formation of our training cohorts.
ML-Based Modelling
To develop the ML models with several risk factors, the Least Absolute Shrinkage and Selection Operator (LASSO) logistic regression combined with 10-fold cross-validation was used to screen out the potential risk factors. LASSO regression, a penalized regression approach, could minimize the comparatively irrelevant risk factors’ coefficient to zero, thereby excluding those unimportant risk factors and calculating the optimal parameter λ value. Then, LASSO regression analysis results were employed to perform Cox regression analysis, and finally, variables of p < 0.05 were obtained. Selected variables were put into develop ML models. Six ML algorithms including eXtreme gradient Boosting (XGB), Naïve Bayes (NB), support vector machine (SVM), random forest (RF), Advanced Boosting (AdaBoost), and linear regression (LR) were applied to develop models using the training set.
Statistical Analysis
Continuous variables were expressed as either mean ± standard deviation (SD) or median (inter-quartile range) based on their distribution. Categorical variables, on the other hand, were represented as proportions. The Kolmogorov–Smirnov test was utilized to assess the normality of continuous variables. For the analysis of these variables, we applied either the t-test or the Wilcoxon rank test. Categorical variables were compared using the Chi-square test or Fisher’s exact test. In the case of variables with missing values, multiple interpolation was employed to generate an appropriate data set for filling in these gaps. The discriminative capacity of ML models was evaluated using the area under the receiver operating curve (AUROC), with a model deemed excellent if its AUROC value exceeded 0.80.28 For the completeness and accuracy of the results, accuracy, precision, recall, and F1-score were also calculated. Hosmer-Lemeshow test was introduced to test the model’s goodness-of-fit. Optimal cut-off values were obtained by Youden’s index, representing the maximum sum of specificity plus sensitivity, and further evaluated for sensitivity, specificity, and for positive and negative predictive values. Kaplan–Meier survival curves were conducted to compare the difference of 28-d all-cause mortality between high- and low-risk groups. Decision curve analysis (DCA) was employed to compare the net benefit of ML model through the difference between the number of true-positives and false-positives and consider the odds of a specific threshold probability.29 Additionally, a calibration curve was utilized to visually represent the correlation between the predicted probability and the actual probability, facilitated by the calculation of the calibration slope. To visually depict the importance of features in ML models, we implemented SHAP analysis. This method effectively demonstrated the most influential features for the ML model predictions and quantified their contribution to the overall model performance for a specific prediction.30 A double-sided p < 0.05 was regarded as statistically significant. All statistical analysis was conducted by the R software (version 4.0.2) and its packages, including fastshap package (version 0.0.7), tidyverse package (version 1.3.0) and tidyquant package (version 1.0.2) and Python (version 3.6).
Results
Baseline Characteristics
A total of 534 patients were enrolled in our study. Among these, a total of 400 patients were from institution 1 consisted of the training set, and 134 patients were from the other medical centers consisted of the external test set (Figure 1). Twenty-eight-d all-cause death occurred in 72 cases (13.5%) in the whole cohort. It included 314 (58.2%) males and 220 (41.2%) females. The median age of all patients was 56.5 (44.0, 72.0) years. When compared to the survival group, non-survival patients were older and had lower SBP, DBP, MBP, platelet, and bicarbonate, while higher RR, SOFA, APS-III, SAPS-II, OASIS, RDW, WBC, INR, PT, AG, and creatinine (p < 0.001) (Table 1). The baseline data of the training set and the external test set are displayed in Table 2. No significant difference was observed between the two groups (p > 0.05).
 |
Table 1 Baseline Characteristics in the Survivors and Non-Survivors |
 |
Table 2 Baseline Characteristics in the Training and External Test Set Cohort |
 |
Figure 1 The flowchart of patients selection. |
Feature Selection
A total of 38 variables were obtained from the medical records. With the optimal alpha parameter, the LASSO was employed to decrease the dimension of the variables and filter out the best variables. After compressing variable coefficients to avoid models’ overfitting and collinearity problems by LASSO analysis, 38 variables were reduced to 17. To further control the influence of confounding factors, the 17 variables were further analyzed using the Cox proportion regression analysis (Table 3). Finally, 8 variables were obtained, including white blood cell, platelet, body temperature, age, BUN, red blood cell distribution width, SpO2, and hemoglobin.
 |
Table 3 Multivariate COX Proportional Hazard Ratio Regression of Risk Factors for Death Within 28-d in Patients with Acute Pancreatitis |
Diagnostic Performance of ML Models
These 8 variables were put into developing six ML models. As shown in Figure 2a and b, all six ML models performed well in predicting 28-d all-cause death in the training and test set, and we also further calculated the relevant scores of models, including accuracy, precision, recall, F1-score, positive and negative likelihood ratios, diagnostic odds ratio, and Matthews correlation coefficient (Table 4). The ROC results demonstrated that RF was the highest in the training set and SVM was the highest in the test set. However, the AUC indicator focused on the predictive accuracy of the models and could not discriminate whether the model was clinically applicable or which one of the two is more suitable.31,32 Then the DCA and Hosmer-Lemeshow were further analyzed among these algorithms. The DCA curve showed that SVM had better clinical suitability across a range of reasonable high-risk thresholds (Figure 3). The Hosmer–Lemeshow goodness-of-fit test demonstrated that the SVM had good calibration (Hosmer–Lemeshow test: χ2=2.557, P=0.959). Comprehensive analysis demonstrated that SVM could be considered the optimal model.
 |
Table 4 Diagnostic Accuracy for the Five Machine Learning Algorithms with the External Test Data Set of AP Patients |
 |
Figure 2 ROC curves of 5 machine learning models in predicting 28-d all cause death for AP patients. (a) ROC curves of the machine learning models using the 10-fold cross-validation in the AP training cohort. (b) ROC curve analysis of machine learning algorithms for prediction of 28-d all cause death AP patients in the test set. Abbreviations: RF, random forests; AdaBoost, Adaptive Boosting; SVM, support vector machines; NB, naïve Bayes; XGBoost, eXtreme Gradient Boosting; LR, linear regression; ROC, receiver operating characteristic; AUC, area under the curve; CI, confidence interval. |
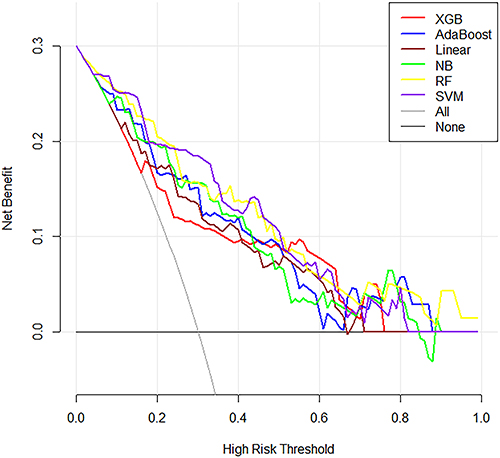 |
Figure 3 Decision curves analyses for 5 machine learning models to predict the 28-d all cause death of the patients. The gray line shows the net benefit of recommending intervention to every patient, and the black line was no-intervention taking. |
The Kaplan-Meier curve and calibration curve were also plotted to visualize the prognostic performance of the SVM algorithm. With the optimal cut-off value, the included patients were divided into a high-risk group (n = 78) and low-risk group (n = 56). The Kaplan–Meier method was employed to demonstrate that the 28-d death differed significantly between the high- and low-risk group (Figure 4a). The calibration plots demonstrated good agreement between the SVM prediction and the actual observed death in the external test cohorts (Figure 4b).
 |
Figure 4 (a) Survivor (percent) during the follow-up for the y-axis of the graph and follow-up Time for the x-axis; (b) The calibration curve of the SVM for the 28-d all cause death probability. |
Model’s Explainability
Figure 5a depicts the SHAP values, combining the importance and effects of features for all individuals, based on the Support Vector Machine (SVM) model. Each point on the diagram symbolized a feature and its corresponding Shapley value, indicating the contribution of each feature to the model’s predicted output. The contributions of each individual were represented by two dot types, with red dots indicating high-risk values and blue dots indicating low-risk values. The feature values were color-coded, and their importance was ordered from top to bottom along the Y-axis (as shown in Figure 5b). The current SHAP results indicated that the WBC count was the most significant feature in predicting the Shapley value, followed by the platelet count. A lower platelet count (depicted in pink) was associated with Shapley values and served as a positive predictor of all-cause mortality at 28 days. Similarly, a lower temperature and higher age were associated with Shapley values and served as positive predictors of cognitive decline. In summary, the SHAP analysis revealed that WBC, age, BUN, Red Cell Distribution Width (RDW), and hemoglobin were positive predictors of all-cause death at 28 days. Conversely, platelet count, body temperature, and SpO2 were negative predictors of all-cause death at 28 days.
 |
Figure 5 SHAP interprets the model. (a) Attributes of features in SHAP. Each line represents a feature, and the abscissa is the SHAP value. Pink dots represent higher eigenvalues and blue dots represent lower eigenvalues. (b) Feature importance ranking as indicated by SHAP. The matrix diagram describes the importance of each covariate in the development of the final prediction model. (c) SHAP plot to correctly predict all cause death in a specific patient. (d) SHAP plot to correctly predict survivor in a specific patient. Red box represents predictors of active status of disease activity, while blue represents predictors of remission. |
Figure 5c and d displayed the individual SHAP plot for predicting specific patient 28-days all-cause death. We presented several random cases. Figure 5c demonstrated the SHAP plot to correctly predict 28-days all-cause death; the predictive model was supported by the Shapley value of, older age, higher value of BUN and RDW. Figure 5d SHAP plot to correctly predict survival; the prediction model was supported by the Shapley value of higher platelets and temperature and the lower values of WBC and BUN.
Discussion
Given its computational prowess and capacity to handle vast data volumes, ML has been harnessed in the advancement of precision medicine, serving as a conduit for in-depth analysis. In the present study, we developed and validated a precise ML model to predict 28-day mortality in AP patients in critical condition. Specifically, our analysis using LASSO and SHAP revealed that higher age, WBC count, BUN, RDW, and lower counts of platelets, body temperature, and SpO2 were factors more likely to be associated with all-cause mortality at 28 days.
Previous studies suggested that age is a potential contributing factor related to worse prognosis in patients with AP.33 Elderly patients have a higher proportion of chronic diseases, cardiac and pulmonary dysfunction, resulting in a worse outcome. Several studies have also suggested that elderly patients with AP are likely to have atypical clinical presentation and poor prognosis, mainly due to existing comorbidities.34–37
Moreover, abnormal vital signs including temperature and SpO2 were associated with worse prognosis.38,39 Basic medical information is commonly employed in ICUs, which means that vital signs are accessible and could be included in many prediction models. Body temperature was another important variable in our model, which potentially leads to excessive oxygen molecules that cannot be fully utilized by the tissue.40 According to its SHAP analysis, lower body temperature was an important predictive factor for 28-d mortality. Regarding laboratory tests, five variables were selected to develop models. Several published studies have confirmed that some variables were associated with prognosis. For example, O’Connell et al41 indicated that RDW could be used to identify patients at risk of severe disease condition on the presentation to the emergency department. Zheng et al42 concluded that white blood cell count can be employed to construct tool to predict the severity of AP. Tokoro et al43 suggested that platelets play a pivotal role in the mechanism of disease progression in AP. The merit of these models lies in their ability to contextualize the clinical features of newly admitted patients within similar clinical experiences. This provides a reliable foundation for physicians, particularly those who may be unfamiliar with the patients’ conditions.44 Believable models are of need to provide trustworthy, available, and efficient health management, and the models we have developed are paving the way for that process.
In our current research, we employed various ML algorithms, among which the SVM model demonstrated superior performance compared to other algorithms. This superiority was established after a thorough comparison of AUC, DCA, and goodness-of-fit test. Nonetheless, comprehending the ML prediction model in its entirety posed a challenge. Consequently, we applied the SHAP methodology to the SVM model to achieve optimal predictive power and interpretability. This allowed us to identify some key variables associated with the prognosis of critically ill patients suffering from AP.
The SVM model was developed using patient routine indicators. The patients were identified as high-risk patients would preferentially receive more positive intervention. In clinical settings, the developed model could be integrated to enhance several aspects of patient care. Initially, upon hospital admission, the model could generate a predictive score from vital signs, and laboratory results, all of which are routinely available. This use of ML to predict clinical outcomes could effectively prioritize patients at high risk, ensuring they receive prompt clinical and supportive care. Furthermore, in cases of AP patients presenting with complicated or rare conditions, particularly in regions where medical resources are limited, the application of ML model can assist clinicians in making decisions regarding clinical management.
Our study was a multi-institution research, which is a common way of efficiently evaluating a new technique and could provide a reliable foundation for the subsequent generalization of our models. However, several limitations of this study should be acknowledged. First, due to its retrospective nature, selection bias of patients was inevitable. Given that our study was multi-center study with a limited sample of patients with AP, it is imperative to conduct future prospective studies with larger-sample patients to further validate these findings. Thirdly, some variables such as the level of interleukin, albumin and CRP were not considered in our study due to their unavailability of these variables, might result in confounding bias; however, the ML models analyzed up to 38 variables potential variables including vital signs, admission laboratory tests, demographics, and comorbidities, representing that the included variables were comprehensive. For another thing, missing values were unavoidable in this database, and these missing values would influence the study’s conclusions.
Conclusions
In conclusion, this study screened out 8 important variables associated with 28-day all-cause mortality and developed an SVM model that may provide clinicians with a better tool for timely intervention in critically ill patients with AP. The predictive model outperformed conventional scoring systems and provided assistance for first-line clinicians to identify high-risk patients.
Data Sharing Statement
The datasets generated and analyzed during the current study are available from the corresponding author on reasonable request.
Ethics Approval and Consent to Participate
The study was performed according to the guidelines of the Helsinki Declaration.
The use of the medical data was approved by the review committee of each hospital. The ethical approval statement and the requirement for informed consent were waived for this study.
Consent for Publication
All authors approved the final manuscript and the submission to this journal.
Author Contributions
All authors made a significant contribution to the work reported, whether that is in the conception, study design, execution, acquisition of data, analysis and interpretation, or in all these areas; took part in drafting, revising or critically reviewing the article; gave final approval of the version to be published; have agreed on the journal to which the article has been submitted; and agree to be accountable for all aspects of the work.
Funding
There is no funding to report.
Disclosure
The authors declare that they have no competing interests in this work.
References
1. Goyal H, Awad H, Hu ZD. Prognostic value of admission red blood cell distribution width in acute pancreatitis: a systematic review. Ann Transl Med. 2017;5(17):342. doi:10.21037/atm.2017.06.61
2. Leppäniemi A, Tolonen M, Tarasconi A, et al. 2019 WSES guidelines for the management of severe acute pancreatitis. World J Emerg Surg. 2019;14(1):27. doi:10.1186/s13017-019-0247-0
3. Boxhoorn L, Voermans RP, Bouwense SA, et al. Acute pancreatitis. Lancet. 2020;396(10252):726–734. doi:10.1016/S0140-6736(20)31310-6
4. Banks PA, Bollen TL, Dervenis C, et al. Classification of acute pancreatitis--2012: revision of the Atlanta classification and definitions by international consensus. Gut. 2013;62(1):102–111. doi:10.1136/gutjnl-2012-302779
5. Colvin SD, Smith EN, Morgan DE, Porter KK. Acute pancreatitis: an update on the revised Atlanta classification. Abdom Radiol. 2020;45(5):1222–1231. doi:10.1007/s00261-019-02214-w
6. Schepers NJ, Bakker OJ, Besselink MG, et al. Impact of characteristics of organ failure and infected necrosis on mortality in necrotising pancreatitis. Gut. 2019;68(6):1044–1051. doi:10.1136/gutjnl-2017-314657
7. Yasuda H, Horibe M, Sanui M, et al. Etiology and mortality in severe acute pancreatitis: a multicenter study in Japan. Pancreatology. 2020;20(3):307–317. doi:10.1016/j.pan.2020.03.001
8. Petrov MS, Pylypchuk RD, Uchugina AF. A systematic review on the timing of artificial nutrition in acute pancreatitis. Br J Nutr. 2009;101(6):787–793. doi:10.1017/S0007114508123443
9. Zhang Z, Ho KM, Hong Y. Machine learning for the prediction of volume responsiveness in patients with oliguric acute kidney injury in critical care. Crit Care. 2019;23(1):112. doi:10.1186/s13054-019-2411-z
10. Luo JC, Zhao QY, Tu GW. Clinical prediction models in the precision medicine era: old and new algorithms. Ann Transl Med. 2020;8(6):274. doi:10.21037/atm.2020.02.63
11. Zhao QY, Wang H, Luo JC, et al. Development and validation of a machine-learning model for prediction of extubation failure in intensive care units. Front Med Lausanne. 2021;8:676343. doi:10.3389/fmed.2021.676343
12. Yue S, Li S, Huang X, et al. Machine learning for the prediction of acute kidney injury in patients with sepsis. J Transl Med. 2022;20(1):215. doi:10.1186/s12967-022-03364-0
13. Woodman RJ, Bryant K, Sorich MJ, Pilotto A, Mangoni AA. Use of multiprognostic index domain scores, clinical data, and machine learning to improve 12-month mortality risk prediction in older hospitalized patients: prospective cohort study. J Med Internet Res. 2021;23(6):e26139. doi:10.2196/26139
14. Xu Z, Guo K, Chu W, Lou J, Chen C. Performance of machine learning algorithms for predicting adverse outcomes in community-acquired pneumonia. Front Bioeng Biotechnol. 2022;10:903426. doi:10.3389/fbioe.2022.903426
15. Lei M, Han Z, Wang S, et al. Biological signatures and prediction of an immunosuppressive status-persistent critical illness-among orthopedic trauma patients using machine learning techniques. Front Immunol. 2022;13:979877. doi:10.3389/fimmu.2022.979877
16. Yan J, Tian J, Yang H, et al. A clinical decision support system for predicting coronary artery stenosis in patients with suspected coronary heart disease. Comput Biol Med. 2022;151(Pt A):106300. doi:10.1016/j.compbiomed.2022.106300
17. Kraszewski S, Szczurek W, Szymczak J, Reguła M, Neubauer K. Machine learning prediction model for inflammatory bowel disease based on laboratory markers. working model in a discovery cohort study. J Clin Med. 2021;10(20):4745. doi:10.3390/jcm10204745
18. Cai W, Xu J, Chen Y, Wu X, Zeng Y, Yu F. Performance of machine learning algorithms for predicting disease activity in inflammatory bowel disease. Inflammation. 2023;46(4):1561–1574. doi:10.1007/s10753-023-01827-0
19. Lundberg SM, Erion G, Chen H, et al. From local explanations to global understanding with explainable ai for trees. Nat Mach Intell. 2020;2(1):56–67. doi:10.1038/s42256-019-0138-9
20. Thorsen-Meyer HC, Placido D, Kaas-Hansen BS, et al. Discrete-time survival analysis in the critically ill: a deep learning approach using heterogeneous data. NPJ Digit Med. 2022;5(1):142. doi:10.1038/s41746-022-00679-6
21. Zheng W, Gao L, Fan Y, et al. Identification of risk factors for attempted suicide by self-poisoning and a nomogram to predict self-poisoning suicide. Front Public Health. 2023;11:1106454. doi:10.3389/fpubh.2023.1106454
22. Yu H, Chen F, Lam KO, et al. Potential determinants for radiation-induced lymphopenia in patients with breast cancer using interpretable machine learning approach. Front Immunol. 2022;13:768811. doi:10.3389/fimmu.2022.768811
23. Dimitsaki S, Gavriilidis GI, Dimitriadis VK, Natsiavas P. Benchmarking of machine learning classifiers on plasma proteomic for COVID-19 severity prediction through interpretable artificial intelligence. Artif Intell Med. 2023;137:102490. doi:10.1016/j.artmed.2023.102490
24. Vincent JL, de Mendonça A, Cantraine F, et al. Use of the SOFA score to assess the incidence of organ dysfunction/failure in intensive care units: results of a multicenter, prospective study. Working group on ”sepsis-related problems” of the European society of intensive care medicine. Crit Care Med. 1998;26(11):1793–1800. doi:10.1097/00003246-199811000-00016
25. Vincent JL, Moreno R, Takala J, et al. The SOFA (Sepsis-related Organ Failure Assessment) score to describe organ dysfunction/failure. On behalf of the working group on sepsis-related problems of the European society of intensive care medicine. Intensive Care Med. 1996;22(7):707–710. doi:10.1007/BF01709751
26. Lanera C, Berchialla P, Sharma A, Minto C, Gregori D, Baldi I. Screening PubMed abstracts: is class imbalance always a challenge to machine learning? Syst Rev. 2019;8(1):317. doi:10.1186/s13643-019-1245-8
27. Dablain D, Krawczyk B, Chawla NV: DeepSMOTE: fusing deep learning and SMOTE for imbalanced data. IEEE Trans Neural Netw Learn Syst. 2022;34(9):6390–6404.
28. Alba AC, Agoritsas T, Walsh M, et al. Discrimination and calibration of clinical prediction models: users’ guides to the medical literature. JAMA. 2017;318(14):1377–1384. doi:10.1001/jama.2017.12126
29. Vickers AJ, Cronin AM, Elkin EB, Gonen M. Extensions to decision curve analysis, a novel method for evaluating diagnostic tests, prediction models and molecular markers. BMC Med Inform Decis Mak. 2008;8(1):53. doi:10.1186/1472-6947-8-53
30. Bang CS, Ahn JY, Kim JH, Kim YI, Choi IJ, Shin WG. Establishing machine learning models to predict curative resection in early gastric cancer with undifferentiated histology: development and usability study. J Med Internet Res. 2021;23(4):e25053. doi:10.2196/25053
31. Obuchowski NA, Bullen JA. Receiver operating characteristic (ROC) curves: review of methods with applications in diagnostic medicine. Phys Med Biol. 2018;63(7):07tr01. doi:10.1088/1361-6560/aab4b1
32. Muschelli J. ROC and AUC with a binary predictor: a potentially misleading metric. J Classif. 2020;37(3):696–708. doi:10.1007/s00357-019-09345-1
33. Guo X, Li Y, Lin H, et al. A nomogram for clinical estimation of acute biliary pancreatitis risk among patients with symptomatic gallstones: a retrospective case-control study. Front Cell Infect Microbiol. 2022;12:935927. doi:10.3389/fcimb.2022.935927
34. Carvalho JR, Fernandes SR, Santos P, Moura CM, Antunes T, Velosa J. Acute pancreatitis in the elderly: a cause for increased concern? Eur J Gastroenterol Hepatol. 2018;30(3):337–341. doi:10.1097/MEG.0000000000001028
35. Kim DB, Chung WC, Lee JM, Lee KM, Oh JH, Jeon EJ. Analysis of factors associated with the severity of acute pancreatitis according to etiology. Gastroenterol Res Pract. 2017;2017:1219464. doi:10.1155/2017/1219464
36. Gardner TB, Vege SS, Chari ST, et al. The effect of age on hospital outcomes in severe acute pancreatitis. Pancreatology. 2008;8(3):265–270. doi:10.1159/000134274
37. Szakács Z, Gede N, Pécsi D, et al. Aging and comorbidities in acute pancreatitis II.: a cohort-analysis of 1203 prospectively collected cases. Front Physiol. 2018;9:1776. doi:10.3389/fphys.2018.01776
38. Thandassery RB, Yadav TD, Dutta U, Appasani S, Singh K, Kochhar R. Hypotension in the first week of acute pancreatitis and APACHE II score predict development of infected pancreatic necrosis. Dig Dis Sci. 2015;60(2):537–542. doi:10.1007/s10620-014-3081-y
39. Inoue H, Uemura S, Harada K, et al. Risk factors for acute pancreatitis in patients with accidental hypothermia. Am J Emerg Med. 2019;37(2):189–193. doi:10.1016/j.ajem.2018.05.008
40. Yamamoto R, Yoshizawa J, Takauji S, Hayakawa M, Sasaki J. Hyperoxia for accidental hypothermia and increased mortality: a post-hoc analysis of a multicenter prospective observational study. Crit Care. 2023;27(1):131. doi:10.1186/s13054-023-04407-8
41. O’Connell RM, Boland MR, O’Driscoll J, et al. Red cell distribution width and neutrophil to lymphocyte ratio as predictors of outcomes in acute pancreatitis: a retrospective cohort study. Int J Surg. 2018;55:124–127. doi:10.1016/j.ijsu.2018.05.028
42. Zheng ZX, Bi JT, Cai X, Liu YQ. The clinical significance of body mass index in the early evaluation of acute biliary pancreatitis. Heliyon. 2022;8(12):e12003. doi:10.1016/j.heliyon.2022.e12003
43. Tokoro T, Makino I, Harada S, et al. Interactions between neutrophils and platelets in the progression of acute pancreatitis. Pancreas. 2020;49(6):830–836. doi:10.1097/MPA.0000000000001585
44. Jones BE, Ying J, Nevers M, et al. Computerized mortality prediction for community-acquired pneumonia at 117 veterans affairs medical centers. Ann Am Thorac Soc. 2021;18(7):1175–1184. doi:10.1513/AnnalsATS.202011-1372OC
 © 2024 The Author(s). This work is published and licensed by Dove Medical Press Limited. The
full terms of this license are available at https://www.dovepress.com/terms.php
and incorporate the Creative Commons Attribution
- Non Commercial (unported, 3.0) License.
By accessing the work you hereby accept the Terms. Non-commercial uses of the work are permitted
without any further permission from Dove Medical Press Limited, provided the work is properly
attributed. For permission for commercial use of this work, please see paragraphs 4.2 and 5 of our Terms.
© 2024 The Author(s). This work is published and licensed by Dove Medical Press Limited. The
full terms of this license are available at https://www.dovepress.com/terms.php
and incorporate the Creative Commons Attribution
- Non Commercial (unported, 3.0) License.
By accessing the work you hereby accept the Terms. Non-commercial uses of the work are permitted
without any further permission from Dove Medical Press Limited, provided the work is properly
attributed. For permission for commercial use of this work, please see paragraphs 4.2 and 5 of our Terms.