")
Back to Journals » Clinical Ophthalmology » Volume 19
Serum Apolipoprotein B and B/A1 Ratio as Early Negative Biomarkers for OCT- and OCTA-Detected Retinal Changes in Diabetic Macular Edema
Authors Soedarman S, Julia M , Gondhowiardjo TD , Kurnia KH, Prasetya ADB, Triyoga IF , Sasongko MB
Received 28 March 2025
Accepted for publication 24 June 2025
Published 9 July 2025 Volume 2025:19 Pages 2165—2178
DOI https://doi.org/10.2147/OPTH.S527436
Checked for plagiarism Yes
Review by Single anonymous peer review
Peer reviewer comments 3
Editor who approved publication: Dr Scott Fraser
Soefiandi Soedarman,1,2,* Madarina Julia,3 Tjahjono Darminto Gondhowiardjo,1,2 King Hans Kurnia,1,* Alberthus Donni Budi Prasetya,1,* Ichsan Fauzi Triyoga,4 Muhammad Bayu Sasongko2
1JEC Eye Hospitals & Clinics, Jakarta, Indonesia; 2Department of Ophthalmology, Faculty of Medicine, Public Health, and Nursing, Universitas Gadjah Mada - Sardjito Eye Center, Dr. Sardjito General Hospital, Yogyakarta, Indonesia; 3Department of Paediatrics and Child Health, Faculty of Medicine, Public Health, and Nursing, Universitas Gadjah Mada, Yogyakarta, Indonesia; 4Faculty of Medicine, University of Indonesia, Jakarta, Indonesia
*These authors contributed equally to this work
Correspondence: Soefiandi Soedarman, JEC @Menteng Eye Hospitals, Jalan Teuku Cik Ditiro No. 46, Menteng, Jakarta, Indonesia, Tel +62 2922 1000; +62 8041221000, Email [email protected]
Purpose: This study aimed to explore the relationships between serum apolipoprotein A1 (ApoA1) and B (ApoB) levels and the ApoB/A1 ratio with structural and vascular changes in the retinas of patients with diabetic macular edema (DME), as assessed through optical coherence tomography (OCT) and OCT angiography (OCTA).
Methods: 62 eyes from 38 treatment-naive diabetic retinopathy patients were assessed. Baseline and 6-month evaluations included clinical exams, fundus photography, blood tests for cholesterol, ApoA1, and ApoB, as well as imaging with OCT and OCTA. Associations between apolipoproteins and changes in central retinal thickness (CRT), foveal avascular zone (FAZ), and vessel/perfusion density were analyzed.
Results: In DME patients, elevated ApoB levels (> 122.5 mg/dL) were significantly linked with increased CRT, FAZ expansion, and reduced perfusion density at the 6-month follow-up (p = 0.026, 0.046, and 0.025). Higher ApoB/A1 ratio (> 0.85) was significantly associated with decreased perfusion density (p = 0.011).
Conclusion: Elevated ApoB levels and ApoB/A1 ratio were linked with reduced perfusion and vessel density, increased CRT, and FAZ expansion, highlighting their potential as negative biomarkers for OCT-detected retinomacular changes.
Keywords: diabetic macular edema, serum apolipoprotein, optical coherence tomography, optical coherence tomography angiography, central macular thickness, fovea avascular zone
Introduction
Diabetic retinopathy (DR) is the most prevalent microvascular complication of diabetes mellitus (DM) and a leading cause of blindness among adults.1,2 Diabetic macular edema (DME), a manifestation that can occur at any stage of DR but is more common in severe DR, is characterized by increased macular thickness due to vascular permeability dysfunction.3–5 Globally, the prevalence of DME is 6.8%, with incidence rates rising from 3% within the first 5 years of DM diagnosis to 28% after 20 years.2,3,6,7 Optimal management of DME emphasizes strict glycemic control, preservation of renal function, and serum lipid regulation.8
Elevated serum lipid levels in patients with DR may exacerbate retinal microvascular injury through inflammatory reactions and the release of cytokines and growth factors, leading to hard exudate deposition the development of DME.9–11 Besides traditional serum lipids, the role of serum apolipoproteins (Apo) has received particular attention. Apolipoprotein B (ApoB), a component of low-density lipoprotein (LDL), intermediate-density lipoprotein (IDL), and very-low-density lipoprotein (VLDL), is responsible for the transport of lipids from the liver and intestines to peripheral tissues. ApoB has atherogenic factors, whereas apolipoprotein A1 (ApoA1), the primary component of high-density lipoprotein (HDL), has atheroprotective factors.12 Serum ApoA1 and ApoB have been linked to DR and DME in earlier studies.4,13,14 However, their relationship with optical coherence tomography (OCT) parameters in DME remains unexplored.
Advancements in imaging technology, particularly OCT and OCT angiography (OCT-A), provide valuable insights into DME. OCT evaluates macular thickness, micro-anatomical abnormalities, and morphological changes in the retina, aiding in the diagnosis of center-involving and non–center-involving DME, vitreoretinal traction, and other conditions. OCT is also essential for monitoring therapeutic responses.15–19 Complementing OCT, OCT-A offers detailed visualization of retinal vasculature and has proven useful in assessing DR severity and vascular alterations.20,21 However, despite these advancements, the role of serum apolipoproteins as potential markers for retinomacular changes observed in OCT and OCT-A in DME remains unclear, warranting further investigation.
This study aimed to determine the association between serum levels of ApoA1 and ApoB with changes in OCT and OCT-A parameters of the retina in patients with DME after 6 months of follow-up.
Methods
This prospective cohort study included 53 treatment-naive patients with type 2 diabetes mellitus (DM) and diabetic retinopathy (DR), with or without diabetic macular edema (DME), aged over 30 years. Recruitment of participants was conducted from March to October 2021 at Jakarta Eye Center, a tertiary eye center in Jakarta, Indonesia. Exclusion criteria included history of infection within the past 6 weeks, history of myocardial infarction or stroke (last 3 months), history of liver disease, kidney failure, or malignancy, and proliferative DR (PDR) with vitreous hemorrhage and/or tractional retinal detachment.
Written informed consent was obtained from each participant. This study followed the tenets of the Declaration of Helsinki, and was approved by the Ethical Committees of the Faculty of Medicine at Universitas Gadjah Mada (protocol code KE/FK/0353/EC/2021).
Clinical Assessment and Blood Chemistry
At baseline, 1 month, 3 months, and 6 months, all participants underwent comprehensive clinical and ophthalmologic exams. A trained nurse conducted clinical assessments, which included extracting participants’ medical histories, use of lipid-lowering, anti-DM, and antihypertensive drugs, evaluations of non-ophthalmic DM complications, and measurement of blood pressure (BP) at presentation. An automated digital monitor and cuff was used to record BP, with hypertension defined as current use of antihypertensive medications, systolic BP > 140 mmHg, or diastolic BP > 90 mmHg.
Blood samples were evaluated at presentation and 6 months after. Within one week of the eye examinations, samples obtained after over 8 hours of fasting were sent to a local accredited pathology center for the assessment of HbA1C, serum lipids (total cholesterol, HDL, LDL, and triglycerides), and apolipoprotein (ApoA1 and ApoB) levels.
Eye Examination and Assessment of DR and DME
A trained ophthalmic nurse performed eye examinations, including visual acuity (VA), intraocular pressure (IOP), and anterior segment assessments, with verification by an ophthalmologist. DR and DME were assessed and graded by disc- and macula-centered fundus photography and spectral-domain OCT (CIRRUS 6000, Carl Zeiss Meditec, Dublin, CA, USA) of the retina of each participant with standard macular cube and angiography scan protocols. All scans were centered on the fovea and obtained under consistent settings following manufacturer recommendations.
Based on the OCT and OCT-A results, the following data were collected: central retinal thickness (CRT), foveal avascular zone (FAZ), vessel density (VD), and perfusion density (PD). DR was graded as mild, moderate, severe nonproliferative DR (NPDR) and PDR. DME was graded by a retinal specialist as absent and present using clinical examination, retinal photography, OCT, and OCT-A findings. Indicators of DME included hard exudates, increased macular thickness, foveal pit elevation, and macular fluid. Incident DME was defined as DME that was not present at baseline but developed during the 3- or 6-month follow-up. Persistent DME referred to DME that was present at baseline and persisted through the 6-month follow-up despite anti-VEGF injections. Regression of DME was noted if participants who were diagnosed with DME at presentation demonstrated a complete resolution of the condition at the last study observation.
All participants received therapy as indicated. Patients with DME were administered anti-VEGF (bevacizumab) injections monthly for three months. If DME persisted after the initial therapy regimen, additional monthly treatments were administered up to the sixth month. Participants also underwent laser photocoagulation where indicated. DME progression and OCT and OCT-A parameters, as well as its response to therapy, were noted.
Statistical Analysis
All statistical analyses were performed using Stata BE version 17.0. The baseline characteristics of participants with and without DME were compared using the chi-squared test for proportions and the t-test for means. The Kolmogorov–Smirnov normality test was used to assess data normality. Eye-specific data were used to analyze DR and DME. The associations between Apo and OCT and OCT-A parameters were analyzed using multivariate linear regression models, with adjustments made to account for potential intra-subject correlation. Apo variables were stratified using the median values of the study participants. Two models were developed: an unadjusted model (Model 1) and a model adjusted for age, sex, duration of diabetes, systolic blood pressure (SBP), and HbA1c (Model 2). A p-value of less than 0.05 was considered statistically significant.
Results
Of the 53 study participants, 15 (28.3%) dropped out. The analysis of 62 eyes from 38 study participants revealed that 67.7% (42 eyes) had DR without DME and 32.3% (20 eyes) had DR with DME. Male participants were more prevalent within the DME cohort (73.3% vs 39.5%, p = 0.03). DME patients also showed longer duration of diabetes (8.2 vs 5.6 years), worse mean baseline VA (0.36 vs 0.95, p < 0.01), and higher total cholesterol levels at baseline than the non-DME group (Table 1). Overall, the DME group demonstrated a trend towards poorer metabolic control, as indicated by higher mean levels of HbA1C, LDL, triglycerides, and ApoB and Apo B/A1 ratio, although no significant association was observed. ApoB levels were more elevated in the DME subset, although the difference was not statistically significant (p = 0.07).
 |
Table 1 Participant’s Baseline Characteristics |
OCT findings revealed significantly higher CRT within the DME cohort than the non-DME cohort (426.7 vs 257.0 µm, p < 0.01). These findings suggest that the DME group had higher central macular thickness (CMT), which aligns with the lower mean baseline VA described above. Data from OCT-A showed the DME group to possess higher FAZ and lower vessel and perfusion density than the non-DME group, although the differences were not significant.
Table 2 shows the blood chemistry characteristics of the study participants based on the stratification of DME progression status at the end of the study. A significant difference in ApoB levels and Apo B/A1 ratio was found between the participants classified in the DME regression/without DME group and those with incident/persistent DME. The incident/persistent DME group had significantly higher ApoB levels (p < 0.01) and Apo B/A1 ratio (p = 0.01). These results suggest that Apo levels may be associated with DME progression, potentially providing better stratification than other clinical and biochemical parameters such as HbA1C and traditional lipids.
 |
Table 2 Blood Chemistry Characteristics According to DME Progression |
The association between serum Apo levels and CRT, as the main sign of DME, and its interaction with covariables, namely age, sex, DM duration, SBP, and HbA1C levels, is shown in Table 3. Based on the univariate analysis (model 1), Apo B >122.5 mg/dL at baseline was significantly associated with greater CRT at 6-month follow-up (p = 0.013). This significant association can also be observed in the multivariate analysis (model 2, p = 0.026). A positive but non-significant association was also observed between Apo B/A1 >0.85 and increased CRT.
 |
Table 3 Association Between Apolipoprotein and Increased Central Retinal Thickness (CRT) at the 6-Month Follow-Up Based on Optical Coherence Tomography |
Stratification of changes in ApoA1 and ApoB levels and Apo B/A1 ratios to changes in CRT at the 6-month follow-up are shown in Figures 1–3. Data showed that the baseline ApoA1 stratification was not associated with changes in CRT (p = 0.72). On the contrary, the stratification of the baseline ApoB level and Apo B/A1 ratio correlated linearly with changes in CRT at the 6-month follow-up. ApoB levels higher than 122.5 were significantly associated with increased CRT (p = 0.01), whereas the association between a high Apo B/A1 ratio and increased CRT was not statistically significant (p = 0.07).
 |
Figure 1 Stratification of ApoA1 on changes in central macular thickness at the 6-month follow-up. |
 |
Figure 2 Stratification of ApoB on changes in central macular thickness at the 6-month follow-up. |
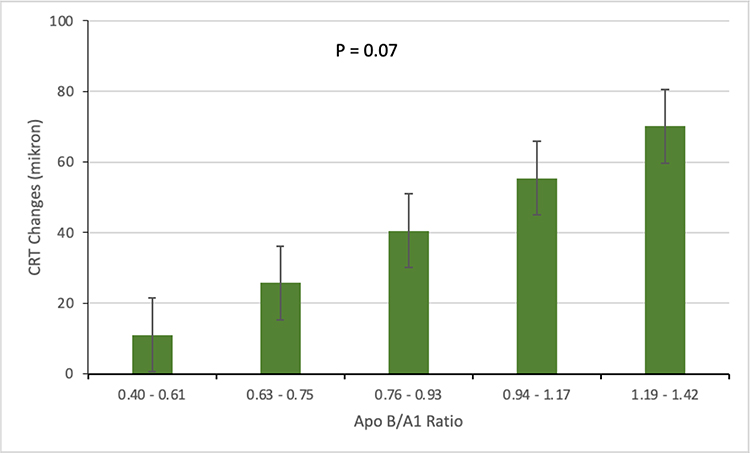 |
Figure 3 Stratification of the Apo B/A1 ratio on changes in central macular thickness at the 6-month follow-up. |
The association between serum Apo levels with changes in OCT-A parameters and their interactions with the covariables of age, sex, DM duration, SBO, and HbA1C levels are shown in Table 4. ApoB of >122.5 appeared to be significantly related to decreased VD, FAZ expansion, and decreased PD in the univariate analysis (p = 0.039, 0.02, and 0.039, respectively). These results were maintained in the multivariate analysis (model 2; p = 0.076, 0.046, and 0.025, respectively), except for the association with VD, which was not statistically significant (p = 0.076). Conversely, an Apo B/A1 ratio >0.85 was significantly associated with decreased PD in both univariate and multivariate analyses (p = 0.049 and 0.011, respectively). The high Apo B/A1 ratio was significantly associated with VD in the univariate analysis (p = 0.05), but not in the multivariate analysis (p = 0.09), and showed no association with the FAZ at the 6-month follow-up.
 |
Table 4 Association Between Apolipoprotein with Changes in OCT Angiography Parameters at the 6-Month Follow-Up |
Figures 4–6 show the association between the stratification of ApoA1 and ApoB levels and the Apo B/A1 ratio with the FAZ at the 6-month follow-up. High ApoB levels appeared to be significantly related to FAZ expansion (p = 0.013). The association between a high Apo B/A1 ratio and FAZ expansion was not statistically significant (p = 0.06).
 |
Figure 4 Stratification of ApoA1 on changes in the fovea avascular zone area at the 6-month follow-up. |
 |
Figure 5 Stratification of ApoB on changes in the fovea avascular zone area at the 6-month follow-up. |
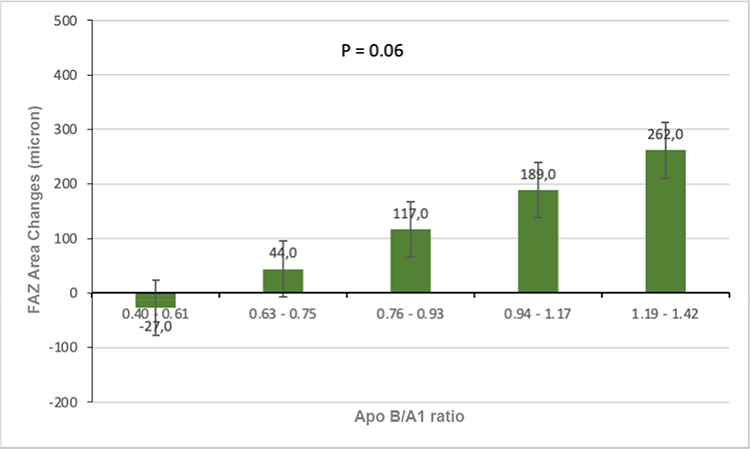 |
Figure 6 Stratification of Apo B/A1 ratio on changes in the fovea avascular zone area at the 6-month follow-up. |
Changes in ApoA1 and ApoB levels and the Apo B/A1 ratio and their association with changes in PD at the 6-month follow-up are shown in Figures 7–9. A significant association was found between higher ApoB (p = 0.011) and higher Apo B/A1 ratio (p = 0.026) with decreased PD on OCT-A. These inverse associations were interpreted as a lower percentage of blood flow in the macula at the end of the study in participants with higher ApoB levels and higher Apo B/A1 ratio.
 |
Figure 7 Stratification of ApoA1 on changes in perfusion density at the 6-month follow-up. |
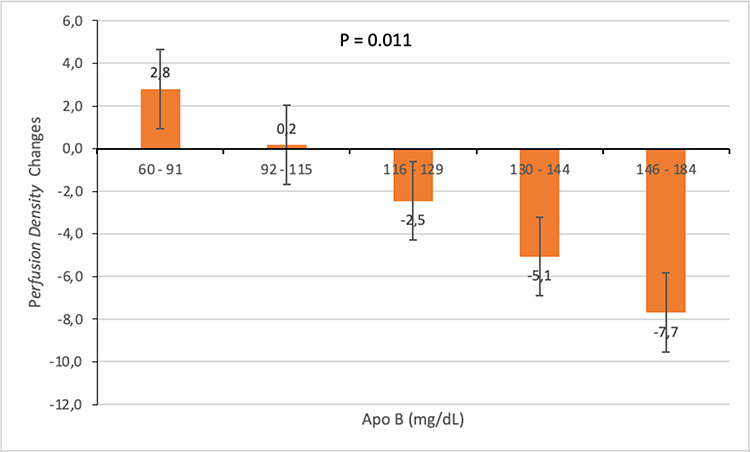 |
Figure 8 Stratification of ApoB on changes in perfusion density at the 6-month follow-up. |
 |
Figure 9 Stratification of the Apo B/A1 ratio on changes in perfusion density at the 6-month follow-up. |
The stratification of ApoA1 and ApoB levels and the Apo B/A1 ratio, along with their association with the VD at the 6-month follow-up is shown in Figures 10–12. A significant inverse association was found between the ApoB level and Apo B/A1 ratio and VD (each p = 0.02 for the ApoB level and Apo B/A1 ratio, respectively). These associations were interpreted as lower VD in the macula at the 6-month follow-up in participants with higher ApoB levels and Apo B/A1 ratio.
 |
Figure 10 Stratification of ApoA1 on changes in vessel density at the 6-month follow-up. |
 |
Figure 11 Stratification of ApoB on changes in vessel density at the 6-month follow-up. |
 |
Figure 12 Stratification of the Apo B/A1 ratio on changes in vessel density at the 6-month follow-up. |
Discussion
In this study, the proportion of DR without DME was higher than that of DR with DME (67.7% vs 32.3%), consistent with previous findings.22,23 Early diagnosis of DME is crucial for timely treatment planning, as its progression often involves complex metabolic alterations in retinal and vascular structures, detectable through OCT and OCT-A.
Dyslipidemia, which significantly impacts retinal vascular health, is a recognized metabolic risk factor for both DR and DME. Although our study found no significant differences in ApoA1, ApoB levels, or the Apo B/A1 ratio between the DME and non-DME groups at baseline, further analysis revealed significant differences in ApoB levels and the Apo B/A1 ratio among participants with progressive, regressive, and non-DME at the 6-month follow-up. Similar results were seen in Crosby-Nwaobi et al, where ApoB levels and Apo B/A1 ratios in PDR with DME patients were significantly elevated compared to NPDR.4 In a broader context, the ApoB/A1 ratio has also been associated with the progression of other diabetic complications, namely diabetic kidney disease (DKD), where elevated ratios (≥ 1.15) have been linked to a higher risk of progression to renal replacement therapy.24 These broader implications of the ApoB/A1 ratio suggest that lipid monitoring could provide valuable insights into the progression of diabetic pathology across multiple organ systems.
Several biomarkers have been utilized to assess lipid homeostasis in DME pathology, one of which is Apo. Apo is a protein which binds with lipids to create lipoproteins. These proteins carry lipids in the blood, cerebrospinal fluid, and lymph by forming water-soluble lipoprotein particles.25–28 Previous study has suggested Apo values to be stronger biomarkers in DR detection and severity compared to traditional lipid values,14 making them more suitable for evaluation in DME.
ApoA1, the major anti-atherogenic protein in HDL, exerts anti-inflammatory and anti-angiogenic effects by downregulating VEGF and inflammatory cytokines, potentially offering protection against DR and DME.12,14,29,30 In contrast, ApoB promotes atherogenesis and inflammation through cytokine release, contributing to retinal vascular damage. These opposing roles support the relevance of the ApoB/A1 ratio in DME progression.31,32
The ApoB/A1 ratio, which reflects the balance between atherogenic (ApoB) and anti-atherogenic (ApoA1) influences, offers a more comprehensive marker for DR progression than either protein alone.14,33,34 This ratio has been associated with increased DR risk across all stages and plays a greater role in PDR pathophysiology than ApoA1 alone. Its predictive value parallels that of the LDL/HDL ratio, where a high atherogenic burden may be masked by favorable levels of individual components. By integrating both protective and harmful lipid profiles, the ApoB/A1 ratio better represents the complex interplay of inflammation, oxidative stress, and vascular remodeling in DR.14,35,36
OCT was utilized in this study due to its critical role in detecting and monitoring abnormal macular thickening, often defined as foveal thickness exceeding 180 µm—a hallmark finding in DME.37 Beyond its diagnostic capability, OCT provided essential macular data, capturing structural changes such as serous retinal detachment, cystoid macular edema, and retinal thickening.38–40 These detailed imaging features were pivotal for evaluating clinical symptoms, disease progression, and treatment outcomes, as early edema manifests as reduced tissue reflectivity, progressing to cystoid spaces in the outer plexiform layer and, in chronic cases, retinal detachment, which can severely impair visual function.40 This relationship is evident in our study, where the mean baseline CRT was higher in the DME cohort (426.7 µm) compared to the non-DME cohort (257.0 µm). Correspondingly, the baseline VA analysis revealed significantly lower values in the DME cohort compared to its counterpart, likely attributable to the higher CRT findings. A study in Maryland, United States, also showed that increased CRT was clinically correlated with decreased visual acuity.41
Our study found a significant association between elevated baseline ApoB levels (>122.5 mg/dL) and increased CRT at the 6-month follow-up. To our knowledge, no prior studies have established a cutoff for serum ApoB levels in predicting retinal thickness progression. The threshold of 122.5 mg/dL was determined through statistical analysis, identifying it as a predictor of increased retinal thickness. Comparatively, studies on diabetic complications like kidney disease have used ApoB thresholds above 110 mg/dL to predict progression to renal replacement therapy.42 These findings suggest that baseline ApoB >122.5 mg/dL could serve as an early indicator of increased retinal thickness in DME patients, potentially informing prognosis at 6 months.
OCT-A imaging detects retinal vascular abnormalities such as neovascularization, vessel dilation, and capillary dropout. While non-DME eyes typically exhibit VD of 30.97–48.35 mm/mm²,43 PD of 42.2%,44 and FAZ of 0.28 mm² (0.08–0.46 mm²),45 no standardized normal ranges exist due to variations in equipment and operator techniques. In the context of our study, compared to non-DME eyes, participants with DME showed reduced VD (11.0 ± 4.8 mm/mm²), lower PD (26.5 ± 12.6%), and larger mean FAZ (0.51 ± 0.2 mm²).
Building on our OCT-A findings, baseline serum ApoB levels >122.5 mg/dL were significantly associated with FAZ enlargement, reduced PD, and possibly reduced VD at 6 months. An ApoB/A1 ratio >0.85 was also significantly linked to reduced PD (p = 0.011 in multivariate analyses). Participants with the lowest ApoB (60–91 mg/dL) and ApoB/A1 ratio (0.40–0.61) showed a trend toward higher PD and VD, but not FAZ. This suggests that vascular repair may occur earlier in VD and perfusion than in FAZ remodeling. These values were based on the median Apo data, as ROC analysis yielded non-significant AUCs, likely due to small sample size and high variability.
The above results revealed that ApoB was more significantly associated with changes in vascular parameters assessed by OCT-A, namely FAZ, VD, and PD, than ApoA1. The effect of expanding FAZ, decreasing VD, and decreasing PD associated with high ApoB levels may be due to the atherogenic effect of ApoB. As described above, ApoB is the main component of LDL, IDL, and VLDL, transporting cholesterol to peripheral tissues including blood vessels.46 In retinal blood vessels, reduced retinal blood flow due to plaque buildup contributes to decreased VD, PD, and FAZ expansion.47 These results emphasize the importance of early interventions to reduce ApoB levels or the ApoB/A1 ratio, which could help improve the macular vascularity index in DME and, ultimately, enhance visual outcomes.
The limitations of this study include its relatively small sample size and uneven distribution. Additionally, the high follow-up loss rate (28.3%) may have been influenced by the COVID-19 pandemic, with contributing factors such as patient mortality, COVID-19 infections, other illnesses, social restrictions, and patients’ reluctance to visit healthcare facilities. This substantial loss to follow-up may introduce bias and limit the generalizability of the findings; therefore, results from the multivariable analysis should be interpreted with caution. While our regression models accounted for intra-subject correlation, they did not model individual-level trajectories over time. Future studies with larger samples and more frequent follow-up points may benefit from using mixed-effects models to better capture within-subject variability.
In conclusion, baseline serum ApoB levels >122.5 mg/dL and an ApoB/A1 ratio >0.85 are predictive of worse CRT, FAZ, VD, and PD in patients with DME. As these biomarkers’ role in the progression of DME were evident in our study, these findings may support the use of serum Apo evaluation at presentation to help anticipate visual outcomes and retinal changes in patients with DME. Further larger-scale studies are necessary to confirm our findings and explore the potential for ApoB and ApoB/A1 ratio as predictive biomarkers for DME progression.
Author Contributions
All authors made a significant contribution to the work reported, whether that is in the conception, study design, execution, acquisition of data, analysis and interpretation, or in all these areas; took part in drafting, revising or critically reviewing the article; gave final approval of the version to be published; have agreed on the journal to which the article has been submitted; and agree to be accountable for all aspects of the work.
Funding
The authors did not receive inancial support from any rganization for the submitted work.
Disclosure
The authors report no conflicts of interest in this work.
References
1. Klein R, Klein BE, Moss SE, Davis MD, DeMets DL. The Wisconsin epidemiologic study of diabetic retinopathy. IV. Diabetic macular edema. Ophthalmology. 1984;91(12):1464–1474. doi:10.1016/s0161-6420(84)34102-1
2. Masuda T, Shimazawa M, Hashimoto Y, et al. Apolipoprotein E2 and E3, but not E4, promote retinal pathologic neovascularization. Invest Ophthalmol Vis Sci. 2017;58(2):1208–1217. doi:10.1167/iovs.16-20539
3. Mohamed Q, Gillies MC, Wong TY. Management of diabetic retinopathy: a systematic review. JAMA. 2007;298(8):902–916. doi:10.1001/jama.298.8.902
4. Crosby-Nwaobi R, Chatziralli I, Sergentanis T, Dew T, Forbes A, Sivaprasad S. Cross talk between lipid metabolism and inflammatory markers in patients with diabetic retinopathy. J Diabetes Res. 2015;2015:191382. doi:10.1155/2015/191382
5. Musat O, Cernat C, Labib M, et al. Diabetic macular edema. Rom J Ophthalmol. 2015;59(3):133–136.
6. Yau JWY, Rogers SL, Kawasaki R, et al. Global prevalence and major risk factors of diabetic retinopathy. Diabetes Care. 2012;35(3):556–564. doi:10.2337/dc11-1909
7. Klein R, Klein BE, Moss SE, et al. The Wisconsin epidemiologic study of diabetic retinopathy XV: The long-term incidence of macular edema. Ophthalmology. 1995;102:7–16. doi:10.1016/S0161-6420(95)31052-4
8. Romero-Aroca P. Managing diabetic macular edema: the leading cause of diabetes blindness. World J Diabetes. 2011;2(6):98–104. doi:10.4239/wjd.v2.i6.98
9. Ferris FL III, Chew EY, Hoogwerf BJ; Early treatment diabetic retinopathy study research group. Serum lipids and diabetic retinopathy. Diabetes Care. 1996;19(11):1291–1293.14. doi:10.2337/diacare.19.11.1291
10. Ferris FL III, Patz A. Macular edema. A complication of diabetic retinopathy. Surv Ophthalmol. 1984;28:452–461. doi:10.1016/0039-6257(84)90227-3
11. Landmesser U, Hornig B, Drexler H. Endothelial dysfunction in hypercholesterolemia: mechanisms, pathophysiological importance, and therapeutic interventions. Semin Thromb Hemost. 2000;26(5):529–537. doi:10.1055/s-2000-13209
12. Walldius G, Jungner I. The apoB/apoA-I ratio: a strong, new risk factor for cardiovascular disease and a target for lipid-lowering therapy-a review of the evidence. J Intern Med. 2006;259(5):493–519. doi:10.1111/j.1365-2796.2006.01643.x
13. Wu M, Chen Y, Wilson K, et al. Intraretinal leakage and oxidation of LDL in diabetic retinopathy. Invest Ophthalmol Vis Sci. 2008;49(6):2679–2685. doi:10.1167/iovs.07-1440
14. Sasongko MB, Wong TY, Nguyen TT, et al. Serum apolipoprotein AI and B are stronger biomarkers of diabetic retinopathy than traditional lipids. Diabetes Care. 2011;34(2):474–479. doi:10.2337/dc10-0793
15. Sikorski BL, Malukiewicz G, Stafiej J, Lesiewska-Junk H, Raczynska D. The diagnosis function of OCT in diabetic maculopathy. Mediators Inflamm. 2013;2013:434560. doi:10.1155/2013/434560
16. Lang GE. Optical coherence tomography findings in diabetic retinopathy. Dev Ophthalmol. 2007;39:31–47. doi:10.1159/000098498
17. Haller JA, Qin H; Diabetic Retinopathy Clinical Research Network Writing Committee, et al. Vitrectomy outcomes in eyes with diabetic macular edema and vitreomacular traction. Ophthalmology. 2010;117(6):1087–1093.e3. doi:10.1016/j.ophtha.2009.10.040
18. Park YG, Roh YJ. New diagnostic and therapeutic approaches for preventing the progression of diabetes retinopathy. J Diabetes Res. 2016;2016:1753584. doi:10.1155/2016/1753584
19. Wenick AS, Bressler NM. Diabetic macular edema: current and emerging therapies. Middle East Afr J Ophthalmol. 2012;19(1):4–12. doi:10.4103/0974-9233.92110
20. Corcóstegui B, Durán S, González-Albarrán MO, et al. Update on diagnosis and treatment of diabetic retinopathy: a consensus guideline of the working group of ocular health (Spanish society of diabetes and Spanish vitreous and retina society). J Ophthalmol. 2017;2017:8234186. doi:10.1155/2017/8234186
21. Salz DA, de Carlo TE, Adhi M, et al. Select features of diabetic retinopathy on swept-source optical coherence tomographic angiography compared with fluorescein angiography and normal eyes. JAMA Ophthalmol. 2016;134(6):644–650. doi:10.1001/jamaophthalmol.2016.0600
22. Acan D, Calan M, Er D, et al. The prevalence and systemic risk factors of diabetic macular edema: a cross-sectional study from Turkey. BMC Ophthalmol. 2018;18(1):91. doi:10.1186/s12886-018-0753-y
23. Jeng CJ, Hsieh YT, Yang CM, Yang CH, Lin CL, Wang IJ. Diabetic retinopathy in patients with diabetic nephropathy: development and progression. PLoS One. 2016;11(8):e0161897. doi:10.1371/journal.pone.0161897
24. Zhao WB, Alberto PSM. Serum apolipoprotein B/apolipoprotein A1 ratio is associated with the progression of diabetic kidney disease to renal replacement therapy. Int Urol Nephrol. 2020;52(10):1923–1928. doi:10.1007/s11255-020-02550-7
25. Ramasamy I. Recent advances in physiological lipoprotein metabolism. Clin Chem Lab Med. 2014;52(12):1695–1727. doi:10.1515/cclm-2013-0358
26. Zhang Q, Hu J, Hu Y, Ding Y, Zhu J, Zhuang C. Relationship between serum apolipoproteins levels and retinopathy risk in subjects with type 2 diabetes mellitus. Acta Diabetol. 2018;55(7):681–689. doi:10.1007/s00592-018-1136-9
27. Davidson MH. Apolipoprotein measurements: is more widespread use clinically indicated? Clin Cardiol. 2009;32(9):482–486. doi:10.1002/clc.20559
28. Marcovina S, Packard CJ. Measurement and meaning of apolipoprotein AI and apolipoprotein B plasma levels. J Intern Med. 2006;259(5):437–446. doi:10.1111/j.1365-2796.2006.01648.x
29. Deguchi Y, Maeno T, Saishin Y, Hori Y, Shiba T, Takahashi M. Relevance of the serum apolipoprotein ratio to diabetic retinopathy. Jpn J Ophthalmol. 2011;55(2):128–131. doi:10.1007/s10384-010-0913-y
30. Mangaraj M, Nanda R, Panda S. Apolipoprotein AI: a molecule of diverse function. Indian J Clin Biochem. 2016;31(3):253–259. doi:10.1007/s12291-015-0513-1
31. Sniderman AD, Thanassoulis G, Glavinovic T, et al. Apolipoprotein B particles and cardiovascular disease: a narrative review. JAMA Cardiol. 2019;4(12):1287–1295. doi:10.1001/jamacardio.2019.3780
32. Lee JY, Kang MJ, Choi JY, et al. Apolipoprotein B binds to enolase-1 and aggravates inflammation in rheumatoid arthritis. Ann Rheum Dis. 2018;77(10):1480–1489. doi:10.1136/annrheumdis-2018-213444
33. Ankit BS, Mathur G, Agrawal RP, Mathur KC. Stronger relationship of serum apolipoprotein A-1 and B with diabetic retinopathy than traditional lipids. Indian J Endocrinol Metab. 2017;21(1):102–105. doi:10.4103/2230-8210.196030
34. Lyons TJ, Jenkins AJ, Zheng D, et al. Diabetic retinopathy and serum lipoprotein subclasses in the DCCT/EDIC cohort. Invest Ophthalmol Vis Sci. 2004;45(3):910–918. doi:10.1167/iovs.02-0648
35. Moosaie F, Davatgari RM, Firouzabadi FD, et al. Lipoprotein(a) and apolipoproteins as predictors for diabetic retinopathy and its severity in adults with Type 2 diabetes: a case-cohort study. Can J Diabetes. 2020;44(5):414–421. doi:10.1016/j.jcjd.2020.01.007
36. Fernandez ML, Webb D. The LDL to HDL cholesterol ratio as a valuable tool to evaluate coronary heart disease risk. J Am Coll Nutr. 2008;27(1):1–5. doi:10.1080/07315724.2008.10719668
37. Sánchez-Tocino H, Alvarez-Vidal A, Maldonado MJ, Moreno-Montañés J, García-Layana A. Retinal thickness study with optical coherence tomography in patients with diabetes. Invest Ophthalmol Vis Sci. 2002;43(5):1588–1594.
38. Chalam KV, Bressler SB, Edwards AR, et al. Retinal thickness in people with diabetes and minimal or no diabetic retinopathy: Heidelberg Spectralis optical coherence tomography. Invest Ophthalmol Vis Sci. 2012;53(13):8154–8161. doi:10.1167/iovs.12-10290
39. Hee MR, Izatt JA, Swanson EA, et al. Optical coherence tomography of the human retina. Arch Ophthalmol. 1995;113(3):325–332. doi:10.1001/archopht.1995.01100030081025
40. Otani T, Kishi S, Maruyama Y. Patterns of diabetic macular edema with optical coherence tomography. Am J Ophthalmol. 1999;127(6):688–693. doi:10.1016/s0002-9394(99)00033-1
41. Browning DJ, Glassman AR; Diabetic Retinopathy Clinical Research Network. Relationship between optical coherence tomography-measured central retinal thickness and visual acuity in diabetic macular edema. Ophthalmology. 2007;114(3):525–536. doi:10.1016/j.ophtha.2006.06.052
42. Zhao WB, Zhu L, Rahman T. Increased serum concentration of apolipoprotein B is associated with an increased risk of reaching renal replacement therapy in patients with diabetic kidney disease. Ren Fail. 2020;42(1):323–328. doi:10.1080/0886022X.2020.1745235
43. Corvi F, Pellegrini M, Erba S, Cozzi M, Staurenghi G, Giani A. Reproducibility of vessel density, fractal dimension, and foveal avascular zone using 7 different optical coherence tomography angiography devices. Am J Ophthalmol. 2018;186:25–31. doi:10.1016/j.ajo.2017.11.011
44. Durbin MK, An L, Shemonski ND, et al. Quantification of retinal microvascular density in optical coherence tomographic angiography images in diabetic retinopathy. JAMA Ophthalmol. 2017;135(4):370–376. doi:10.1001/jamaophthalmol.2017.0080
45. Soules KA, Wolfson Y, Hsiao YS, Jang BK, Zhou Q. Assessment of foveal avascular zone (FAZ) area in normal and diabetic retinopathy eyes using OCT angiography (OCTA). Invest Ophthalmol Vis Sci. 2016;57(12):5497.
46. Olofsson SO, Borèn J. Apolipoprotein B: a clinically important apolipoprotein which assembles atherogenic lipoproteins and promotes the development of atherosclerosis. J Intern Med. 2005;258(5):395–410. doi:10.1111/j.1365-2796.2005.01556.x
47. Lin Y, Jiang H, Liu Y, et al. Age-related alterations in retinal tissue perfusion and volumetric vessel density. Invest Ophthalmol Vis Sci. 2019;60(2):685–693. doi:10.1167/iovs.18-25864
 © 2025 The Author(s). This work is published and licensed by Dove Medical Press Limited. The
full terms of this license are available at https://www.dovepress.com/terms.php
and incorporate the Creative Commons Attribution
- Non Commercial (unported, 4.0) License.
By accessing the work you hereby accept the Terms. Non-commercial uses of the work are permitted
without any further permission from Dove Medical Press Limited, provided the work is properly
attributed. For permission for commercial use of this work, please see paragraphs 4.2 and 5 of our Terms.
© 2025 The Author(s). This work is published and licensed by Dove Medical Press Limited. The
full terms of this license are available at https://www.dovepress.com/terms.php
and incorporate the Creative Commons Attribution
- Non Commercial (unported, 4.0) License.
By accessing the work you hereby accept the Terms. Non-commercial uses of the work are permitted
without any further permission from Dove Medical Press Limited, provided the work is properly
attributed. For permission for commercial use of this work, please see paragraphs 4.2 and 5 of our Terms.
Recommended articles
Effectiveness of Suprachoroidal Injection of Triamcinolone Acetonide in Resistant Diabetic Macular Edema Using a Modified Microneedle

Nawar AE
Clinical Ophthalmology 2022, 16:3821-3831
Published Date: 21 November 2022
Spotlight on Lattice Degeneration Imaging Techniques

Maltsev DS, Kulikov AN, Shaimova VA, Burnasheva MA, Vasiliev AS
Clinical Ophthalmology 2023, 17:2383-2395
Published Date: 16 August 2023
Switching to Conbercept in Diabetic Macular Edema After Unsatisfactory Response to Previous Intravitreal Injection of Ranibizumab
Xing P, Meng B, Hu X, Qu W, Wang S
Clinical Ophthalmology 2023, 17:3491-3497
Published Date: 17 November 2023