")
Back to Journals » Journal of Inflammation Research » Volume 17
Systemic Inflammatory Indicators and Risk of Incident Metabolically Unhealthy Phenotype
Authors Zhao L , Cui M, Yang S, Zhou H, Li M
Received 19 June 2024
Accepted for publication 20 September 2024
Published 30 September 2024 Volume 2024:17 Pages 6905—6916
DOI https://doi.org/10.2147/JIR.S474201
Checked for plagiarism Yes
Review by Single anonymous peer review
Peer reviewer comments 2
Editor who approved publication: Professor Ning Quan
Linlin Zhao,1,2 Man Cui,3 Saiqi Yang,1,2 Hui Zhou,1,2 Meng Li4
1Health Management Medicine Center, The Third Xiangya Hospital, Central South University, Changsha, Hunan, People’s Republic of China; 2Health Management Research Center, Central South University, Changsha, Hunan, People’s Republic of China; 3Department of Medical Administration, The Second Affiliated Hospital of Shandong University of Traditional Chinese Medicine, Jinan, Shandong, People’s Republic of China; 4Department of Endocrinology, The Second Affiliated Hospital of Shandong University of Traditional Chinese Medicine, Jinan, Shandong, People’s Republic of China
Correspondence: Meng Li, Email [email protected]
Objective: This retrospective cohort study was designed to evaluate the association between eight systemic inflammation indicators at baseline and the metabolically unhealthy (MU) phenotype after two years of follow-up.
Methods: Participants were defined as metabolically healthy (MH) if they met 0– 2 of the criteria and metabolically unhealthy (MU) if they met ≥ 3 of the criteria. A many of 4175 subjects aged 20– 80 years with a metabolically healthy (MH) phenotype at baseline were enrolled in the study. We compared the clinical characteristics between women and men enrolled at baseline according to the metabolic phenotype at follow-up. The associations between baseline inflammation indicators and MU status at follow-up were evaluated using logistic regression analysis.
Results: 922 (22.08%) developed new-onset MU symptoms during follow-up. Logistic regression analysis found that most inflammation indicators were significantly associated with MU phenotype at follow-up, aside from the LMR and SII. After adjusting for potential confounders, only the correlations between CRP level, neutrophil count, and MU phenotype reached significance. In comparison to the control group with a CRP of < 0.50 mg/L, the odds ratios (ORs) and 95% confidence intervals (CIs) were 1.61 (1.25– 2.09), 1.49 (1.15– 1.94), and 1.68 (1.30– 2.18) for individuals with CRP levels of 0.50– 0.90 mg/L, 0.91– 1.72 mg/L, and above 1.72 mg/L, respectively. In the population with a neutrophil count < 5.00 × 10⁹ cells/L, the neutrophil count correlated positively and significantly with the MU phenotype. In comparison to the control group with a neutrophil count of < 2.75 × 10⁹ cells/L, the ORs and 95% CIs were 1.65 (1.30– 2.09) in the population with neutrophil count > 4.17 × 10⁹ cells/L.
Conclusion: CRP and neutrophil counts positively correlated with the risk of MU phenotype in Chinese subjects. These composite inflammatory markers (NLR, PLR, LMR, and SII) provide limited advantages for predicting MU risks compared to CRP.
Keywords: systemic inflammation indicators, metabolically unhealthy phenotype, C-reactive protein, CRP
Introduction
Obesity is linked to various metabolic issues, including insulin resistance, high blood lipid levels, and metabolic syndrome, all of which are significant factors in the development of type 2 diabetes (T2D) and cardiovascular diseases (CVDs). Nevertheless, there are obese individuals who do not experience the usual negative effects of having too much body fat1 a condition referred to as metabolically healthy obesity (MHO).2 Increasing studies are now being directed to MHO in recent years. The concept of MHO is still evolving, with no agreement on its definition as more than 30 different definitions have been utilized in various studies.2 Most studies have defined MHO as having 2 or fewer metabolic syndrome components.3 Additional criteria less commonly used to define MHO are C-reactive protein level and insulin resistance.4
Nevertheless, the metabolically healthy (MH) phenotype is not stable, and long-term research findings indicate that approximately 16.6% to 50% of individuals with mental health conditions shift to a different phenotype after a decade to two decades of observation.5–7 In general, metabolically unhealthy (MU) participants are at an increased risk of ischemic stroke,1 T2D,8 and colorectal cancer9 than MH participants, and have a better prognosis for mortality and morbidity.10 The transition of metabolic phenotype depends on a multitude of factors such as age,11 liver function,12 glucose regulation, lifestyle13 and gut microbiome.14 Timely recognition of metabolic risk factors is required to ensure optimal primary interventions and decrease healthcare costs.
Recently, there is a lot of attention given to the relationship between inflammation and MH status. Research shows that MHO individuals have a less severe inflammatory profile than those with MUO,15 while MU individuals have higher hs-CRP levels than normal, overweight, and MH individuals.16 However, conflicting results exist, MH overweight/obese subjects still displayed abnormal levels of inflammatory markers.17,18 It is relatively unknown whether inflammation accounts for the metabolic transformation from healthy to unhealthy. This study retrospectively analyzed participants of health checkups, focusing on individuals with an MH phenotype at the beginning. This study aimed to investigate the correlation between eight systemic inflammation markers at the start and development of the MU phenotype after a 2-year follow-up period.
Materials and Methods
Study Participants and Design
The Health Management Center of the Third Xiangya Hospital (Changsha, China) recruited all the participants for this retrospective cohort study. In 2019 and 2021, we registered individuals between the ages of 20 and 80 years, conducted evaluations of metabolic health, and analyzed markers of systemic inflammation. All the participants provided informed consent. We excluded 1917 participants with the MU phenotype at baseline and 355 respondents with missing essential information, leading to a final sample size of 4175 (Figure 1). A flowchart of subject enrollment is given in Figure 1. Approval for the research protocols was granted by the Institutional Review Board of Third Xiangya Hospital (No.2019-S451).
 |
Figure 1 Flow chart of the study. Abbreviations: MH, metabolically healthy; MU, metabolically unhealthy. |
Anthropometric Measurements and Questionnaire Information
Standard procedures were used to measure height, weight, and waist size. The subjects’ blood pressure was determined by taking two measurements from the right upper arm after a 10–15 minutes rest in a seated position between 7 and 9 a.m., with the average reading used as the final result. Self-reported health questionnaires on the website were used to gather information on health behaviors and medical history. Smoking status was classified as never, former, or current. With respect to alcohol consumption, the subjects were classified as never, former, or current drinkers.
Laboratory Test
Blood samples were collected from the median cubital vein after an overnight fast. Low-density lipoprotein cholesterol (LDL-C), total cholesterol (TC), triglyceride (TG), high-density lipoprotein cholesterol (HDL-C), fasting blood glucose (FBG), alanine aminotransferase (ALT), albumin (ALB), serum urea nitrogen (BUN), serum uric acid (SUA), and creatinine (SCr) levels were measured using standard methods and an automatic chemistry analyzer (Hitachi 7600; Hitachi, Tokyo, Japan).
Serum CRP levels during fasting were examined using latex turbidimetric immunoassay on a Hitachi 7600 instrument (Hitachi, Tokyo, Japan). Neutrophils, lymphocytes, monocytes, and platelets were tested by routine blood examination using an automatic blood cell analyzer (BC5390, Mindray, China). Using blood cell counts, we determined the combined values of the inflammatory markers. The neutrophil-to-lymphocyte ratio (NLR), lymphocyte-to-monocyte ratio (LMR), platelet-to-lymphocyte ratio (PLR), and systemic immune-inflammation index (SII) were determined using the following formulas:19 NLR, neutrophil count/lymphocyte count; LMR, lymphocytes count/monocyte count; PLR, platelet count/lymphocyte count; and SII, platelet count×neutrophil count /lymphocyte count.
Assessment of Metabolic Health Status
MH was defined based on the 2009 International Diabetes Federation (IDF)20 and the third report of the National Cholesterol Education Program Adult Treatment Panel III (NCEP-ATP III)21 criteria, as in our prior research,22 which included blood pressure readings of at least 130/85 mmHg or a history of hypertension or current hypertension treatment; FBG levels of at least 5.6 mmol/L or self-reported T2D; low plasma HDL-C levels (<1.0 mmol/L for men and <1.3 mmol/L for women) or use of lipid-lowering medications; and high plasma TG levels (≥1.7 mmol/L) or use of lipid-lowering medications. Those with 0–2 elements were classified as having MH, whereas those with MU were defined as having three or more of the specified abnormal metabolisms.
Statistical Analysis
Continuous variables were presented as mean ±SD, whereas categorical variables were presented as frequencies with percentages and numbers (%, n). For normally distributed continuous variables, means were compared using one-way ANOVA; otherwise, the Kruskal–Wallis nonparametric test was used. The LSD post hoc test was used for multiple comparisons. The chi-squared test was used to analyze categorical variables. Paired t-tests were used to compare inflammatory indicators within each group before and after follow-up. Multilevel analysis using binary logistic regression was performed to investigate the association between inflammatory markers at the beginning and the subsequent metabolic status. Restricted cubic splines were adopted to capture the nonlinear effect of inflammation indicators at baseline on the follow-up MU status. Statistical significance was determined using two-tailed P-values < 0.05. A receiver operating characteristic (ROC) curve was plotted and the area under the curve (AUC) was computed to assess the predictive ability of CRP for detecting the MU phenotype.
Results
Comparisons of Baseline Clinical Characteristics
Among the 4175 subjects with MH at baseline, 922 (22.08%) developed new-onset MU symptoms during follow-up. Of the 2580 men, 696 (26.98%) developed a new-onset MU phenotype. Of the 1595 women participants, 226 (14.17%) developed a new-onset MU phenotype. The mean duration of follow up was 598.15 ± 300.15 days. As indicated in Table 1, we compared the clinical characteristics of women and men enrolled at baseline according to their metabolic phenotype at follow-up.
 |
Table 1 Baseline Characteristics of Subjects According to Metabolic Phenotype Status at Follow-Up |
Participants who later developed MU during the follow-up period for both men and women exhibited higher baseline levels of BMI, WC, SBP, DBP, TG, FBG, SUA, ALB, and ALT than those who did not develop MU. The HDL-C levels were significantly lower in the MU group than in the MH group. In terms of inflammation indicators, most indicators were significantly different among the four groups, except for the LMR. The CRP level, monocyte count, lymphocyte count, neutrophil count, and LMR showed an increasing trend in MU subjects; however, the difference was not statistically significant. Post-hoc LSD pairwise comparisons showed that in male subjects, neutrophil count, NLR, and systemic immune-inflammation index (SII) were significantly higher in the MU group than in the MH group. Significant variations in lymphocyte count and PLR were observed between the two groups of women.
Before and after comparison for Inflammation Indicators
There was a trend of increasing CRP (Figure 2A), lymphocyte count (Figure 2B), and monocyte count (Figure 2C), between baseline and follow-up in those who later developed the MU phenotype; Of these, the increases in monocyte count (Figure 2C) were significant. In those who remained in the MH phenotype, the neutrophil (Figure 2D) and NLR (Figure 2E) declined significantly, and the LMR (Figure 2F) and PLR (Figure 2G) showed a growth trend, and only PLR (Figure 2G) reached significance. In Figure 2H, we did not find any significant change between baseline and follow-up regardless of whether the subjects later developed the MU phenotype.
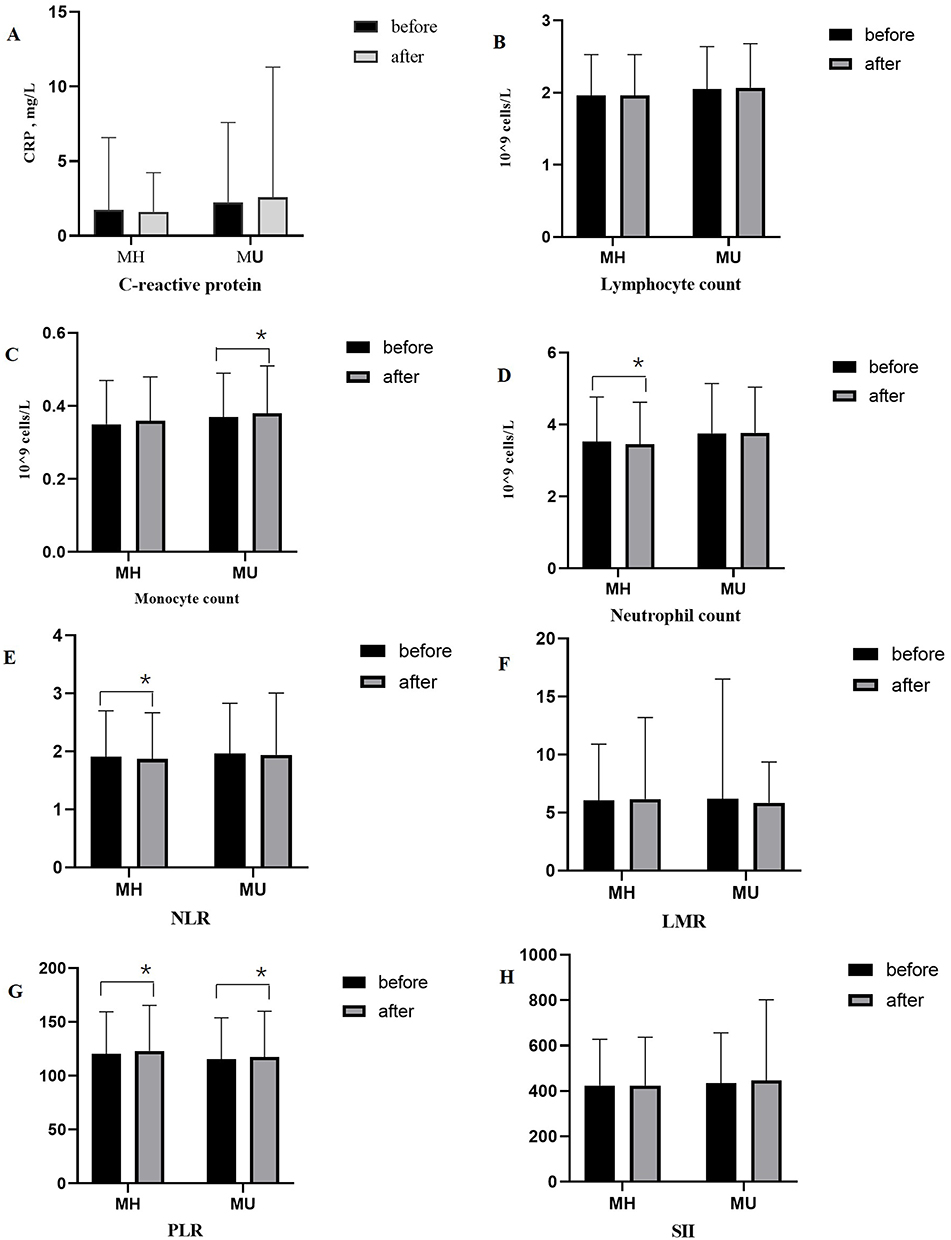 |
Figure 2 Comparison for inflammation indicators in MH and MU group. Abbreviations: MH, metabolically healthy; MU, metabolically unhealthy; NLR, Neutrophil-to-lymphocyte ratio; LMR, Lymphocyte-to-monocyte ratio; PLR, Platelet-to-lymphocyte ratio; SII, Systemic inflammation index. Notes: *p < 0.05.C-reactive protein (A); Lymphocyte count (B); Monocyte count (C); Neutrophil count (D); NLR (E); LMR (F); PLR (G); SII (H). |
The Connections Between Baseline Inflammation Indicators and MU Status at Follow-Up
As shown in Table 2, in addition to the LMR and systemic immune-inflammation index (SII), most inflammation indicators showed a significant association with the MU phenotype at follow-up. After adjusting for potential confounders in Model 3, only the correlations between CRP level, neutrophil count, and MU phenotype were statistically significant. The restricted cubic-spline plot (Figure 3A) demonstrated a significant positive correlation between CRP levels and MU phenotype in individuals with CRP levels <4.00 mg/L. In comparison to the control group with a CRP of <0.50 mg/L, the odds ratios (ORs) and 95% confidence intervals (CIs) were 1.61 (1.25–2.09), 1.49 (1.15–1.94), and 1.68 (1.30–2.18) for individuals with CRP levels of 0.50–0.90 mg/L, 0.91–1.72 mg/L, and above 1.72 mg/L, respectively (see Table 2). Lymphocyte counts were positively correlated with the MU phenotype (Figure 3B), however, this association was not statistically significant after adjustment for confounding factors (P=0.09, Table 2). In the population with a neutrophil count <5.00 ×10⁹ cells/L, the neutrophil count correlated positively and significantly with the MU phenotype (Figure 3C). In comparison to the control group with a neutrophil count of <2.75 × 10⁹ cells/L, the ORs and 95% CIs were 1.65 (1.30–2.09) in the population with neutrophil count >4.17 × 10⁹ cells/L (Table 2). Monocyte counts were positively correlated with the MU phenotype, in the population with a neutrophil count >0.50 ×10⁹ cells/L (Figure 3D), there was a declining trend for the association between monocyte counts and MU phenotype. Negative correlation was observed between NLR, PLR, LMR, and SII, and occurrence of the MU phenotype at follow-up across different cutoff points. Across different cutoff points, negative correlation was observed between NLR (Figure E), PLR (Figure F), LMR (Figure G), and SII (Figure H), and occurrence of the MU phenotype at follow up. A similar association was observed between NLR, SII, and occurrence of the MU phenotype. The OR for developing the MU phenotype tended to decrease with an increase in NLR and SII when their levels were low and high. PLR was negatively correlated with the MU phenotype in the whole sample. LMR was negatively correlated with the MU phenotype at the intermediate levels.
 |
Table 2 The Association Between Various Systemic Inflammatory Indicators and Metabolically Unhealthy Phenotype |
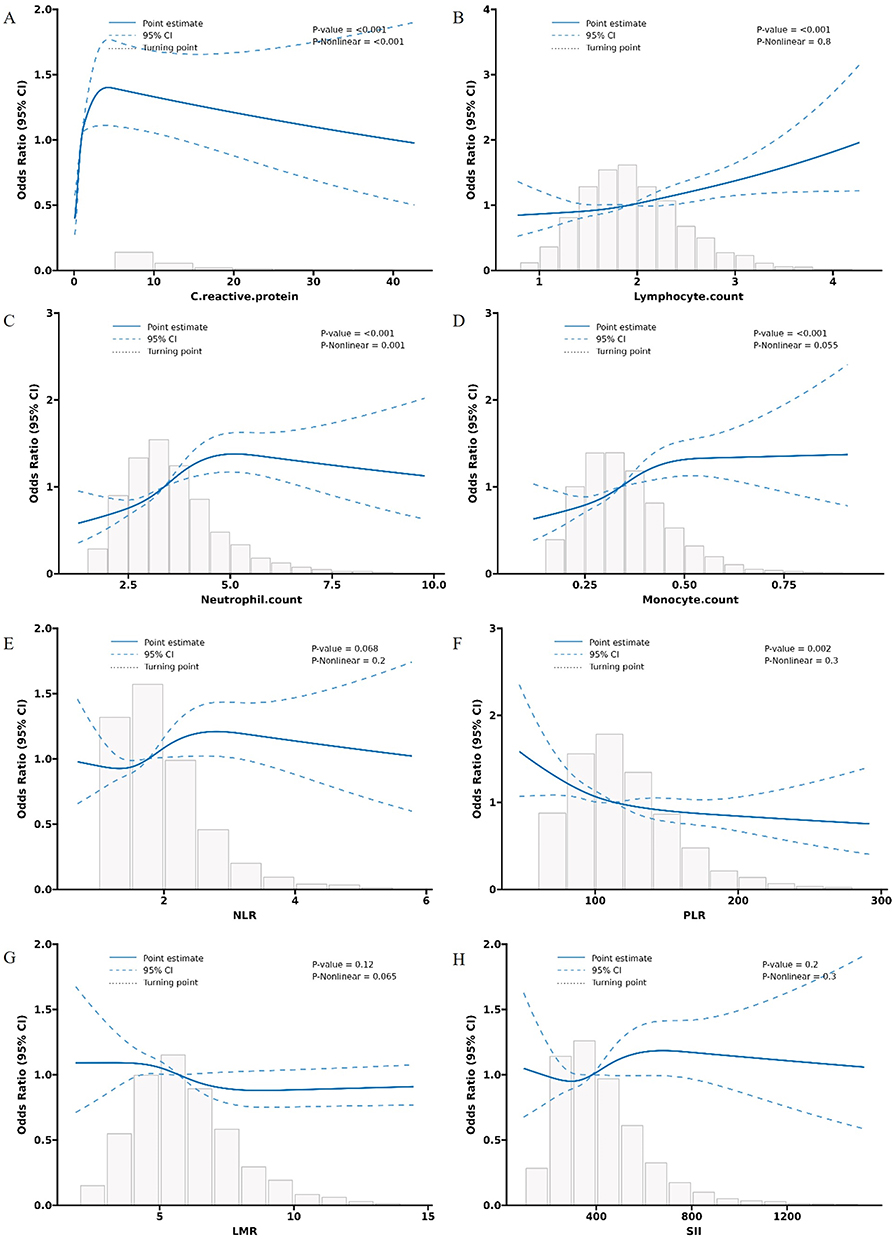 |
Figure 3 Multivariable-adjusted association between systemic inflammatory indicators and metabolically unhealthy phenotype by restricted cubic spline regression. Abbreviations: NLR, Neutrophil-to-lymphocyte ratio; LMR, Lymphocyte-to-monocyte ratio; PLR, Platelet-to-lymphocyte ratio; SII, Systemic inflammation index. Notes: Adjusted for age, sex, smoking, drinking, exercise, and BMI. C-reactive protein (A); Lymphocyte count (B); Neutrophil count (C); Monocyte count (D); NLR (E); PLR (F); LMR (G); SII (H). |
Evaluation of the Diagnostic Efficacy of Inflammatory indicators for Metabolic Unhealthy Phenotype
ROC curve (Figure 4) was used to evaluate the predictive ability of inflammatory indicators for MU phenotype risk. As shown in Figure 4, the higher AUCs of the inflammatory markers were as follows: CRP 0.61 (95% CI: 0.59–0.63), neutrophil count 0.57 (95% CI: 0.55–0.59), monocyte count 0.56 (95% CI: 0.54–0.58), lymphocyte count 0.54 (0.52–0.50) and NLR 0.53 (95% CI: 0.50–0.55), all with a significance level of P<0.01.
 |
Figure 4 ROC curve analysis of predictive value of inflammatory indicators for MU phenotype risk. Abbreviations: NLR, Neutrophil-to-lymphocyte ratio; LMR, Lymphocyte-to-monocyte ratio; PLR, Platelet-to-lymphocyte ratio; SII, Systemic inflammation index. |
Discussion
Our study revealed that individuals who transitioned to the MU phenotype had elevated CRP levels at baseline compared to those who maintained the MH phenotype over a 2-year period. In addition, there was a trend of increasing CRP levels between the baseline and follow-up in those who later developed the MU phenotype. Logistic regression analysis showed that, after adjusting for potential confounders, the correlation between CRP and the MU phenotype remained statistically significant. Overall, these results suggest that elevated CRP levels independently increased the risk of MU, making it the most powerful biomarker among the selected inflammation indicators. Individuals with elevated initial CRP levels are more likely to develop the MU phenotype. Prior research has indicated that individuals with a similar BMI, MU subjects typically exhibit elevated CRP levels.23,24 CRP, a plasma protein mainly produced by the liver and affected by proinflammatory cytokines such as interleukin-6, interleukin-1, and tumor necrosis factor-α,25 can be increased not only in numerous acute infections but also in chronic non-communicable conditions such as CVDs,26 T2D27 and metabolic syndrome.28 CRP has been proposed to identify potential cardiometabolic risks, and elevated CRP levels can lead to insulin resistance, a known risk factor for T2D and CVDs.29 Experimental animal data suggest that inhibition of endothelial nitric oxide synthase (eNOS) and endothelial FcγRIIB activation by CRP blunts insulin transcytosis, causing insulin resistance.30 Furthermore, ample evidence suggests that CRP plays a key role in the development of atherosclerosis31 can predict cardiovascular and cerebrovascular events in patients with both subclinical and clinical atherosclerosis.32 Hence, the protective mechanism of MH obesity is partly due to the reduced CRP levels. Therefore, some studies have included CRP levels ≥3 mg/L as part of MU.33
White blood cell count is another biomarker that has been used to evaluate the inflammatory state of the body. Research has demonstrated that the number of white blood cells can be used to predict a decline in insulin sensitivity10 and is linked to a decrease in insulin secretion.34 Several studies have suggested that the WBC count has an independent relationship with markers of insulin resistance, glucose tolerance, and subclinical inflammation.35,36 Neutrophils, lymphocytes, and monocytes constitute the majority of the leukocytes. Our retrospective cohort analysis revealed that the baseline monocyte, lymphocyte, and neutrophil count levels of subjects who developed the MU phenotype during follow-up were all higher than those observed in subjects who remained in the MH phenotype. Logistic regression analysis revealed a significant correlation between neutrophil count and MU phenotype after adjusting for potential confounders. Neutrophils are immune cells with potent antimicrobial properties. It far outnumbers other immune cells found in the human blood. The relationship between neutrophils and MU phenotype is complex. Risk factors for cardiometabolic disorders, such as hypercholesterolemia and hyperglycemia, can increase neutrophil production by reprogramming hematopoietic stem and progenitor cell (HSPC) function and subsequent myelopoiesis, leading to cardiovascular inflammation. A review by Carlos et al in 202037 revealed that neutrophils can accelerate all stages of atherosclerosis by promoting macrophage activation, monocyte recruitment, and cytotoxicity. Prior research has indicated that the number of neutrophils has a stronger correlation with high-sensitivity C-reactive protein (hsCRP) levels than other types of white blood cells in individuals without diabetes.38 We found that the CRP level and neutrophil count were independent predictors of MU status. The aforementioned studies may account for this observation.
NLR, PLR, LMR, and SII are novel inflammatory markers of systemic inflammation that are calculated from the ratios of neutrophils, monocytes, lymphocytes, and platelets in the peripheral blood and are closely related to the immune response. Prior research has shown connections between these combined inflammatory indicators and the likelihood of metabolic diseases, such as T2D,39 atherosclerosis,40 metabolic syndrome41 and nonalcoholic fatty liver disease.42 Additionally, they demonstrated strong predictive capabilities for CVDs prognosis and related mortality.43 However, few studies have examined the characteristics of these novel inflammatory biomarkers in MU subjects. We found that the baseline NLR and SII levels of male subjects who developed the MU phenotype during follow-up were higher than those of male subjects who remained in the MH phenotype. Logistic regression analysis revealed an association between baseline NLR and PLR and the MU phenotype after 2 years of follow-up, despite not being statistically significant when accounting for potential confounding variables. Therefore, in the present study, these novel inflammatory markers were not better indicators of inflammation than CRP level. In general, the relationship between these inflammatory biomarkers (NLR, PLR, LMR, and SII) and MU phenotype requires further investigation.
It cannot be denied that both metabolic and immune systems are highly correlated with shared cellular machinery and modulators and regulators, including hormones, cytokines, transcription factors, signaling protein mediators, and bioactive lipids. Understanding the initial signals and the subsequent mechanisms of inflammatory markers during the transition from MH to MU is a significant obstacle. In the present study, we found that baseline BMI, WC, BP, TG, FBG, SUA, ALB, and ALT levels had already increased in those who developed the MU phenotype during follow-up. Additional research is required to validate whether inflammatory markers are triggers that cause a transition from MH to MU, or if the shift to MU occurs initially due to different factors and subsequently results in changes in inflammatory markers.
This study had several limitations. First, this study was observational and did not demonstrate a direct link between inflammatory biomarkers and MU phenotype. Furthermore, since this study was conducted at a single center without external validation, and the participants were selected from a group undergoing physical examinations, it is important to be cautious when applying the findings to different populations. Despite our thorough adjustment for various potential confounders, there is still a possibility of bias due to unidentified and unmeasured confounders.
Conclusions
We found that CRP and neutrophil counts positively correlated with the risk of MU phenotype in Chinese subjects. These composite inflammatory markers (NLR, PLR, LMR, and SII) provide limited advantages for predicting MU risks compared to CRP.
Ethics
This study followed ethical guidelines outlined in the Declaration of Helsinki and was approved by the Institutional Review Board at Third Xiangya Hospital (No. 2019-S451). All participants provided written informed consent.
Author Contributions
All authors reviewed and approved the final version of the manuscript. All authors made a significant contribution to the work reported, whether that is in the conception, study design, execution, acquisition of data, analysis and interpretation, or in all these areas; All authors took part in drafting, revising or critically reviewing the article; All authors gave final approval of the version to be published; All authors have agreed on the journal to which the article has been submitted; and agree to be accountable for all aspects of the work.
Funding
This research was funded by the National Natural Science Foundation of China (No. 82174194).
Disclosure
The authors report no conflicts of interests in this work.
References
1. Horn JW, Feng T, Mørkedal B, et al. Obesity and risk for first ischemic stroke depends on metabolic syndrome: the hunt study. Stroke. 2021;52(11):3555–3561. doi:10.1161/STROKEAHA.120.033016
2. Smith GI, Mittendorfer B, Klein S. Metabolically healthy obesity: facts and fantasies. J Clin Invest. 2019;129(10):3978–3989.
3. National Cholesterol Education Program Expert Panel on Detection, E. and A. Treatment of high blood cholesterol in, third report of the national cholesterol education program (NCEP) expert panel on detection, evaluation, and treatment of high blood cholesterol in adults (Adult Treatment Panel III) final report. Circulation. 2002;106(25):3143–3421.
4. Neeland IJ, Poirier P, Despres JP. Cardiovascular and metabolic heterogeneity of obesity: clinical challenges and implications for management. Circulation. 2018;137(13):1391–1406.
5. Hamer M, Bell JA, Sabia S, et al. Stability of metabolically healthy obesity over 8 years: the English Longitudinal Study of Ageing. Eur J Endocrinol. 2015;173(5):703–708.
6. Gao M, Lv J, Yu C, et al. Metabolically healthy obesity, transition to unhealthy metabolic status, and vascular disease in Chinese adults: a cohort study. PLoS Med. 2020;17(10):e1003351.
7. Bell JA, Hamer M, Sabia S, et al. The natural course of healthy obesity over 20 years. J Am Coll Cardiol. 2015;65(1):101–102.
8. Janghorbani M, Soltanian N, Sirous M, et al. Risk of diabetes in combined metabolic abnormalities and body mass index categories. Diabetes Metab Syndr. 2016;10(1 Suppl 1):S71–8.
9. Murphy N, Cross AJ, Abubakar M, et al. A nested case-control study of metabolically defined body size phenotypes and risk of colorectal cancer in the European prospective investigation into cancer and nutrition (EPIC). PLoS Med. 2016;13(4):e1001988.
10. Ortega FB, Lee D.C, Katzmarzyk P Tet al. The intriguing metabolically healthy but obese phenotype: cardiovascular prognosis and role of fitness. Eur Heart J. 2013;34(5):389–397.
11. Zhang Y. Prevalence of metabolically obese but normal weight (MONW) and metabolically healthy but obese (MHO) in Chinese Beijing urban subjects. Europ Heart J. 2017;11(4):418–426.
12. Kouvari M, Chrysohoou C, Skoumas J, et al. The presence of NAFLD influences the transition of metabolically healthy to metabolically unhealthy obesity and the ten-year cardiovascular disease risk. Metabolism. 2022;128:154893.
13. Cheng D, Zhao xYang s, et al. Metabolomic signature between metabolically healthy overweight/obese and metabolically unhealthy overweight/obese: a systematic review. Diabetes Metab Syndr Obes. 2021;14:991–1010.
14. Ke X, Walker A, Haange SB, et al. Synbiotic-driven improvement of metabolic disturbances is associated with changes in the gut microbiome in diet-induced obese mice. Mol Metab. 2019;22:96–109.
15. Doumatey AP, Bentley AR, Zhou J, et al. Paradoxical hyperadiponectinemia is associated with the metabolically healthy obese (MHO) Phenotype in African Americans. J Endocrinol Metab. 2012;2(2):51–65.
16. Perez-Martinez P, Alcala‐Diaz JF, Delgado‐Lista J, et al. Metabolic phenotypes of obesity influence triglyceride and inflammation homoeostasis. Eur J Clin Invest. 2014;44(11):1053–1064.
17. Gonzalez-Gil EM, Cadenas-Sanchez C, Santabarbara J, et al. Inflammation in metabolically healthy and metabolically abnormal adolescents: the HELENA study. Nutr Metab Cardiovasc Dis. 2018;28(1):77–83.
18. Wildman RP, Kaplan R, Manson JE, et al. Body size phenotypes and inflammation in the women’s health initiative observational study. Obesity. 2011;19(7):1482–1491.
19. Lue KH, Huang CH, Hsieh TC, et al. Systemic inflammation index and tumor glycolytic heterogeneity help risk stratify patients with advanced epidermal growth factor receptor-mutated lung adenocarcinoma treated with tyrosine kinase inhibitor therapy. Cancers. 2022;14(2):309.
20. Alberti KG, Eckel RH, Grundy SM, et al. Harmonizing the metabolic syndrome: a joint interim statement of the international diabetes federation task force on epidemiology and prevention. National Heart Lung Blood Instit. 2009;120(16):1640–1645.
21. Expert Panel on Detection, E. and A. Treatment of high blood cholesterol in, executive summary of the third report of the national cholesterol education program (NCEP) expert panel on detection, evaluation, and treatment of high blood cholesterol in adults (adult treatment panel III). JAMA. 2001;285(19):2486–2497.
22. Wang J, Yang S, Zhao L. Association of high-sensitivity C-reactive protein and lipoprotein-associated phospholipase A2 with metabolically unhealthy phenotype: a cross sectional Study. J Inflamm Res. 2024;17:81–90.
23. Phillips CM, Perry IJ. Does inflammation determine metabolic health status in obese and nonobese adults? J Clin Endocrinol Metab. 2013;98(10):E1610–9.
24. Ferreira FG, Reitz LK, Valmorbida A, et al. Metabolically unhealthy and overweight phenotypes are associated with increased levels of inflammatory cytokines: a population-based study. Nutrition. 2022;96:111590.
25. Morris-Stiff G, Gomez D, Prasad KR. C-reactive protein in liver cancer surgery. Eur J Surg Oncol. 2008;34(7):727–729.
26. Summaries for patients. C-reactive protein and prediction of risk for cardiovascular disease in women. Ann Intern Med. 2006;145(1):I19.
27. Dehghan A, Van Hoek M, Sijbrands EJ, et al. Risk of type 2 diabetes attributable to C-reactive protein and other risk factors. Diabetes Care. 2007;30(10):2695–2699.
28. Naja F, Shivappa N, Nasreddine L, et al. Role of inflammation in the association between the western dietary pattern and metabolic syndrome among Lebanese adults. Int J Food Sci Nutr. 2017;68(8):997–1004.
29. Young LH, Viscoli CM, Schwartz GG, et al. Heart failure after ischemic stroke or transient ischemic attack in insulin-resistant patients without diabetes mellitus treated with pioglitazone. Circulation. 2018;138(12):1210–1220.
30. Tanigaki K, Chambliss KL, Yuhanna IS, et al. Endothelial fcgamma receptor IIB activation blunts insulin delivery to skeletal muscle to cause insulin resistance in mice. Diabetes. 2016;65(7):1996–2005.
31. Pathak A, Singh SK, Thewke DP, et al. Conformationally altered C-reactive protein capable of binding to atherogenic lipoproteins reduces atherosclerosis. Front Immunol. 2020;11:1780.
32. Li HY, Liu XL, Liu YT, et al. Matrix sieving-enforced retrograde transcytosis regulates tissue accumulation of C-reactive protein. Cardiovasc Res. 2019;115(2):440–452.
33. Hamer M, Stamatakis E. Metabolically healthy obesity and risk of all-cause and cardiovascular disease mortality. J Clin Endocrinol Metab. 2012;97(7):2482–2488.
34. Hanley AJ, Retnakaran R, Qi Y, et al. Association of hematological parameters with insulin resistance and beta-cell dysfunction in nondiabetic subjects. J Clin Endocrinol Metab. 2009;94(10):3824–3832.
35. Targher G, Seidell J, Tonoli M, et al. The white blood cell count: its relationship to plasma insulin and other cardiovascular risk factors in healthy male individuals. J Intern Med. 1996;239(5):435–441.
36. Gilbert-Ouimet M, Trudel X, Brisson C, et al. Adverse effects of psychosocial work factors on blood pressure: systematic review of studies on demand-control-support and effort-reward imbalance models. Scand J Work Environ Health. 2014;40(2):109–132.
37. Silvestre-Roig C, Braster Q, Ortega-Gomez A, et al. Neutrophils as regulators of cardiovascular inflammation. Nat Rev Cardiol. 2020;17(6):327–340.
38. Kaur H, Adams-Huet B, Smith G, et al. Increased neutrophil count in nascent metabolic syndrome. Metab Syndr Relat Disord. 2013;11(2):128–131.
39. Yilmaz H, Ucan B, Sayki M, et al. Usefulness of the neutrophil-to-lymphocyte ratio to prediction of type 2 diabetes mellitus in morbid obesity. Diabetes Metab Syndr. 2015;9(4):299–304.
40. Chen Q, Che M, Shen W, et al. Comparison of the early warning effects of novel inflammatory markers SIRI, NLR, and LMR in the inhibition of carotid atherosclerosis by testosterone in middle-aged and elderly han Chinese men in the real world: a small sample clinical observational study. Am J Mens Health. 2023;17(3):15579883231171462.
41. Marra A. The neutrophil to lymphocyte ratio (NLR) positively correlates with the presence and severity of metabolic syndrome in obese adults, but not in obese children/adolescents. BMC Endocr Disord. 2023;23(1):121.
42. Liu K, Tang S, Liu C, et al. Systemic immune-inflammatory biomarkers (SII, NLR, PLR and LMR) linked to non-alcoholic fatty liver disease risk. Front Immunol. 2024;15:1337241.
43. Abete I, Lu Y, Lassale C, et al. White cell counts in relation to mortality in a general population of cohort study in the Netherlands: a mediating effect or not? BMJ Open. 2019;9(10):e030949.
 © 2024 The Author(s). This work is published and licensed by Dove Medical Press Limited. The
full terms of this license are available at https://www.dovepress.com/terms.php
and incorporate the Creative Commons Attribution
- Non Commercial (unported, 3.0) License.
By accessing the work you hereby accept the Terms. Non-commercial uses of the work are permitted
without any further permission from Dove Medical Press Limited, provided the work is properly
attributed. For permission for commercial use of this work, please see paragraphs 4.2 and 5 of our Terms.
© 2024 The Author(s). This work is published and licensed by Dove Medical Press Limited. The
full terms of this license are available at https://www.dovepress.com/terms.php
and incorporate the Creative Commons Attribution
- Non Commercial (unported, 3.0) License.
By accessing the work you hereby accept the Terms. Non-commercial uses of the work are permitted
without any further permission from Dove Medical Press Limited, provided the work is properly
attributed. For permission for commercial use of this work, please see paragraphs 4.2 and 5 of our Terms.