")
Back to Journals » ImmunoTargets and Therapy » Volume 14
TGF-β Decreases NK Cell Mobility and Cytotoxic Efficacy in Complex in vitro Models of the Leukemia Microenvironment
Authors Švubová V , Janstová L, Jedlička M, Mašínová E, Szabová J, Feglarová T, Kuglerová K, Bosáková V, Brodská B , Boráková K, Kundrát D , Trsová I, Böhmová M, Kuželová K , Hrdý J , Gašová Z, Vydra J, Dostálová Merkerová M, Hortová-Kohoutková M, Frič J
Received 19 December 2024
Accepted for publication 3 June 2025
Published 18 June 2025 Volume 2025:14 Pages 589—604
DOI https://doi.org/10.2147/ITT.S512700
Checked for plagiarism Yes
Review by Single anonymous peer review
Peer reviewer comments 2
Editor who approved publication: Dr Sarah Wheeler
Veronika Švubová,1,2 Lucie Janstová,1 Marek Jedlička,1,2 Eva Mašínová,1,2 Jana Szabová,1 Tereza Feglarová,1 Kateřina Kuglerová,1 Veronika Bosáková,3,4 Barbora Brodská,1 Kristýna Boráková,5 David Kundrát,1 Iva Trsová,1,6 Martina Böhmová,1 Kateřina Kuželová,1 Jiří Hrdý,7,8 Zdenka Gašová,1 Jan Vydra,1 Michaela Dostálová Merkerová,1 Marcela Hortová-Kohoutková,3,9 Jan Frič1,3,9
1Institute of Hematology and Blood Transfusion (IHBT), Prague, Czechia; 2Department. of Cell Biology, Faculty of Science – Charles University, Prague, Czechia; 3Department. of Cellular and Molecular Immunoregulation, International Clinical Research Center – St. Anne’s University Hospital in Brno (FNUSA-ICRC), Brno, Czechia; 4Department. of Biology, Faculty of Medicine – Masaryk University, Brno, Czechia; 5Pediatric-neonatal department, Institute for the Care of Mother and Child, Prague, Czechia; 6Department. of Genetics and Microbiology, Faculty of Science – Charles University, Prague, Czechia; 7Institute of Clinical Immunology and Allergology, First Faculty of Medicine, Charles University, Prague, Czechia; 8Institute of Clinical Immunology and Allergology, General University Hospital, Prague, Czechia; 9International Clinical Research Center, Faculty of Medicine, Masaryk University, Brno, Czechia
Correspondence: Jan Frič, Department of Modern Immunotherapy, Institute of Hematology and Blood Transfusion, U Nemocnice 1, Prague, 128 00, Czechia, Email [email protected] Marcela Hortová-Kohoutková, International Clinical Research Center of St. Anne’s University Hospital in Brno (FNUSA-ICRC), Pekařská 53, Brno, 656 91, Czechia, Email [email protected]
Background: Natural killer (NK) cell-based therapies represent a promising approach for acute myeloid leukemia (AML) relapse, yet their efficacy is hindered by immunosuppressive factors such as transforming growth factor beta (TGF-β) in the tumor microenvironment. This study investigated the effects of TGF-β on NK cell cytotoxicity and migration using 2D and 3D co-culture models that mimic the leukemic microenvironment.
Methods: TGF-β production was evaluated in AML-derived leukemic cell lines and mesenchymal stromal cells (hTERT-MSCs) using ELISA. Bulk RNA sequencing (RNA-seq) was performed to analyze global gene expression changes in TGF-β-treated primary human NK cells. NK cell cytotoxicity and migration were assessed in 2D monolayer and 3D spheroid co-cultures containing hTERT-MSCs and leukemic cells using flow cytometry and confocal microscopy.
Results: Both leukemic cells and MSCs produced TGF-β, with increased levels observed in MSCs after co-culture with primary AML blasts. RNA sequencing revealed that TGF-β altered key gene pathways associated with NK cell cytotoxicity, adhesion, and migration, supporting its immunosuppressive role. In functional assays, TGF-β exposure significantly reduced NK cell-mediated cytotoxicity in a time-dependent manner and impaired NK cell infiltration into 3D spheroids, particularly in models incorporating MSCs. Additionally, MSCs themselves provided a protective environment for leukemic cells, further reducing NK cell effectiveness in 2D co-cultures.
Conclusion: TGF-β suppresses both NK cell cytotoxicity and migration, limiting their ability to eliminate leukemic cells and infiltrate the bone marrow niche (BMN). These findings provide novel insights into TGF-β–mediated immune evasion mechanisms and provide important insights for the future design of NK-based immunotherapies and clinical trials.
Keywords: 3D models, TGFbeta, acute myeloid leukemia, bone marrow niche, NK cells, immunotherapy
Introduction
NK cell-based immunotherapy is being actively developed and researched as a strategy for treating AML, due to the immunosurveillance functions and antigen-independent cytotoxicity of NK cells.1 Disease relapse frequently occurs due to the persistence of treatment-resistant AML cells in the BMN.2 Numerous clinical studies have investigated NK cell-based immunotherapy; however, its success remains limited by insufficient NK cell persistence post-transfer and inconsistent efficacy across patients.3–5 Current research predominantly focuses on optimizing ex vivo expansion protocols to generate sufficient NK cells for adoptive transfer, rather than addressing the factors limiting therapeutic efficacy.
The BMN plays a central role in AML pathophysiology, potentially shielding leukemic cells from immune-mediated elimination. This protective effect is likely mediated by niche-specific cytokines, growth factors, nutrient availability, and the spatial organization of the leukemic microenvironment.2,6,7 In general, malignancies such as AML dysregulate cytokine signaling, impairing immune surveillance and the function of immune effector cells, including NK cells.8,9 Therefore, understanding the cytokine network in leukemia patients is critical for advancing immunotherapeutic strategies.
TGF-β is best known for its immunosuppressive properties, attenuating immune responses following initial inflammation.10 It has gained recent attention as a key mediator of NK cell dysfunction in B-cell acute lymphoblastic leukemia (B-ALL) and relapsed AML.9,11,12 Blocking TGF-β signaling has been shown to enhance NK cell activity against AML and colon cancer cells and improve AML cell elimination when combined with cytarabine chemotherapy.13,14 Tumor-associated mesenchymal stromal cells (MSCs), potent producers of TGF-β,15 may contribute to AML immune evasion by secreting TGF-β within the BMN. Additionally, as seen in B-ALL, TGF-β can drive MSCs to differentiate into cancer-associated fibroblasts (CAFs), which further amplify TGF-β production.16 Given the previously described protective role of CAFs in AML, TGF-β may contribute to a self-perpetuating immunosuppressive loop that hinders NK cell-mediated tumor clearance while leaving leukemic cells unaffected.12,17,18
Standardized cytotoxicity and degranulation assays, essential for evaluating NK cell-based therapies for regulatory approval and product quality control, provide limited insight into processes involved in in vivo immune surveillance of leukemia by NK cells.19 Most rely on the K562 cell line, which is highly susceptible to NK cell killing due to its lack of MHC I molecules;20 however, such suspension-based assays fail to replicate key in vivo conditions, including cell-cell interactions, metabolic gradients, hypoxia, and the cytokine profile of the BMN.21,22 Furthermore, many clinical trials omit cytotoxicity assays for NK cell potency testing (Supplement Table ST1). To improve translational outcomes, more advanced models are needed that better mimic the BMN’s structural and biochemical complexity.23
A major gap in current potency testing models is the absence of MSCs, despite their critical adhesion role in AML cell survival within the BMN.18,20,21,24 MSCs support leukemic cells through mechanisms such as adhesion-mediated signaling and tunneling nanotubes, which transfer organelles, proteins, and signaling molecules essential for leukemic cell survival.25,26 Additionally, MSC co-culture has been shown to protect leukemic cells from cytotoxic drugs.27,28 As such, MSCs are likely central to the establishment of the leukemic BMN, yet their inclusion in co-culture models remains challenging.29
In this study, we developed 2D and 3D models of the leukemic microenvironment to optimize key parameters, including MSC incorporation and the use of multiple leukemic cell lines (K562, MOLM-13, THP-1, and U937), thereby creating a more stringent testing platform for NK cell-based therapies. These multi-cell-type models provide essential features that are difficult to replicate in simpler in vitro assays, such as metabolic gradients, hypoxic conditions, cell-to-cell interactions, and survival signaling pathways of the BMN.22 Such factors can significantly influence NK cell metabolic flexibility, migratory capacity, and cytotoxic activity.
Materials and Methods
Cell Line Cultivation
K562 cells (blast phase-derived chronic myeloid leukemia) were routinely cultured in IMDM (Gibco; Waltham, MA, USA) supplemented with 10% fetal bovine serum (FBS) (Biosera; Cholet, France), 1% GlutaMAX (Gibco), and 1% penicillin-streptomycin (P/S; Gibco). MOLM-13 and THP-1 (both AML cell lines) and U937 (histiocytic lymphoma; pro-monocytic model) were cultured in RPMI-1640 (Gibco) supplemented with 10% FBS, 1% GlutaMAX, and 1% P/S. hTERT MSCs were cultured in αMEM medium (Gibco) supplemented with 10% FBS and 1% P/S. hTERT MSCs were passaged using TrypLE Express (Gibco). All cell lines were acquired from ATCC.
Isolation of Primary Human NK Cells
Peripheral blood mononuclear cells were isolated from peripheral blood of healthy donors via density gradient centrifugation (Lymphoprep, STEMCELL Technologies; Vancouver, Canada), followed by isolation of untouched NK cells using an autoMACS Pro Separator (Miltenyi Biotec; Bergisch Gladbach, Germany). The efficacy of NK cell enrichment was assessed by flow cytometry using a phenotype control panel (anti-CD56-APC Fire 750, anti-CD16-BV650, anti-CD3-Spark Blue 550, anti-CD14-Alexa Fluor 594, anti-CD45-Alexa Fluor 647; all BioLegend; San Diego, CA, USA, and anti-CD19-Pacific Blue (Exbio; Prague, Czech Republic) and the LIVE/DEAD Fixable Blue Dead Cell Stain Kit (1:100 dilution; Invitrogen; Waltham, MA, USA). NK cells with a purity exceeding 90% were used for experiments. Cell measurement was performed using a Cytek Aurora spectral cytometer, and data analysis was conducted with FlowJo 10.8.0 (BD; Franklin Lakes, NJ, USA).
NK Cell Expansion
NK cells were expanded using irradiated K562 cells (100 Gy, 15 min) at a 1:5 ratio in X–VIVO20 medium with gentamicin and phenol red (Lonza; Basel, Switzerland), supplemented with 5% human serum (Capricorn; Ebsdorfergrund, Germany), for 14 days at 37 °C and 5% CO2. NK cells were seeded at 0.2×10⁶ cells/mL with irradiated K562 cells (1×10⁶ cells/mL) in expansion medium containing interleukin 2 (IL-2; 1,000 UI/mL) and IL-15 (20 ng/mL) (both R&D Systems; Minneapolis, MN, USA). After day 5, fresh medium was added every second day to maintain expansion. Recombinant human TGF-β1 (TGF-β, R&D Systems) was administered at different time points, with untreated NK cells cultivated in parallel. TGF-β (10 ng/mL) was added at each passage, beginning 14 days (TGF-β14d), 7 days (TGF-β7d), 3 days (TGF-β3d), 1 day/24 hours (TGF-β1d), 18 hours (TGF-β18h) or 1 hour (TGF-β1h) before the end of expansion and subsequent experiments. On day 14, the final cell concentration was determined, and cells were harvested for cytotoxicity assays, microscopy, cryopreservation, and flow cytometry analysis (anti-CD16-BV650 [Biolegend], anti-CD337-PE-Cy7 [Biolegend], anti-CD158b2-BUV661 [BD], anti-197-BV750 [BD], anti-GZMb-PE CF594 [BD], anti-IFNg-BV510 [BD]).
Patient Samples
Primary AML leukapheresis samples were cultured overnight in αMEM medium, with or without MSCs. Intracellular TGF-β was detected, MSCs and blast cells were distinguished via flow cytometry the following day, based on LIVE/DEAD fixable blue dead cell stain kit (Invitrogen), anti-CD45-Alexa Fluor 647 (Invitrogen), anti-CD105-PE-Cy7 (BioLegend), anti-TGF-β-PerCP-Cy5.5 (BD), anti-CD3-Spark Blue 550, (Biolegend), anti-CD19-Brilliant Violet 570 (Biolegend), anti-CD14-Alexa Fluor 594 (Biolegend) and anti-CD123-Super Bright 436 (Invitrogen).
Bone Marrow Niche Monolayer Establishment
Before co-culture, hTERT MSCs were incubated with 1 mL TrypLE Express per T75 flask for 5–10 min at 37 °C and 5% CO₂. Detached MSCs were stained with CellTrace Yellow (Invitrogen) according to the manufacturer’s instructions. Briefly, cells were stained at 2×10⁶ cells/mL with 0.5 µM staining solution for 20 min at 37 °C and 5% CO2. After incubation, five times the volume of complete αMEM medium was added, followed by a 5-min rest in the dark and centrifugation at 300 × g for 5 min. MSCs were then seeded in a 24-well plate at 0.1×10⁶ cells/well and incubated for 1–2 h to form a monolayer. Leukemic target cells were stained with CellTrace CFSE (Invitrogen) and added to the MSC monolayer at 0.1×10⁶ cells/well in a 1:1 ratio. The plate was incubated overnight at 37 °C and 5% CO2.
Spheroid Establishment
Dual spheroids (composed of MSCs and one of four leukemic cell lines: K562, MOLM-13, THP-1, or U937) were formed. CellTrace dyes (Invitrogen) were used to assess leukemic cell incorporation (CellTrace CFSE for MSCs; CellTrace FarRed for leukemic cells) and NK cell infiltration (CellTrace CFSE for leukemic cells; CellTrace FarRed for NK cells). First, an AggreWell 400 plate (STEMCELL Technologies; Vancouver, Canada) was washed with 300 µL anti-adherence rinsing solution (STEMCELL Technologies). MSCs were treated with TrypLE Express (Gibco) and seeded at 1×10⁶ cells/well on a 24-well AggreWell 400 plate. After overnight culture to form the 3D scaffold, leukemic cells (1×10⁶ cells/well) were added and co-cultivated in 1 mL complete αMEM medium overnight at 37 °C and 5% CO2. Spheroids were then analysed for leukemic cell incorporation or incubated with NK cells to assess infiltration.
Flow Cytometry Cytotoxicity Assessment
The BMN monolayer was prepared the day before the cytotoxicity assay. On day 14 of in vitro NK cell expansion, cells were harvested and stained with CellTrace FarRed (Invitrogen). NK cells were adjusted to 1×10⁶ cells/mL, and 300 µL of the cell suspension was added per well at a final effector: target (:MSC) ratio of 3:1(:1). The plate was incubated for 4 h at 37 °C and 5% CO2. Flow cytometry was performed to distinguish cell subsets and evaluate cytotoxicity. The final cytotoxicity was assessed by flow cytometry using a phenotype control panel for NK cells (CellTrace FarRed [Invitrogen], anti-CD45-Alexa Fluor 647 [Invitrogen], anti-CD56-APC Fire 750 [BioLegend], anti-CD16-BV650 [BioLegend]), MSCs (CellTrace Yellow [Invitrogen], anti-CD73-BV605 [BioLegend], anti-CD105-PE-Cy7 [BioLegend]), and leukemic cells (K562, THP-1, MOLM-13, and U937) stained with CellTrace CFSE (Invitrogen). A LIVE/DEAD Fixable Blue Dead Cell Stain Kit (Invitrogen) was used to determine cell viability (gating strategy shown in Supplement Figure SF1). A Cytek Aurora spectral cytometer was used for acquisition, and FlowJo 10.8.0 (BD) was used for data analysis.
Spheroid Infiltration Assay
NK cells were incubated with dual spheroids at a final effector : target cell ratio of 1:1 on a 16-well Ibidi (Gräfelfing, Germany) µ-slide in complete X–VIVO20 medium. In addition to CellTrace dyes (Invitrogen) used to distinguish individual cell types, NucBlue Live ReadyProbes reagent Hoechst 33342 (Invitrogen) was used to visualize nuclei. Imaging of NK cells within spheroids after overnight incubation was performed using an Olympus (Tokyo, Japan) FV1000 confocal laser scanning microscope with a UPLFLN 20 × NA 0.50 objective. A z-stack of confocal sections was acquired with a step size of 1.6/10 µm. Images were analyzed using Olympus FLUOVIEW 4.2 and ImageJ with FiJi30 using the 3D objects counter plugin. Leukemic cell incorporation and NK cell infiltration were evaluated based on maximum intensity projection of all acquired slices.
Library Preparation and RNA Sequencing
Total RNA samples were isolated from primary human NK cells via magnetic separation (Quick-RNA MagBead Kit, Zymo Research; R2132; Irvine, USA) and ribodepleted using the RiboCop V1.3 rRNA depletion kit (TATAA Biocenter; 144.24; Lexogen, Vienna, Austria). Purified RNA (100 ng per sample) was further processed for sequencing using the Ultra II Directional RNA Library Kit (E7760S; BioTechne, Minneapolis, MN, USA). Library quality and size were assessed using an Agilent 4200 TapeStation and quantified with a Qubit 3 Fluorometer. Libraries were pooled and 2×100 bp paired-end sequencing was performed on a NovaSeq 6000 instrument (Illumina; San Diego, CA, USA), as previously described.31 Raw reads in FASTQ format were trimmed and filtered using Trimmomatic 0.39, and quality was assessed using FastQC 0.11.8. Filtered reads were mapped to the human genome (GRCh38.p13) using STAR 2.7.2b. Post-mapping quality was verified using RNA-SeQC 2.3.5, and gene expression quantification was performed with StringTie2 1.3.6. Statistical analysis and visualization of expression data were conducted using several R software 4.0.232 packages (eg, edgeR 3.30.3, ggplot 3.3.2, pcaMethods 1.84.0, M3C 1.14.0). Data from differential expression analysis (DEA) were used in the Gene Ontology database for functional enrichment analysis. Qualitative and quantitative parameters of RNA sequencing and mapping are shown in Supplement Table ST2 for individual samples.
ELISA
TGF-β in the supernatants of K562, MOLM-13, THP-1, U937, hTERT-MSCs, and complete media was detected using an hTGF-beta 1 DuoSet ELISA Kit (DY240; BioTechne) according to the manufacturer´s instructions, using a Spark Multimode Microplate Reader (Tecan; Männedorf, Switzerland). Samples were stored at –20 °C until processing without dilution. Background signal from the media (<30 pg/mL) was subtracted from supernatant values.
Quantitative PCR (qPCR)
RNA was isolated from 5×10⁶ cells (K562, MOLM-13, THP-1, U937, and MSCs) using the RNeasy Plus Mini Kit (50) (74104; BioTech) following the manufacturer’s instructions. RNA was eluted with 20 µL of RNase-free water (Invitrogen; 10977015) and quantified using a NanoDrop One spectrophotometer (ThermoFisher; Waltham, MA, USA). Reverse transcription was performed using Oligo d(T) (Fisher Scientific; Waltham, USA; 18418020), dNTP mix (Fisher Scientific; 10297018), and RNase-free water. Samples were heated to 65 °C for 5 min on a thermal cycler (Biometra; Göttingen, Germany) and then placed on a frozen cooler rack. In the second step, 5× SSIV Buffer, DTT, RNaseOUT recombinant RNase inhibitor (10777019), and SuperScript IV reverse transcriptase (200 U/µL, 18090200) (all ThermoFisher) were used. The mix was incubated at 55 °C for 10 min, then heated to 80 °C for 10 min. Samples were stored at –20 °C or used for qPCR immediately.
Quantitative PCR was performed using PowerUp SYBR Green Master Mix (2×) (A25918; ThermoFisher Scientific) and primers (KRD) (GAPDH: forward 5´-CTC CTC CTG TTC GAC AGT CA-, reverse 5´-CCC AAT ACG ACC AAA TCC GTT G-; TGF-β: forward 5´CAC AGA GTG GGA ACA AAA AGG T-, reverse 5´CCA ATG GAA CAT CGT CGA GCA-) on a LightCycler 480 system (Roche; Basel, Switzerland). Conditions were as follows: incubation at 95 °C for 5 min, followed by 40 cycles of 95–60–72 °C for 10s each, with a final cooling to 40 °C. Data were processed using the delta-delta CT method, where fold change in expression was calculated using the 2–∆∆Ct formula: ∆∆Ct = [∆Ct (sample) – ∆Ct (control)], in which ∆Ct = [Ct (gene of interest) – Ct (GAPDH)].
Calcein AM Release Cytotoxicity Assay
K562 target cells were stained with Calcein AM cell-permanent dye (C3100MP; Invitrogen) following the manufacturer’s instructions. Meanwhile, effector NK cells were serially diluted in 96-well round-bottom plates in triplicate to a final count of 4.5 × 10⁵, 1.5 × 10⁵, 5 × 10⁴, and 1.6 × 10⁴ cells per well. Target cells were added at 5 × 10⁵ cells per well and incubated for 3 h at 37 °C. Complete medium was used as a blank, target cells without effectors served as a control for spontaneous cell death, and heat-killed (70 °C for 10 min) target cells were used for the maximal threshold value. Fluorescence in supernatants was measured using a Spark Multimode Microplate Reader (Tecan; Männedorf, Switzerland) at an excitation of 488 nm and emission of 520 nm.
Statistics
All statistical analyses were performed using GraphPad Prism version 9.3.1. The normality of data was tested using the Shapiro–Wilk test, followed by analysis with a paired t-test, one-sample t-test, Wilcoxon test, or ANOVA, as appropriate. Statistical significance levels are reported as follows: (ns p > 0.05; * p < 0.05; ** p < 0.01; *** p < 0.001; **** p < 0.0001); data are displayed as the mean ± SD.
Results
TGF-β Reprograms Gene Expression to Impair NK Cytotoxicity and Migration
TGF-β is known to impair NK cell function in various malignancies,12 and elevated levels of active TGF-β have been detected in the bone marrow of AML patients with early relapse.9 To assess its expression in the leukemic microenvironment, we measured TGFB1 RNA and protein levels in leukemic cell lines and hTERT MSCs (Figure 1A and B). K562 cells exhibited the highest TGF-β production, followed by MOLM-13 and MSCs, while THP-1 and U937 showed lower expression. As MSCs (and MSC-derived CAFs) are a common source of TGF-β,15 intracellular TGF-β levels were assessed in MSCs cultivated with and without primary AML cells (distinguished as shown in Figure 1C). Frequencies of blast cells in patient samples are shown in Figure 1D. MSCs co-cultured overnight with blasts displayed significantly increased intracellular TGF-β levels, as measured by flow cytometry (Figure 1E, supplement Figure SF2). The blast cells were not positive for intracellular TGF-β regardless of MSCs.
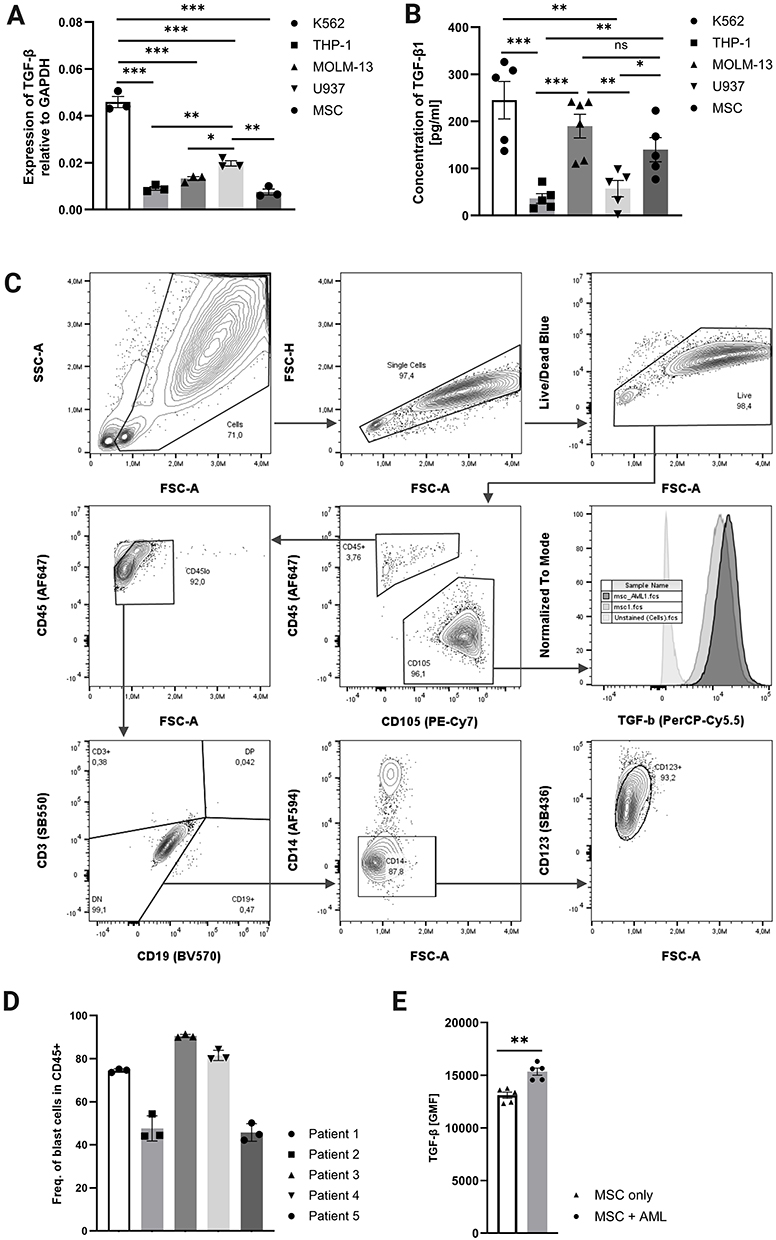 |
Figure 1 TGF-β is produced by leukemic cell lines and MSCs cultivated with primary AML samples.(A) TGFB1 RNA expression in leukemic cell lines (K562, THP-1, MOLM-13, U937) and mesenchymal stromal cells (MSCs), measured via qPCR and normalized to GAPDH (n = 3; paired t-test; *p ≤ 0.05; **p ≤ 0.01; ***p ≤ 0.001; mean ± SD). (B) TGF-β1 concentration in culture supernatants of the same cell lines, detected by ELISA (n = 5; paired t-test; *p ≤ 0.05; **p ≤ 0.01; ***p ≤ 0.001; mean ± SD). (C) Gating strategy for blast cell and MSC in co-culture. MSCs gated as CD105+ subset of Cells/Single cells/Live cells; blast cells defined as CD105-/CD45lo/CD3-/CD19-/CD14-/CD123+. (D) Frequencies of blasts in CD45+ population (n = 5). (E) Intracellular TGF-β levels in MSCs alone versus MSCs co-cultured with primary AML blasts, assessed by flow cytometry (n = 5). |
To investigate the impact of TGF-β on NK cell-based immunotherapy, we performed RNA-seq on in vitro–expanded NK cells from healthy donors treated with TGF-β for 14 days (TGF-β14d), 7 days (TGF-β7d), and 1 day (TGF-β1d) compared to untreated controls (Ctrl; Figure 2A). TGF-β concentrations were selected based on prior studies.14,33,34 RNA-seq analysis revealed substantial shifts in gene expression across all TGF-β–treated NK cell groups (Figure 2B). Differential expression analysis identified 658, 799, and 975 differentially expressed genes (DEGs) in the TGF-β14d, TGF-β7d and TGF-β1d groups respectively, relative to untreated NK cells.
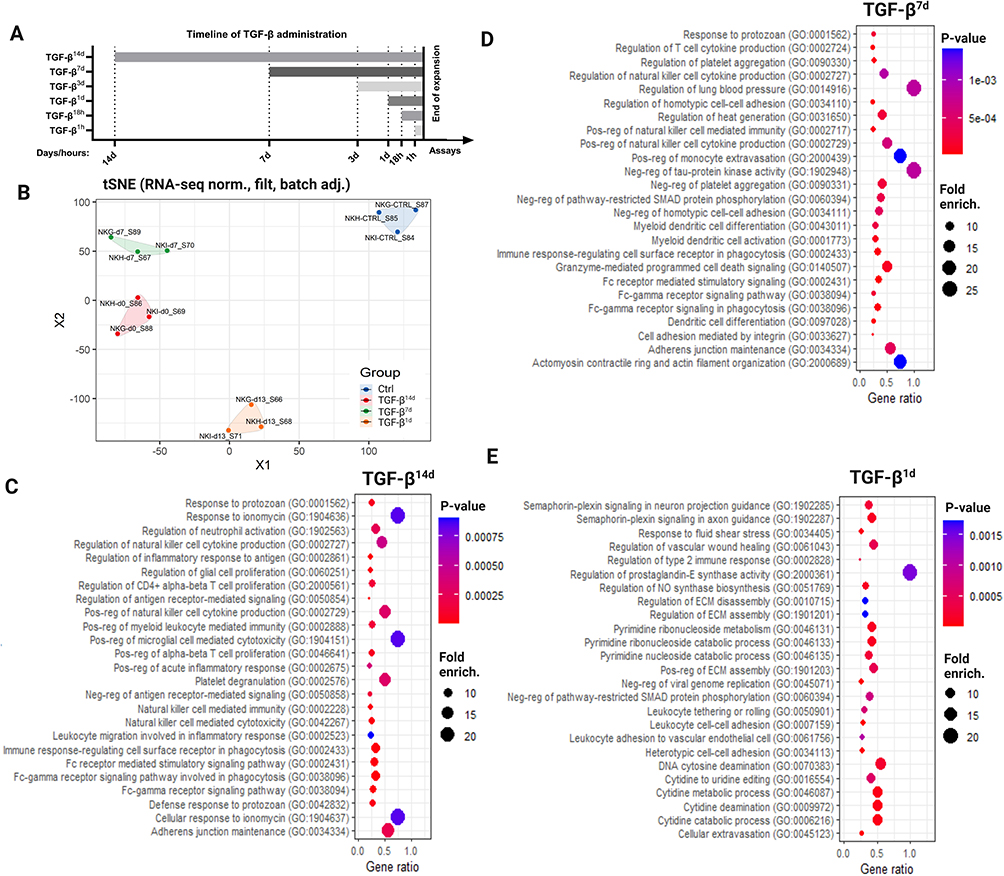 |
Figure 2 TGF-β reprograms gene expression to impair NK cytotoxicity and migration. (A) Timeline of TGF-β exposure in NK cell cultures during a 14-day expansion protocol, indicating time points for administration. (B) t-SNE clustering of RNA-seq data showing transcriptomic differences between untreated NK cells (Ctrl) and those exposed to TGF-β for 14 days (TGF-β14d), 7 days (TGF-β7d), or 1 day (TGF-β1d) (n = 3). (C-E) Pathway enrichment analysis of differentially expressed genes following TGF-β exposure at each time point, highlighting disrupted immune and cytotoxicity-related pathways (n = 3). |
Pathway enrichment analysis demonstrated significant disruptions in immune-related pathways, including cytokine production, effector molecule synthesis, Fc receptor signaling, and NK cell cytotoxicity in all three conditions (Figure 2C–E). The longest exposure (TGF-β14d; Figure 2C) primarily altered immune response pathways, affecting NK cell cytokine production, acute inflammatory responses, and cytotoxic activity, as well as NK cell migration. In the TGF-β7d condition (Figure 2D), pathways related to cytotoxic function including cytokine production, Fc-gamma receptor signaling, and cell adhesion were disrupted. Short-term exposure (TGF-β1d; Figure 2E) had a distinct effect, altering extracellular matrix maintenance and more strongly influencing NK cell migration and adhesion processes, including tethering, rolling, vascular adhesion, and extravasation. These findings indicate that even brief TGF-β exposure reshapes NK cell functionality, with more pronounced effects on mobility-related processes at shorter time points.
TGF-β Restrains NK Cell Cytotoxicity and Restricts Migration in vitro
To gain more insight into TGF-β–induced alterations in NK cells, we performed functional assays alongside additional RNA-seq analyses. To do so, we cultured NK cells with TGF-β across the three exposure durations (TGF-β14d, TGF-β7d and TGF-β1d) and then performed DEG analysis compared to untreated controls to assess the time-dependent impact on NK cell function.
DEG analysis revealed significant changes in key cytotoxicity-related genes. Specifically, long-term exposure (TGF-β14d) significantly reduced the expression of granzyme B (GZMB) and multiple cellular receptors, including NCR3, FCGR3A, KIR2DL4, FCGR3B, NCR2, CX3CR1, and CCR7 (Figure 3A). Intermediate exposure (TGF-β7d) affected a subset of these receptors (NCR3, KIR2DL4, and FCGR3B) while additionally downregulating interferon-γ (IFNG) and perforin 1 (PRF1) (Figure 3B). The shortest exposure (TGF-β1d) primarily altered SMAD3, GZMB, and NCR3 expression (Figure 3C). Global gene expression analysis further revealed that TGF-β influenced cellular mobility and adhesion pathways. While adhesion-related processes were disrupted across all treatment durations, pathways associated with tethering, rolling, and extravasation were most affected by short-term exposure (TGF-β1d) (Figure 2C–E). Among the most downregulated genes were SMAD3 - closely linked to TGF-β signaling and cell-cell interactions as well as CCL3, DAPK2, MAL, VCAM-1, and ITGB2. Interestingly, despite the general suppression of adhesion-related genes, CD9, CTNND1, PLEC, and PODXL2 were significantly upregulated (Figure 3D), suggesting a more complex regulatory role for TGF-β in NK cell adhesion.
 |
Figure 3 TGF-β restrains NK cell cytotoxicity and restricts migration in vitro. (A–C) Volcano plots showing differentially expressed genes (DEGs) in NK cells following TGF-β treatment for 1 day (TGF-β1d), 7 days (TGF-β7d), or 14 days (TGF-β14d). Significantly downregulated (red) and upregulated (blue) genes are highlighted, while non-significant genes appear in gray. Key genes involved in NK cell cytotoxicity, migration, and signaling are labeled. (logFC > 1; logFDR > 0.05).35–37 (D) Heatmap showing selected migration, adhesion, and cytotoxicity-related pathways in TGF-β-treated NK cells. Differentially expressed genes (DEGs) are grouped into Gene Ontology categories: cell-cell junction organization (CCJO), positive regulation of leukocyte migration (PRoLM), leukocyte adhesion to vascular endothelial cells (LAtVEC), cellular component maintenance (CCM), regulation of cellular extravasation (RoCE), and cell extravasation (CE) (n = 3) (E) NK cell-mediated cytotoxicity against K562 target cells, measured using the Calcein AM assay. Control (Ctrl) NK cells were compared with NK cells pre-treated with TGF-β for 14 days (TGF-β14d), 7 days (TGF-β7d), 3 days (TGF-β3d), 18 h (TGF-β18h), or 1 h (TGF-β¹ʰ) before the assay (n = 6–9; paired t-test; *p ≤ 0.05; **p ≤ 0.01; ***p ≤ 0.001; mean ± SD). (F) Fold change in geometric mean of fluorescence (GMF) of key NK cell markers after exposure to TGF-β (TGF-β14d, TGF-β7d, TGF-β1d) compared to controls (Ctrl) (n =3; paired t-test; * p ≤ 0.05; **p ≤ 0.01; ***p ≤ 0.001; mean ± SD). |
In agreement with these transcriptional changes, cytotoxicity assays using K562 cell suspensions showed a significant, time-dependent decline in NK cell-mediated target cell elimination following TGF-β exposure (Figure 3E). Furthermore, in correlation with the functional impairment, a phenotypical shift of NK cells was also confirmed via flow cytometry, as KIR2DL3, CD16, Granzyme B and NCR3 were significantly downregulated upon prolonged TGF-β exposure (Figure 3F, Supplement Figures SF3 and SF4).
Overall, these findings demonstrate that TGF-β pre-treatment not only suppresses NK cell cytotoxicity but also modulates adhesion and migration pathways, highlighting an underexplored regulatory role of TGF-β in NK cell mobility.
TGF-β Further Impairs NK Cell Cytotoxicity in Leukemic Co-Cultures with MSCs
To assess how TGF-β and MSCs influence NK cell-mediated cytotoxicity, we employed a 2D monolayer co-culture system using hTERT MSCs and one of four leukemic cell lines: K562 (CML), THP-1 (AML), MOLM-13 (AML), or U937 (pro-monocytes). Flow cytometry was used to measure target-specific NK cell cytotoxicity (Figure 4A–D). K562 cells, highly susceptible to NK cell killing and routinely used in cytotoxicity assessment, were included alongside AML-derived cell lines to compare differences in NK cell responses across models and evaluate the impact of MSCs.
 |
Figure 4 TGF-β further impairs NK cell cytotoxicity in leukemic co-cultures with MSCs. (A–D) Percentage of dead target cells (K562, THP-1, MOLM-13, U937) following NK cell-mediated cytotoxicity, assessed via flow cytometry. Control (Ctrl) NK cells and NK cells pre-treated with TGF-β for 7 days (TGF-β7d) or 18 hours (TGF-β18h) were co-cultured with target cells in the presence (gray bars) or absence (white bars) of MSCs (n = 8; paired t-test; ns p > 0.05; * p ≤ 0.05; ** p ≤ 0.01; *** p ≤ 0.001; **** p ≤ 0.0001; mean ± SD). (E) NK cell cytotoxicity toward K562 target cells in the presence or absence of MSCs, assessed using the Calcein AM assay (9:1 effector-to-target ratio). A significant reduction in K562 cell death was observed when MSCs were present, whereas NK cells did not induce MSC death (MSC only vs K562 + MSC). Paired t-test; ns p > 0.05; *p ≤ 0.05; **p ≤ 0.01; ***p ≤ 0.001; ****p ≤ 0.0001; mean ± SD. |
Consistent with previous Calcein AM cytotoxicity assay results, NK cell-mediated elimination of leukemic cells was significantly impaired by TGF-β in a time-dependent manner. Longer exposure (TGF-β7d) further decreased NK cell cytotoxicity across all tested leukemic cell lines, both in direct cytotoxicity assays and in co-culture with MSCs. Notably, the presence of MSCs slightly reduced the magnitude of TGF-β’s suppressive effect (Figure 4A–C). MSCs, however, provided additional protection against NK cell-mediated clearance of THP-1 and U937 cells, supporting the hypothesis that MSCs contribute to immune evasion in the leukemic microenvironment.
Finally, Calcein AM assays confirmed that K562 cells were protected by MSCs, while the cytotoxicity remained target-specific K562 cells were eliminated, whereas MSCs exhibited no significant increase in cell death (Figure 4E). These findings suggest that MSCs, in addition to TGF-β, contribute to a protective niche for leukemic cells, further diminishing NK cell-mediated cytotoxicity.
TGF-β Decreases NK Cell Infiltration in 3D Leukemic Spheroids
Generating compact spheroids composed solely of leukemic cells remains challenging.28 To overcome this, we established in vitro dual spheroids, in which hTERT MSCs serve as a 3D scaffold supporting leukemic K562, THP-1, MOLM-13, and U937 cells. We monitored the incorporation of these leukemic cells into the 3D structures by confocal microscopy and used maximum intensity projections to assess leukemic cell distribution within the spheroids (Figure 5A–H). All four cell lines successfully entered the MSC scaffolds and formed compact, uniform spheroids. Through optimization, a swift dissociation protocol was established, opting for thorough mechanical disruption by pipetting, rather than prolonged treatment with TrpLE, as the viability of cells would decrease with time. We also assessed the infiltration of TGF-β-treated NK cells into these dual spheroids (Supplement Figures SF5-SF8). Two exposure conditions were tested: 7-day (TGF-β7d) and 18-hour (TGF-β18h) treatments, with the shorter exposure chosen to better represent in vivo conditions. NK cell infiltration was significantly reduced following TGF-β treatment in all four spheroid types (Figure 5I–L). The most pronounced reductions were observed with TGF-β18h, particularly in THP-1 and MOLM-13 spheroids (Figure 5J and K), consistent with RNA-seq data. Overall, these data show that TGF-β suppresses NK cell infiltration into the 3D leukemic microenvironment and implicates TGF-β in restricting NK cell access to leukemic cells within the BMN.
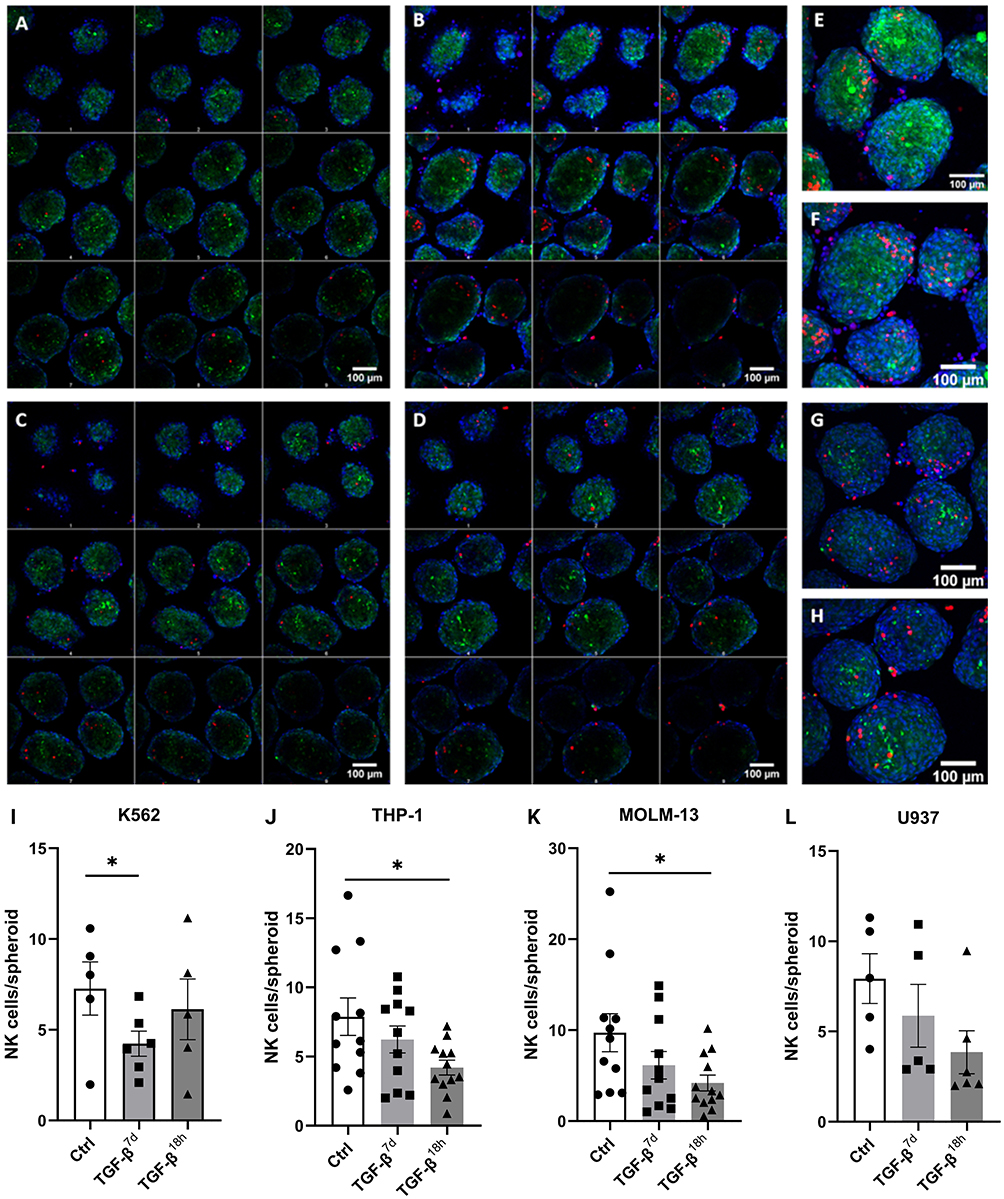 |
Figure 5 TGF-β decreases NK cell infiltration in 3D leukemic spheroids. (A–D) Representative z-stack confocal microscopy images of dual spheroids composed of MSCs (green, CellTrace CFSE) and leukemic cells K562 (A), THP-1 (B), MOLM-13 (C), and U937 (D) cells (red, CellTrace FarRed). The nuclei are counterstained with Hoechst 33342 (blue). (E–H) Maximum intensity projections for K562 (E), THP-1 (F), MOLM-13 (G), and U937 (H) spheroids. Scale bar: 100 µm. (I–L) Quantification of NK cells infiltrating spheroids following TGF-β pre-treatment for 7 days (TGF-β7d) or 18 hours (TGF-β18h), compared to untreated control (Ctrl) NK cells. NK cell counts were obtained from confocal microscopy images using ImageJ Fiji software. Independent experiments: (I) K562, n = 5; (J) THP-1, n = 11; (K) MOLM-13, n = 11; (L) U937, n = 5. Paired t-test; ns p > 0.05; *p ≤ 0.05; mean ± SD. |
Discussion
Leukemic cells in the BMN which are resistant to standard chemotherapy38 may underlie refractoriness or relapse in AML patients.39 NK cell-based immunotherapy offers a promising approach to prevent disease resistance and relapse by leveraging NK cells’ immunosurveillance function and antigen-independent cytotoxicity.1 Similar to solid tumors, however, NK cell dysfunction is common in AML and is likely driven by multiple factors, including hypoxia, nutrient deprivation, and immunosuppressive signals from myeloid-derived suppressor cells or MSCs within the BMN.15,40,41 Several immunomodulatory agents, such as IL-6, IL-10, prostaglandin E2 (PGE2), and TGF-β, have been implicated in AML-related NK cell impairment.8 Here, we assessed the impact of TGF-β on NK cell activity in order to describe the potential challenges posed by the AML niche after adoptive transfer. With this knowledge, in vitro NK cell expansion protocols could be optimized to support key NK cell functions directly coping with the obstacles presented by TGF-β.
We first demonstrated that TGF-β alters gene expression related to cytotoxicity, adhesion, and migration, then used 2D and 3D leukemic microenvironment models to show that TGF-β, likely present in the BMN, inhibits NK cell function, mobility, and cytotoxicity.
TGF-β acts via autocrine and paracrine signaling, with its deposition and activation closely tied to extracellular matrix components and tissue architecture.42 Given that circulating NK cells have a lifespan of 1–2 weeks in vivo,43 we administered TGF-β over different durations, from 1 hour to 14 days: while prolonged exposure is less physiologically relevant, it represents the in vitro NK cell expansion process using TGF-β-producing K562 feeder cells. In this study, the irradiated K562 cells are not present in the culture by day 7 of the expansion. Furthermore, the NK cell media is being partially refreshed with every passage. Yet K562-derived TGF-β in the media may be potentially deposited and activated throughout longer time periods of the expansion in case of continuous production protocols. By contrast, shorter treatments reflect NK cells’ potential in vivo exposure upon entering the BMN.
Using RNA-seq, we found that TGF-β influences NK cell proliferation, nucleic acid maintenance, and cytotoxicity (Figures 2 and 3). Consistently, AML patient-derived NK cells typically exhibit reduced expression of natural cytotoxicity receptors (NCRs), correlating with impaired anti-leukemic responses, which is further compounded by low NCR ligand expression on leukemic cells.8 Specifically, and similar to Viel et al, we observed TGF-β–mediated downregulation of cytotoxicity-related genes, including granzyme B, perforin 1, interferon-gamma, and Fc receptor subunits.36 NK cell activation receptors NCR2 and NCR3, as well as the activating/inhibitory receptor KIR2DL4, were also downregulated. NCR1 and NKG2D expression, however, remained unchanged, as did inhibitory KIR receptors KIR2DL2, KIR2DL5, and KIR3DL1 (Figure 3)—contrasting prior reports of their dysregulation in AML-derived NK cells.35,36,44 Additionally, our findings suggest that NK cells may perpetuate TGF-β–induced immunosuppression via PGE2, as genes in the PGE2 synthesis pathway were upregulated (Figure 2). Moreover, PGE2 has been shown to suppress NK cell cytotoxicity against AML blasts.45 In the future, the TGF-β-PGE2 axis could be further examined in the context of AML and therapy.
Beyond cytotoxicity, TGF-β altered NK cell adhesion and migration genes, affecting processes such as tethering, rolling, microtubule rearrangement, and chemoattraction. These findings emphasize the need to assess NK cell mobility alongside cytotoxicity in biological assays, in order to understand whether the NK cell failure in AML is caused by suppression of cytotoxic functions alone, or by incapability to enter and scan the BMN as well.
While NK cell migration is central to immune surveillance, it remains understudied in the context of TGF-β signaling.17,46,47 Here, we used 2D and 3D co-culture models incorporating hTERT MSCs and various leukemic cell lines (K562, THP-1, MOLM-13, and U937) to better evaluate NK cell infiltration and cytotoxicity. The BMN is a highly complex environment containing hematopoietic cells at various maturation stages, adipocytes, endothelial cells, fibroblasts, osteoblasts, and osteoclasts.2 Each cell type contributes uniquely to BMN homeostasis. For our studies, we prioritized MSCs due to their ability to form spheroids48 their plasticity under cancer-induced signals, and their role as TGF-β producers.15 A limitation of this study is the exclusive use of immortalized leukemic cell lines and hTERT MSCs, which may not fully reflect BMN heterogeneity in AML patients. This approach, however, allowed us to generate models with controlled, reproducible conditions for investigating NK cell interactions. Nevertheless, they lack the genetic and phenotypic diversity of primary AML blasts and patient-derived stromal cells.41,49 Future studies that incorporate patient-derived AML samples and primary BM stromal cells are now warranted to more closely recapitulate the in vivo immunosuppressive signals within the AML microenvironment. Despite these potential limitations, we confirmed that all cell types in our in vitro models produced TGF-β, with K562 cells being the most potent source. TGF-β secretion within the BMN originates from various cellular sources,46 and indeed, our results highlight the variable contributions of individual cell types.
Focusing on NK cell cytotoxicity in the presence of TGF-β and MSCs, we found that NK cells exposed to TGF-β exhibited reduced target-specific elimination of all four leukemic cell lines in a time-dependent manner. Conversely, MSCs reduced NK cell-mediated clearance of THP-1 and U937 cells, but this trend was absent for K562 and MOLM-13 cells. This variability likely stems from differing NK cell recognition mechanisms across target cell types. For example, MSCs may not modulate the expression of receptors critical for K562 elimination, such as NKG2C.50 Further studies are now needed to elucidate these molecular interactions.
Our findings indicate that TGF-β and MSCs impair NK cell-mediated leukemic cell elimination. Longer TGF-β exposure exacerbated functional impairment, but even short exposures - arguably more physiologically relevant - yielded variable responses among NK cell donors. This donor-dependent variability suggests that NK cell-based therapies may have heterogeneous efficacy once introduced into the leukemic niche. Future NK cell therapy protocols could incorporate cytokine-based functional assays to screen for highly responsive donors while excluding less suitable ones.
To better mimic in vivo conditions, we used a 3D spheroid model, leveraging the ability of MSCs to self-aggregate.48,51 Previous 3D leukemia models have demonstrated increased drug resistance and recapitulated hypoxic BMN conditions.52 Here, we utilised 3D spheroid cultures to investigate NK cell mobility, a key determinant of NK cell-based immunotherapy efficacy. Each leukemic cell type in our study successfully formed spheroids with MSCs overnight. NK cell infiltration varied by donor and leukemic cell type. TGF-β exposure generally reduced NK cell infiltration, particularly in THP-1–, MOLM-13–, and, to a lesser extent, U937-derived spheroids, when cells were treated for 18 hours. RNA sequencing corroborated these findings, with shorter TGF-β exposures most markedly affecting genes linked to extravasation, tethering, and rolling. Surprisingly, NK cell infiltration into K562-derived spheroids was significantly reduced following prolonged TGF-β exposure. This discrepancy may stem from unique K562–MSC interactions affecting spheroid composition. Future studies should characterize surface molecule expression and cell junction organization within different spheroid types to identify key receptors governing NK cell migration.
Conclusions
Overall, our results demonstrate that TGF-β downregulates genes associated with NK cell adhesion and movement, reinforcing its previously undescribed role in impairing NK cell mobility. These findings, combined with RNA sequencing data, provide novel insights into the impact of TGF-β on NK cell trafficking in the AML microenvironment. Immune cell migration and adhesion have primarily been studied in dendritic cells and other antigen-presenting cells, often in the context of solid tumors or other tissues.53–55 Despite AML is a non-solid malignancy, the migratory capacity of NK cells likely enhances their role in immune surveillance role in this cancer.56 Our findings, therefore, contribute to understanding how the leukemic niche modulates NK cell infiltration into the BMN, with potential implications for improving the efficacy of leukemia immunotherapies. By identifying key barriers to NK cell migration, these results may inform new therapeutic strategies targeting the BMN to enhance NK cell-based treatments.
Abbreviations
AML, acute myeloid leukemia; B-ALL, B-cell acute lymphoblastic leukemia; BM/BMN, bone marrow / bone marrow niche; CAF, cancer-associated fibroblast; CCJO, Cell-cell junction organization; CCM, Cellular component maintenance; CE, Cell extravasation; DEA, differential expression analysis; DEG, differentially expressed gene; FBS, fetal bovine serum; GZMB, granzyme B; IFNG, interferon gamma; IL, interleukin; LAtVEC, Leukocyte adhesion to vascular endothelial cells; MSC, mesenchymal stromal cell; NCR, natural cytotoxicity receptor; NK cell, natural killer cell; P/S, penicillin-streptomycin; PGE2, prostaglandin E2; PRF1, perforin 1; PRoLM, Positive regulation of leukocyte migration; qPCR, quantitative polymerase chain reaction; RoCE, Regulation of cellular extravasation; TGF-β, transforming growth factor beta.
Data Sharing Statement
The original contributions presented in the study are included in the article, further inquiries can be directed to the corresponding authors. Raw data were deposited in the NCBI SRA database (BioProject ID PRJNA1144653).
Ethics Approval
Anonymised buffy coats were purchased from the Transfusion Center of the Institute of Hematology and Blood Transfusion (Prague, Czechia) EK3/AZV ČR/06/2021 and from Blood transfusion department of General university hospital (Prague, Czechia) SUKLs244584/2023 with informed consent acquired from the donors in both instances. The research was conducted in accordance with the Declaration of Helsinki principles. Written informed consent was obtained from all patients with acute myeloid leukemia prior to leukapheresis sample collection, as approved by Ethics Committee Institute of Hematology and Blood Transfusion Board No: NW24-03-00103.
Acknowledgments
Authors would like to thank the Dept. of Cytometry at the Institute of Hematology and Blood Transfusion for flow cytometry services and Insight Editing London for critically reviewing the manuscript before submission.
Author Contributions
All authors made a significant contribution to the work reported, whether that is in the conception, study design, execution, acquisition of data, analysis and interpretation, or in all these areas; took part in drafting, revising or critically reviewing the article; gave final approval of the version to be published; have agreed on the journal to which the article has been submitted; and agree to be accountable for all aspects of the work. VS and LJ generated data, performed analysis and wrote the manuscript. KB, JH, MJ, KKug and EM contributed to the manuscript. VS, LJ, VB and BB performed confocal microscopy and analysis. DK, IT and MDM supervised the RNA sequencing experiment and participated in the subsequent analysis. JV, ZG, MB carried out patient enrolment. VB, MHK, KKuz and JF reviewed and edited the manuscript. JF coordinated and supervised research, secured funding, and critical revision of manuscript. All authors contributed to the article and data, and approved the submitted version.
Funding
The authors were supported by the Ministry of Health of the Czech Republic grant nr. – NU22-08-00287 all rights reserved and DRO (Institute of Hematology and Blood Transfusion – IHBT, 00023736) and the European Regional Development Fund (ERDF) for project AIIHHP, Grant/Award Number CZ.02.1.01/0.0/0.0/16_025/0007428.
Disclosure
The authors declare that the research was conducted in the absence of any commercial or financial relationships that could be construed as a potential conflict of interest.
References
1. Liu S, Galat V, Galat Y, Lee YKA, Wainwright D, Wu J. NK cell-based cancer immunotherapy: from basic biology to clinical development. J Hematol Oncol. 2021;14(1):7. doi:10.1186/s13045-020-01014-w
2. Shafat MS, Gnaneswaran B, Bowles KM, Rushworth SA. The bone marrow microenvironment – home of the leukemic blasts. Blood Rev. 2017;31(5):277–286. doi:10.1016/j.blre.2017.03.004
3. Ahmadvand M, Barough MS, Barkhordar M, et al. Phase I non-randomized clinical trial of allogeneic natural killer cells infusion in acute myeloid leukemia patients. BMC Cancer. 2023;23(1):1090. doi:10.1186/s12885-023-11610-x
4. Nguyen R, Wu H, Pounds S, et al. A Phase II clinical trial of adoptive transfer of haploidentical natural killer cells for consolidation therapy of pediatric acute myeloid leukemia. J Immunother Cancer. 2019;7(1):81. doi:10.1186/s40425-019-0564-6
5. Curti A, Ruggeri L, D’Addio A, et al. Successful transfer of alloreactive haploidentical KIR ligand-mismatched natural killer cells after infusion in elderly high risk acute myeloid leukemia patients. Blood. 2011;118(12):3273–3279. doi:10.1182/blood-2011-01-329508
6. Tumino N, Nava Lauson CB, Tiberti S, et al. The tumor microenvironment drives NK cell metabolic dysfunction leading to impaired anti‐tumor activity. Int, J, Cancer. doi:10.1002/ijc.34389
7. Jedlička M, Feglarová T, Janstová L, Hortová-Kohoutková M, Frič J. Lactate from the tumor microenvironment - A key obstacle in NK cell-based immunotherapies. Front Immunol. 2022;13. doi:10.3389/fimmu.2022.932055
8. D’Silva SZ, Singh M, Pinto AS. NK cell defects: implication in acute myeloid leukemia. Front Immunol. 2023;14. doi:10.3389/fimmu.2023.1112059
9. Wang D, Sun Z, Zhu X, et al. GARP-mediated active TGF-β1 induces bone marrow NK cell dysfunction in AML patients with early relapse post–allo-HSCT. Blood. 2022;140(26):2788–2804. doi:10.1182/blood.2022015474
10. Morikawa M, Derynck R, Miyazono K. TGF- β and the TGF-β family: context-dependent roles in cell and tissue physiology. Cold Spring Harb Perspect Biol. 2016;8(5):a021873. doi:10.1101/cshperspect.a021873
11. Huang CH, Liao YJ, Chiou TJ, Huang HT, Lin YH, Twu YC. TGF-β regulated leukemia cell susceptibility against NK targeting through the down-regulation of the CD48 expression. Immunobiology. 2019;224(5):649–658. doi:10.1016/j.imbio.2019.07.002
12. Rouce RH, Shaim H, Sekine T, et al. The TGF-β/SMAD pathway is an important mechanism for NK cell immune evasion in childhood B-acute lymphoblastic leukemia. Leukemia. 2016;30(4):800–811. doi:10.1038/leu.2015.327
13. Tabe Y, Shi YX, Zeng Z, et al. TGF-β-Neutralizing Antibody 1D11 enhances cytarabine-induced apoptosis in aml cells in the bone marrow microenvironment. PLoS One. 2013;8(6):e62785. doi:10.1371/journal.pone.0062785
14. Otegbeye F, Ojo E, Moreton S, et al. Inhibiting TGF-beta signaling preserves the function of highly activated, in vitro expanded natural killer cells in AML and colon cancer models. PLoS One. 2018;13(1):1–13. doi:10.1371/journal.pone.0191358
15. Poggi A, Musso A, Dapino I, Zocchi MR. Mechanisms of tumor escape from immune system: role of mesenchymal stromal cells. Immunol Lett. 2014;159(1–2):55–72. doi:10.1016/j.imlet.2014.03.001
16. Pan C, Liu P, Ma D, et al. Bone marrow mesenchymal stem cells in microenvironment transform into cancer-associated fibroblasts to promote the progression of B-cell acute lymphoblastic leukemia. Biomed. Pharmacother. 2020;130:110610. doi:10.1016/j.biopha.2020.110610
17. Bataller A, Montalban-Bravo G, Soltysiak KA, Garcia-Manero G. The role of TGFβ in hematopoiesis and myeloid disorders. Leukemia. 2019;33(5):1076–1089. doi:10.1038/s41375-019-0420-1
18. Zhai Y, Zhang J, Wang H, et al. Growth differentiation factor 15 contributes to cancer-associated fibroblasts-mediated chemo-protection of AML cells. J Exp Clin Cancer Res. 2016;35(1):147. doi:10.1186/s13046-016-0405-0
19. Lee DA. Regulatory considerations for NK cells used in human immunotherapy applications. 2016:347–361. doi:10.1007/978-1-4939-3684-7_29
20. Boegel S, Löwer M, Bukur T, Sahin U, Castle JC. A catalog of HLA type, HLA expression, and neo-epitope candidates in human cancer cell lines. Oncoimmunology. 2014;3(8):e954893. doi:10.4161/21624011.2014.954893
21. Barozzi D, Scielzo C. Emerging strategies in 3D culture models for hematological cancers. Hemasphere. 2023;7(8):e932. doi:10.1097/HS9.0000000000000932
22. Riffle S, Hegde RS. Modeling tumor cell adaptations to hypoxia in multicellular tumor spheroids. J Exp Clin Cancer Res. 2017;36(1):102. doi:10.1186/s13046-017-0570-9
23. Syama K, Hassan EM, Zou S. Advances in culture methods for acute myeloid leukemia research. Oncoscience. 2021;8:82–90. doi:10.18632/oncoscience.540
24. Matsunaga T, Takemoto N, Sato T, et al. Interaction between leukemic-cell VLA-4 and stromal fibronectin is a decisive factor for minimal residual disease of acute myelogenous leukemia. Nat Med. 2003;9(9):1158–1165. doi:10.1038/nm909
25. Ciciarello M, Corradi G, Loscocco F, et al. The yin and yang of the bone marrow microenvironment: pros and cons of mesenchymal stromal cells in acute myeloid leukemia. Front Oncol. 2019;9:9. doi:10.3389/fonc.2019.01135
26. Moschoi R, Imbert V, Nebout M, et al. Protective mitochondrial transfer from bone marrow stromal cells to acute myeloid leukemic cells during chemotherapy. Blood. 2016;128(2):253–264. doi:10.1182/blood-2015-07-655860
27. Harada T, Tsuboi I, Utsunomiya M, Yasuda M, Aizawa S. Kinetics of leukemic cells in 3D culture with stromal cells and with arginine deprivation stress. J Biosci Bioeng. 2020;130(6):650–658. doi:10.1016/j.jbiosc.2020.07.018
28. Bray LJ, Binner M, Körner Y, von Bonin M, Bornhäuser M, Werner C. A three-dimensional ex vivo tri-culture model mimics cell-cell interactions between acute myeloid leukemia and the vascular niche. Haematologica. 2017;102(7):1215–1226. doi:10.3324/haematol.2016.157883
29. Xu H, Muise ES, Javaid S, et al. Identification of predictive genetic signatures of Cytarabine responsiveness using a 3D acute myeloid leukaemia model. J Cell Mol Med. 2019;23(10):7063–7077. doi:10.1111/jcmm.14608
30. Schindelin J, Arganda-Carreras I, Frise E, et al. Fiji: an open-source platform for biological-image analysis. Nat Methods. 2012;9(7):676–682. doi:10.1038/nmeth.2019
31. Trsova I, Hrustincova A, Krejcik Z, et al. Expression of circular RNAs in myelodysplastic neoplasms and their association with mutations in the splicing factor gene SF3B1. Mol Oncol. 2023;17(12):2565–2583. doi:10.1002/1878-0261.13486
32. R Core Team. R: a language and environment for statistical computing. Published online 2021.
33. Holmgaard RB, Schaer DA, Li Y, et al. Targeting the TGFβ pathway with galunisertib, a TGFβRI small molecule inhibitor, promotes anti-tumor immunity leading to durable, complete responses, as monotherapy and in combination with checkpoint blockade. J Immunother Cancer. 2018;6(1):47. doi:10.1186/s40425-018-0356-4
34. Transforming growth factor β signaling inhibitor, SB-431542, induces maturation of dendritic cells and enhances anti-tumor activity. Oncol Rep. 2010;24(6). doi:10.3892/or_00001028
35. Cianga VA, Rusu C, Pavel-Tanasa M, et al. Combined flow cytometry natural killer immunophenotyping and KIR/HLA-C genotyping reveal remarkable differences in acute myeloid leukemia patients, but suggest an overall impairment of the natural killer response. Front Med. 2023:10. doi:10.3389/fmed.2023.1148748.
36. Viel S, Marçais A, Guimaraes FSF, et al. TGF-β inhibits the activation and functions of NK cells by repressing the mTOR pathway. Sci Signal. 2016;9(415). doi:10.1126/scisignal.aad1884
37. Rebuffet L, Melsen JE, Escalière B, et al. High-dimensional single-cell analysis of human natural killer cell heterogeneity. Nat Immunol. 2024;25:1474–1488. doi:10.1038/s41590-024-01883-0
38. Konopleva MY, Jordan CT. Leukemia stem cells and microenvironment: biology and therapeutic targeting. J Clin Oncol. 2011;29(5):591–599. doi:10.1200/JCO.2010.31.0904
39. Thol F, Ganser A. Treatment of relapsed acute myeloid leukemia. Curr Treat Options Oncol. 2020;21(8):66. doi:10.1007/s11864-020-00765-5
40. Lamb MG, Rangarajan HG, Tullius BP, Lee DA. Natural killer cell therapy for hematologic malignancies: successes, challenges, and the future. Stem Cell Res Ther. 2021;12(1):1–19. doi:10.1186/s13287-021-02277-x
41. Balandrán JC, Dávila-Velderrain J, Sandoval-Cabrera A, et al. Patient-derived bone marrow spheroids reveal leukemia-initiating cells supported by mesenchymal hypoxic niches in pediatric B-ALL. Front Immunol. 2021:12. doi:10.3389/fimmu.2021.746492.
42. Zhao H, Wei J, Sun J. Roles of TGF-β signaling pathway in tumor microenvirionment and cancer therapy. Int Immunopharmacol. 2020;89:107101. doi:10.1016/j.intimp.2020.107101
43. Zhang Y, Wallace DL, de Lara CM, et al. In vivo kinetics of human natural killer cells: the effects of ageing and acute and chronic viral infection. Immunology. 2007;121(2):258–265. doi:10.1111/j.1365-2567.2007.02573.x
44. Mirzazadeh S, Bemani P, Halimi H, et al. Association of killer cell immunoglobulin-like receptors and their cognate HLA class I ligands with susceptibility to acute myeloid leukemia in Iranian patients. Sci Rep. 2023;13(1):11456. doi:10.1038/s41598-023-38479-x
45. Rothfuß C, Baumann T, Donakonda S, et al. Two-layered immune escape in AML is overcome by Fcγ receptor activation and inhibition of PGE2 signaling in NK cells. Blood Journal. doi:10.1182/blood.2024025706
46. Batlle E, Massagué J. Transforming growth factor-β signaling in immunity and cancer. Immunity. 2019;50(4):924–940. doi:10.1016/j.immuni.2019.03.024
47. Brown H, Esterházy D. Paying a price twice: dose-dependent effects of treg cell-derived TGF- β on Tolerance. Immunity. 2020;53(6):1128–1130. doi:10.1016/j.immuni.2020.11.008
48. Deynoux M, Sunter N, Ducrocq E, et al. A comparative study of the capacity of mesenchymal stromal cell lines to form spheroids. PLoS One. 2020;15(6):e0225485. doi:10.1371/journal.pone.0225485
49. von der Heide EK, Neumann M, Vosberg S, et al. Molecular alterations in bone marrow mesenchymal stromal cells derived from acute myeloid leukemia patients. Leukemia. 2017;31(5):1069–1078. doi:10.1038/leu.2016.324
50. Düchler M, Offterdinger M, Holzmüller H, et al. NKG2‐C is a receptor on human natural killer cells that recognizes structures on K562 target cells. Eur J Immunol. 1995;25(10):2923–2931. doi:10.1002/eji.1830251032
51. Tietze S, Kräter M, Jacobi A, et al. Spheroid culture of mesenchymal stromal cells results in morphorheological properties appropriate for improved microcirculation. Adv. Sci. 2019;6(8). doi:10.1002/advs.201802104
52. Wilson A, Hockney S, Parker J, Angel S, Blair H, Pal D. A human mesenchymal spheroid prototype to replace moderate severity animal procedures in leukaemia drug testing. F1000Res. 2022;11:1280. doi:10.12688/f1000research.123084.1
53. Shang L, Jiang X, Zhao X, et al. Mitochondrial DNA-boosted dendritic cell-based nanovaccination triggers antitumor immunity in lung and pancreatic cancers. Cell Rep Med. 2024;5(7):101648. doi:10.1016/j.xcrm.2024.101648
54. Zhou L, Zhao L, Wang M, et al. Dendritic Cell‐Hitchhiking In Vivo for Vaccine Delivery to Lymph Nodes. Adv. Sci. doi:10.1002/advs.202402199
55. Kim J, Kang S, Kim J, Yong S, Lahiji SF, Kim Y. Dual adjuvant‐loaded peptide antigen self‐assembly potentiates dendritic cell‐mediated tumor Immunotherapy. Adv. Sci. doi:10.1002/advs.202403663
56. Mark C, Czerwinski T, Roessner S, et al. Cryopreservation impairs 3-D migration and cytotoxicity of natural killer cells. Nat Commun. 2020;11(1):5224. doi:10.1038/s41467-020-19094-0
 © 2025 The Author(s). This work is published and licensed by Dove Medical Press Limited. The
full terms of this license are available at https://www.dovepress.com/terms.php
and incorporate the Creative Commons Attribution
- Non Commercial (unported, 4.0) License.
By accessing the work you hereby accept the Terms. Non-commercial uses of the work are permitted
without any further permission from Dove Medical Press Limited, provided the work is properly
attributed. For permission for commercial use of this work, please see paragraphs 4.2 and 5 of our Terms.
© 2025 The Author(s). This work is published and licensed by Dove Medical Press Limited. The
full terms of this license are available at https://www.dovepress.com/terms.php
and incorporate the Creative Commons Attribution
- Non Commercial (unported, 4.0) License.
By accessing the work you hereby accept the Terms. Non-commercial uses of the work are permitted
without any further permission from Dove Medical Press Limited, provided the work is properly
attributed. For permission for commercial use of this work, please see paragraphs 4.2 and 5 of our Terms.
Recommended articles
Research Progress of NK Cells in Glioblastoma Treatment
Wu H, Liu Q, Wang F, Gao W, Zhou F, Zhao H
OncoTargets and Therapy 2025, 18:87-106
Published Date: 18 January 2025
Adaptation of Natural Killer Cells to Hypoxia: A Review of the Transcriptional, Translational, and Metabolic Processes
Chang TD, Chen YJ, Luo JL, Zhang C, Chen SY, Lin ZQ, Zhang PD, Shen YX, Tang TX, Li H, Dong LM, Tang ZH, Chen D, Wang YM
ImmunoTargets and Therapy 2025, 14:99-121
Published Date: 18 February 2025