")
Back to Journals » Journal of Inflammation Research » Volume 17
The Gastric Connection: Serum Gastric Biomarkers, Metabolic Syndrome and Transition in Metabolic Status
Authors Qin Y , Yao S, Wang G, Xu Z , Zhu G, Li Y, Yang P, Wang J, Zou C, Chen C
Received 24 April 2024
Accepted for publication 5 September 2024
Published 16 September 2024 Volume 2024:17 Pages 6439—6452
DOI https://doi.org/10.2147/JIR.S475352
Checked for plagiarism Yes
Review by Single anonymous peer review
Peer reviewer comments 2
Editor who approved publication: Dr Tara Strutt
Yuexiang Qin,1,2 Shanhu Yao,3,4 Gaoyuan Wang,5 Ziyuan Xu,6,7 Gangcai Zhu,8 Ying Li,1,2 Pingting Yang,1,2 Jiangang Wang,1,2 Chunbo Zou,5 Changhan Chen7,9
1Department of Health Management Medicine, The Third Xiangya Hospital of Central South University, Changsha, Hunan Province, 410013, People’s Republic of China; 2Hunan Chronic Disease Health Management Medical Research Center, The Third Xiangya Hospital, Central South University, Changsha, Hunan Province, 410013, People’s Republic of China; 3Department of Radiology, The Third Xiangya Hospital, Central South University, Changsha, Hunan Province, 410013, People’s Republic of China; 4Key Laboratory of Medical Information Research, Central South University, Changsha, Hunan Province, 410013, People’s Republic of China; 5Department of Nephrology, Nanjing University of Chinese Medicine, Nanjing, Jiangsu, People’s Republic of China; 6Department of Otolaryngology, Head and Neck Surgery, Xiangya Hospital, Central South University, Changsha, Hunan Province, 410008, People’s Republic of China; 7National Clinical Research Center for Geriatric Disorders, Xiangya Hospital, Central South University, Changsha, Hunan, People’s Republic of China; 8Department of Otolaryngology, Head and Neck Surgery, The Second Xiangya Hospital, Central South University, Changsha, Hunan Province, 410008, People’s Republic of China; 9National Medical Metabolomics International Collaborative Research Center, Xiangya Hospital, Central South University, Changsha, Hunan Province, 410008, People’s Republic of China
Correspondence: Changhan Chen, National Medical Metabolomics International Collaborative Research Center, Xiangya Hospital, Central South University, Changsha, Hunan, 410008, People’s Republic of China, Tel +86-13875974606, Email [email protected]
Objective: Inflammation plays a crucial role in the development of metabolic syndrome (MetS). However, the roles of pepsinogens (PGs) and gastrin, known biomarkers linked to gastric inflammation, in MetS and the transition of MetS status are unclear. This research aimed to explore the relationship between MetS, the transition of MetS status, and levels of gastric biomarkers.
Methods: This large-scale cross-sectional study included 19162 participants aged 18– 80 years between August 2021 and March 2024. Serum levels of the gastric biomarkers PGI, PGII, and gastrin-17 were analyzed using enzyme-linked immunosorbent assay. In addition, the relationship between transitions of MetS status based on 1032 MetS-negative participants from baseline to the second health exam after 2 years was considered. The association between MetS and the transitions of MetS status and gastric biomarkers was analyzed using logistic regression models.
Results: The prevalence of MetS in the study population was 31.4%, with higher rates in males (35.2%) than females (24.6%). Gastrin-17 levels were markedly elevated in participants with MetS, a trend observed in both genders. In the logistic regression analysis, after adjusting for confounding factors, gastrin-17 levels were strongly and positively correlated with MetS in the entire cohort and in males but not in females. Male participants with MetS had lower levels of PGI and PGII than those without MetS, whereas the opposite trend was observed in females. Logistic regression analysis indicated that PGI and PGII were not independently associated with MetS. During the follow-up of 2 years, 199 (19.28%) of the 1032 MetS-negative participants transitioned to MetS-positive status. As compared to the stable MetS-negative subjects, transition from MetS-negative to MetS-positive was associated with higher levels of gastrin-17, especially in males, but not in females.
Conclusion: Gastrin-17 is a promising biomarker for MetS, exhibiting potential utility in monitoring the transition of MetS status and revealing gender difference.
Keywords: gastric biomarkers, gastrin-17, metabolic syndrome, transition, gender difference
Introduction
Metabolic syndrome (MetS) is characterized by a constellation of risk factors, including central obesity, high blood pressure, elevated fasting glucose, high triglyceride (TG) levels, and low high-density lipoprotein cholesterol (HDLC) levels.1 Notably, more than one billion people suffer from MetS worldwide2 and the prevalence of MetS has increased in both developing and developed nations over the past few decades. The prevalence of MetS was 27.93% in North America, 27.65% in South America, 21.27% in Asia, 16.04% in Africa, and 10.47% in Europe.3 The Chinese Nutrition and Health Surveillance (2015–2017) reported that almost one-third (31.1%) of Chinese adults have MetS.4 Besides, recent study shown that the prevalence of the middle-aged and elderly Chinese diagnosed with MetS was 41.87%.5 The prevalence of MetS also exhibit sexual dimorphism due to sex-related effects on key components like insulin-resistance and abdominal fat.6 Interestingly, several studies demonstrated that the prevalence of MetS was higher in men than women before the age of 60 but the ratio inverted after this age.7–9 In a prospective cohort study indicated that female sex was associated with decreased probability of developing MetS.10 Early identification of MetS is vital for identifying individuals at heightened risk for atherosclerotic cardiovascular diseases (ASCVD). However, despite extensive research, the intricate pathophysiology of MetS remains incompletely understood.
Emerging evidence suggests that chronic systemic inflammation and the resultant production of pro-inflammatory cytokines play a pivotal role in MetS development.11,12 Activation of nuclear factor kappa B in MetS induces a state of chronic low-grade inflammation and phosphorylate insulin receptor causing insulin resistance.13–15 Pro-inflammatory cytokines (tumor necrosis factor α, interleukin-1β, interleukin-6, etc) derived from adipose tissue, liver, muscle and other tissues also contribute to insulin resistance.16–19 The gastrointestinal tract, particularly the stomach, is a critical site for initiating this chronic inflammation. Helicobacter pylori (H. pylori) infection, a major cause of gastric inflammation, influences lipid and glucose metabolism, potentially exacerbating atherosclerosis and MetS.20–23 Several studies have shown that H. pylori induced insulin resistance by activation of pro-inflammatory factors like C-reactive protein, production of reactive oxygen species, alteration of ghrelin and leptin levels and increased production of lipopolysaccharides.24–27 Besides, H. pylori also promotes the synthesis of polyunsaturated ether phospholipids leading to susceptibility to ferroptosis28 and contributes to atherosclerosis by inducing endothelial dysfunction,29 dysregulation of lipid metabolism (increased total cholesterol and triglyceride levels and reduced high-density lipoprotein levels),30–32 and hyperhomocysteinemia.33 Moreover, gastric biomarkers, including pepsinogen (PG) I, PGII, and gastrin, are also associated with gastric inflammation.34 Previous studies have indicated a clinical association between serum gastric biomarkers and blood pressure, fasting blood glucose (FBG), TG, and uric acid levels.23,35–37 However, the relationships between these gastric biomarkers and MetS have not been examined, and the mechanisms by which gastric biomarkers influence metabolic indices are not clear. The levels of gastric biomarkers are influenced by many factors such as certain drugs (eg, proton pump inhibitors, PPIs) and gastric diseases (eg, H. pylori infection, chronic atrophic gastritis). For example, H. pylori infection induces heparin-binding EGF-like growth factor which activates the mitogen-activated protein kinase pathway resulting in an increased gastrin expression.38 Long-term PPI therapy leads to hypergastrinemia via inducing acid suppression which interferes with antral D and G cells.39 This cross-sectional study aimed to investigate the associations between serum gastric biomarkers (PGI, PGII, and gastrin-17) and MetS. Additionally, we sought to explore whether these biomarkers exhibit sexual dimorphism and were associated with transitions of MetS status based on 1032 MetS-negative participants from baseline to the second health exam after 2 years.
Material and Methods
Study Population
This present study was conducted at the Health Management Medicine Center of Third Xiangya Hospital, Central South University, from August 2021 to March 2024. We collected basic information and data on serum levels of PGI, PGII, and gastrin-17 from 19162 participants. Transitions in MetS status of MetS-negative subjects were examined from baseline to the second exam after 2 years in 1032 participants from the total 19162 participants. This study was approved by the Institutional Review Board of the Third Xiangya Hospital (ethical approval number: I21102), with all procedures followed by the Declaration of Helsinki, and all essential permissions were obtained from the government and health commission. Written Informed consent was signed by each participant. All personal information was anonymized during analysis and reporting to ensure confidentiality and privacy.
Measurement of Serum Levels of Gastrin-17, PGI, and PGII
Serum samples were collected following an overnight fast, processed within 30 min post-collection, and stored at −80 °C until analysis. The serum samples were analyzed using enzyme-linked immunosorbent assay (ELISA) kits specifically designed for gastrin-17 (catalog No. 601 035CN, Biohit, Plc., Helsinki, Finland), PGI, catalog No. 601 010.01CN, Biohit, Plc)., and PGII (catalog No. 601 020.02CN, Biohit, Plc). The tests were conducted according to the manufacturer’s instructions. Standard curves for PGI, PGII, and gastrin-17 were used to determine the concentrations in unknown samples.
Covariates
Baseline characteristics, including demographic, clinical, and laboratory data, were systematically collected. A history of hypertension (HBP), diabetes mellitus (DM), dyslipidemia, ASCVD, smoking, and alcohol consumption was ascertained from the medical records. ASCVD included coronary heart disease, stroke, and peripheral arterial disease. Medication histories spanning the past three months were recorded, focusing on antihypertensive drugs, antidiabetic agents, antiplatelet drugs, statins, PPIs, and histamine 2 (H2)-receptor antagonists. Physical measurements such as height, body mass, waist circumference (WC), systolic blood pressure (SBP), and diastolic blood pressure (DBP) were obtained. Body mass index (BMI) was calculated by dividing body weight in kilograms by the square of height in meters. Laboratory parameters, including creatinine (Cr), FBG, total cholesterol (TC), TG, HDLC, low-density lipoprotein cholesterol (LDLC), and glycosylated hemoglobin (HbA1C) levels, were measured. The presence of H. pylori infection was determined for each participant using a 13C urea breath test, as previously described.40
Definition of MetS
MetS was defined according to the criteria set by the International Diabetes Federation.41 A MetS diagnosis required meeting at least three of the following five criteria: (1) WC ≥ 80 cm (females) or ≥90 cm (males); (2) TG > 1.7 mmol/L or on specific treatment for this lipid abnormality; (3) HDLC < 1.29 mmol/L (females) or <1.03 mmol/L (males); (4) BP ≥ 130/85 mmHg or treatment for or diagnosis of hypertension; and (5) FBG > 5.6 mmol/L or diagnosis of type 2 DM.
Statistical Analysis
Continuous variables are presented as the means with standard deviations or medians with interquartile range (IQRs) for normally and non-normally distributed data, respectively. Categorical variables are reported as numbers and percentages. For continuous variables, the Student’s t-test and Mann–Whitney U-test were used for inter-group comparisons, whereas for categorical variables, Pearson’s χ2 test was used to assess inter-group differences. For better clinical interpretation, patients were separated into three groups based on levels of gastrin-17, PGI, and PGII, and the PGI/PGII ratio was sub-grouped into tertiles. Independent risk factors for MetS were evaluated using binary logistic regression analysis with adjustment for age, sex, and other possible confounders. After assessing multicollinearity using the variance inflation factor (VIF), independent variables showing no multicollinearity (VIF < 10) and having P < 0.05 were entered into the logistic regression models. Results are displayed as odds ratios (ORs) with 95% confidence intervals (CIs). Data analysis and visualization were conducted using SPSS 22.0 (SPSS, Inc., Chicago, IL, United States) and Origin Pro 2022 software (Origin Lab Corporation, Northampton, MA, United States). The Correlation Heatmap was plotted using http://www.bioinformatics.com.cn, an online platform. Statistical significance was established at P < 0.05.
Results
Descriptive Analysis of Enrolled Participants with and without MetS
The characteristics of the MetS-positive and MetS-negative groups are shown in Table 1. A total of 19162 participants (12271 males and 6891 females) are included in this study. Among these, 6012 (31.4%) were diagnosed with MetS, including 4316 males and 1696 females, indicating a higher prevalence of MetS in males (35.2%) compared to females (24.6%). Univariate analysis revealed that participants with MetS were older and had higher rates of HBP, DM, hyperlipidemia, ASCVD, H. pylori infection, smoking, alcohol consumption, and medication usage than participants without MetS. Participants with MetS also had higher BMI, WC, SBP, DBP, and levels of TC, TG, FBG, HbA1c, and Cr than those without MetS.
 |
Table 1 Baseline Characteristics of Participants with and without Metabolic Syndrome |
Gastrin-17, PGI, and PGII Levels in Participants with and without MetS
The median (IQR) levels of gastrin-17, PGI, and PGII, and the PGI/PGII ratio of all participants are shown in Table 1. Serum levels of gastrin-17 in the MetS-positive group were higher than those in the MetS-negative group [1.80 (IQR, 0.93–4.04) vs 1.59 (0.71–3.33) pmol/L]. The serum levels of PGI and PGII and the PGI/PGII ratio were not significantly different between participants with or without MetS.
Baseline Characteristics and Gastric Biomarkers of Males and Females
The demographic characteristics of individuals in the sex-based subgroups are shown in Table S1. Male participants were slightly younger and had significantly higher proportion of individuals with HBP, DM, hyperlipidemia, smoking, drinking, and hypertensive medication history than female participants. Males also had higher median BMI, WC, SBP, and DBP levels of TG, HDLC, LDLC, FBG, HbA1c, Cr, gastrin-17, PGI, PGII, and PGI/PGII ratio than females.
Characteristics and Gastric Biomarkers of Participants with or Without MetS Stratified by Sex
The demographics and clinical markers of male and female participants with and without MetS are shown in Table S2. Both male and female participants with MetS were older and more likely to have HBP, DM, ASCVD, hyperlipidemia, H. pylori infection, alcohol consumption, and medication history (except for hypertensive medication history) than those without MetS. They also had higher BMI, WC, SBP, DBP, TC, TG, FBG, and HbA1c levels. HDLC levels were lower in the MetS-positive group. The median levels of gastrin-17 were higher in participants with MetS in both sexes. The concentrations of PGI and PGII and the PGI/PGII ratio showed sexual dimorphism, as displayed in Table 2. Males with MetS had lower levels of PGI and PGII and a higher PGI/PGII ratio than males without MetS, whereas females with MetS had higher levels of PGI and PGII and a lower PGI/PGII ratio than females without MetS.
 |
Table 2 Multivariable Logistic Regression Analysis of the Relationship Between Gastric Biomarkers and Transition of MetS Status |
Analysis of the Association Between Gastric Biomarkers and MetS Using Logistic Regression Models
To better explore the relationship between gastric biomarkers and MetS, we categorized patients into three groups according to biomarker levels and performed a logistic regression analysis (Table 3). We used VIF analysis to confirm multicollinearity and conducted independent stepwise regression analyses for all the adjusted models. Table S3 shows the results of the multicollinearity analysis; variables with VIF > 10 were removed from the final models. For the overall group comparison, in Model 1 was adjusted for age and sex, both the second and the third gastrin-17 tertiles were significantly correlated with MetS (tertile 2: OR, 1.225; 95% CI, 1.133–1.324; P < 0.001; and tertile 3: OR, 1.465; 95% CI, 1.353–1.587; P < 0.001) compared to the first gastrin-17 tertile. The second and third PGI tertiles were negatively correlated with MetS (tertile 2: OR, 0.837; 95% CI, 0.767–0.913; P < 0.001; and tertile 3: OR, 0.742; 95% CI, 0.665–0.828; P < 0.001) compared to the first PGI tertile. Compared with the first PGII tertile, the second and third PGII-level tertiles were negatively associated with MetS. Similar results were also found in Model 2 when adjusted for age, sex, HBP, DM, hyperlipidemia, ASCVD, smoking, drinking, H. pylori infection, and medication history. In Model 3 was adjusted for age, sex, HBP, DM, hyperlipidemia, ASCVD, smoking, drinking, H. pylori infection, medication history, BMI, WC, SBP, DBP, TG, HDLC, FBG, HBA1C, and Cr levels, only the second and third gastrin-17 tertiles were significantly associated with MetS (tertile 2: OR, 1.158; 95% CI, 1.029–1.304; P = 0.015; and tertile 3: OR, 1.150; 95% CI, 1.017–1.300; P = 0.026) compared to the first gastrin-17 tertile.
 |
Table 3 Multivariable Logistic Regression Analysis of the Relationship Between Gastric Biomarkers and Metabolic Syndrome According to Tertiles |
In males, the gastrin-17 tertiles and the PGI tertiles showed the same trends as the whole-group analyses for Model 1 and Model 2. In females, for Models 1 and 2, the highest tertile of gastrin-17 was positively associated with MetS and both the middle PGI and PGII tertiles were negatively associated with MetS compared to corresponding lowest tertiles. In Model 3, gastrin-17 showed a positive association with MetS, whereas PGI and PGII showed no significant association with MetS.
Gastric Biomarkers and MetS Components
The associations between each MetS component and gastric biomarkers are shown in Table S4. The results indicated that gastrin-17 levels were higher in individuals with higher WC and levels of TG, HDLC, SBP, DBP, and FBG (P < 0.001). PGI levels were higher in individuals with higher levels of WC, SBP, DBP, TG, and HDLC. PGII levels were higher in participants with higher levels of TG and HDLC. PGI and PGII levels were lower in participants with higher FBG levels. The PGI/II ratio was higher in participants with higher SBP and DBP, and lower levels of HDLC and TG. The five components of MetS were combined to calculate a composite MetS score (0–5). As the MetS score increased (0–4), gastrin-17 levels increased both in males and females (Figure 1A–D).
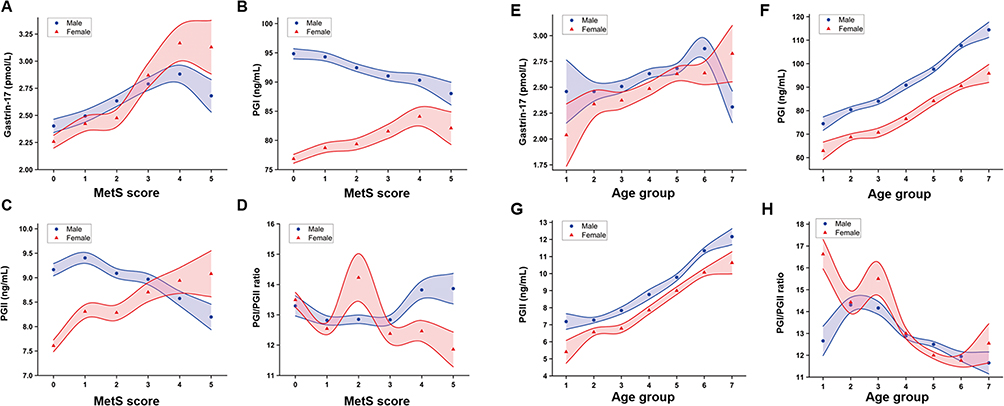 |
Figure 1 The change of gastric biomarkers along with continuous metabolic syndrome severity score and different age groups. (A) Gastrin-17; (B) Pepsinogen (PG) I; (C) PGII; (D) PGI/PGII change with metabolic syndrome severity score. Metabolic syndrome (MetS) score: 0–5: Subjects without and with 1, 2, 3, 4, and 5 components of MetS. The error bars are drawn as transparent bands. Transparency has been set for all curves so that data in overlapping regions can be clearly seen. Points indicate mean ± SE. MetS: Metabolic syndrome; PGI: Pepsinogen I; PGII: Pepsinogen II. (E) Gastrin-17; (F) Pepsinogen (PG) I; (G) PGII; (H) PGI/PGII trends with age. Transparency has been set for all curves so that data in overlapping regions can be clearly seen. The error bars are drawn as transparent bands. The shaded curves represent means ± SE. Age groups: 1: < 20 years old; 2: 20–29 years old; 3: 30–39 years old; 4: 40–49 years old; 5: 50–59 years old; 6: 60–69 years old; and 7: > 70 years old. PGI: Pepsinogen I; PGII: Pepsinogen II. |
Relationship Between Gastric Biomarkers and Clinical Parameters
The results of the correlational analysis between serum gastric biomarker levels and clinical parameters are shown in Figure S1. Serum levels of PGI and PGII were positively correlated with age and serum levels of Cr and gastrin-17. Figure 1E–H shows that PGI and PGII increased with advancing age in patients of both sexes. Gastrin-17 levels were not linearly correlated with age; however, we found that gastrin-17 levels increase gradually with age in participants aged <70 years. Serum PGII levels were strongly correlated with PGI (r = 0.604) and the PGI/II ratio. Serum gastrin-17 levels were positively correlated with levels of PGI and PGII and negatively correlated with PGI/II ratio.
Relationship Between Gastric Biomarkers and the Transition of MetS Status
Next, we investigated whether gastric biomarkers were associated with the change of MetS status of 1032 MetS-negative individuals during 2 years of follow-up. In total, 19.28% (n=199) of MetS-negative individuals transitioned to MetS-positive, 80.72% (n=833) maintained MetS-negative status. As compared with participants in stable MetS-negative status, MetS-negative individuals who transitioned to MetS had higher levels of gastrin-17 [2.83 (1.49, 5.64) vs 1.80 (1.22, 3.35) pmol/L] (Table S5 and Figure 2). In males, the transition to MetS-positive group also had higher levels of gastrin-17 [2.96 (1.54, 5.81) vs 1.82 (1.26, 3.41) pmol/L]. In females, no significant differences were found in gastric biomarkers. The logistic regression analysis showed that gastrin-17 was independently associated with the risk of transition of MetS status in three adjustment models (Model 1: OR, 1.089; 95% CI, 1.037–1.144, P = 0.001; Model 2: OR, 1.131; 95% CI, 1.051–1.217, P = 0.001; Model 3: OR, 1.112; 95% CI, 1.028–1.203, P = 0.008). The similar results were shown in male participants but not in females (Model 1: OR, 1.090; 95% CI, 1.028–1.157, P = 0.004; Model 2: OR, 1.131; 95% CI, 1.048–1.220, P = 0.002; Model 3: OR, 1.111; 95% CI, 1.026–1.202, P = 0.009) (Table 2).
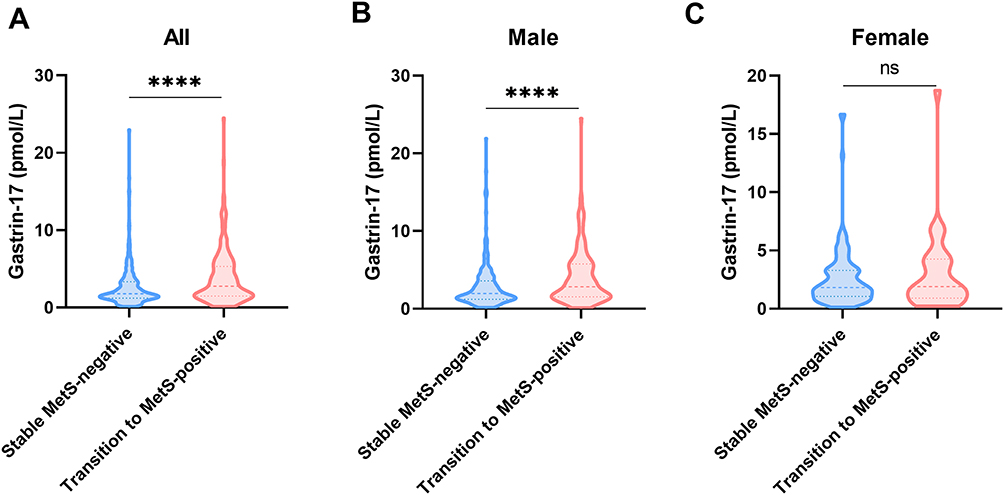 |
Figure 2 Comparisons of gastrin-17 in stable MetS-negative and transition to MetS-positive individuals. (A) Overall, serum levels of gastrin-17 in transition MetS group were higher than stable MetS-negative participants. (B) In males, serum levels of gastrin-17 in transition MetS group were also higher than stable MetS-negative participants. (C) In females, no significant difference was found in serum levels of gastrin-17. ****p < 0.0001. |
Discussion
Few studies have focused on the relationship between gastric biomarkers and MetS. This study represents the first extensive cross-sectional examination of the potential association between MetS and serum gastric biomarkers. Our findings reveal that individuals with MetS exhibit higher serum levels of gastrin-17 compared to those without MetS. This trend persisted in subgroup analyses differentiated by sex. Furthermore, logistic regression analysis indicated that elevated gastrin-17 levels were independently associated with an increased risk of MetS in all participants, as well as in males specifically. The follow-up study showed that transition from MetS-negative to MetS-positive was associated with higher levels of gastrin-17, especially in males, but not in females.
MetS is a multi-factorial disease that is associated with genetic, epigenetic, and environmental factors. Patients with MetS have an increased risk of ASCVD and all-cause mortality. Considerable research has focused on identifying biomarkers of MetS, including inflammatory markers and oxidative stress indicators, which are central to deciphering its complex pathophysiology and facilitating diagnosis.42,43 Importantly, chronic low-grade inflammation, a hallmark of MetS, is intricately linked to insulin resistance.44,45 The gastrointestinal tract and adipose tissue emerge as key sources of circulating inflammatory mediators and play pivotal roles in MetS development.20,46,47 Serum gastric biomarkers, such as PGs and gastrin-17, are instrumental in assessing gastric mucosal secretory function and are also regarded as markers of gastric inflammation.34 Non-invasive liquid gastric biopsy, represented by these gastric biomarkers, is minimally invasive, enables repeat sampling, and may be used to simultaneously evaluate the secretory function of gastric mucosa and diagnose pathological conditions, such as atrophic gastritis and MetS. Therefore, understanding the relationship between gastric biomarkers and MetS could also open new avenues for the diagnosis, management, and treatment of MetS.
In this study, among all participants, gastrin-17 was the only biomarker that showed a significant difference between MetS-positive and MetS-negative individuals. This observation was consistent in the multivariate logistic analysis. What is more, higher gastrin-17 levels were associated with the transition of MetS status and revealing gender difference. Gastrin is primarily produced and released by the G cells located in the gastric antrum as a result of various stimuli, including the ingestion of peptides and amino acids, gastric distention, and an increase in stomach pH.48,49 Once released into the bloodstream, gastrin acts on different tissues and organs, binding to its receptors and executing diverse functions. Although traditionally linked to digestive functions, recent research has identified the potential role of gastrin-17 in the pathogenesis of MetS. Gastrin-17 is associated with glucose metabolism and cardiovascular functions. Parenteral infusion of gastrin-17 increased blood glucose concentration and induced insulin secretion.50 Intracoronary gastrin-17 increased cardiac perfusion and function via cholecystokinin (CCK) receptors, β-adrenoceptors and nitric oxide release,51 while high levels of gastrin-17 may contribute to atherosclerotic process by influencing atherosclerotic parameters and blood pressure.51,52 Hyperglycemia can reduce basal and gastrin-stimulated gastric acid secretion, and changes in gastric pH can stimulate a compensatory increase in gastrin.53 Individuals with diabetes can display autonomic neuropathy, which is often accompanied by elevated levels of plasma gastrin.54,55 This increase may be attributable to a disrupted feedback mechanism caused by neuropathy in the stomach.56 Gastrin also plays a role in lipid metabolism, as seen in in vitro studies where gastrin peptides influenced triacylglycerol secretion in human Hep G2 cells.57 Additionally, gastrin receptors have been shown to interact with dopamine receptors, affecting blood pressure by modulating sodium excretion.58 The influence of gastrin on immunity and inflammation, particularly through cholecystokinin B/gastrin receptor-expressing leukocytes, highlights its broader physiological implications.59 Gastrin has been shown to induce cyclooxygenase-2 in GI cells via activate CCK-2 receptor and dependent on the MAPK signal pathways including ERK5 kinase, transactivation of the epidermal growth factor receptor, and the transcription factors ELK-1.60,61 Gastrin increases rolling leukocytes but reduces their rolling velocity and enhances their adhesion and emigration into interstitium by activation CCK-2.62 Besides, gastrin induces the interaction between human mononuclear leukocytes and endothelial cells by increasing endothelial expression of P-selectin and vascular cell adhesion molecule-1.63 Considering these roles and mechanisms mentioned above, gastrin may play a key role in the development of MetS. Given its role as a marker of gastric inflammation, the involvement of gastrin-17 in MetS could be through a state of chronic inflammation. Future research should focus on discerning whether changes in gastrin-17 levels in MetS are pathogenic, compensatory, or a combination of both, and on elucidating the underlying mechanisms.
Some factors may link serum gastric biomarkers with MetS, such as vascular risk factors, unhealthy life habits, and medication histories. The observed sexual dimorphism in this study could be attributable to the differing prevalence of vascular risk factors and unhealthy lifestyle habits between males and females. Gastrin is the principal hormone regulating gastric acid secretion, and long-term gastric hypoacidity due to treatment with PPIs or H2-receptor antagonists will lead to hypergastrinemia.64,65 Further, H. pylori infection is closely associated with elevated serum levels of PGs and gastrin-17.66 In our study, individuals with MetS had a higher incidence of H. pylori infection and medication history of PPIs or H2-receptor antagonists. Subsequent logistic regression analyses showed that gastrin-17 was associated with MetS independent of H. pylori infection and the administration of PPIs or H2 blockers. This observation suggests that gastrin-17 could serve as a reliable and stable biomarker for MetS, irrespective of these confounding factors.
PGI is secreted by the chief cells in the fundic glands, whereas PGII is secreted by both the fundic and pyloric glands.67 Univariate analysis stratified by sex revealed significant differences in PG levels and the PGI/PGII ratio between individuals with and without MetS. However, these differences were not observed after adjusting for confounding risk factors, suggesting that PG levels may not be independent predictors of MetS. Our study highlights the impact of both age and sex on PGs. Serum PGI and PGII levels are observed to increase progressively with age, a phenomenon potentially attributable to higher rates of H. pylori infection in older individuals.68,69 Owing to physiological atrophy and decreased gastric acid secretion ability in older adults, the stomach is in a prolonged low-acid environment, which to some extent hinders the transformation of PGInto pepsin, resulting in the accumulation of PGI and PGII levels.69 Of note, gastric biomarkers showed significant differences between males and females. The gastrin-17, PGI, and PGII levels and the PGI/PGII ratios were higher in males than in females, aligning with previous findings.70 Owing to longer histories of smoking and alcohol consumption, males are much more likely to have gastric inflammation than females. Therefore, the inflammatory indicators PGI and PGII also are generally higher in males. Gastrin-17, an unstable indicator, is affected by various factors, including geographical location, diet, hormonal status, and lifestyle habits. Differences in circulating sex hormone levels and lifestyle differences between females and males could contribute to the sexual dimorphism observed in gastrin-17 levels.71 Therefore, when utilizing PGs and gastrin as biomarkers for gastric diseases, the influence of age and sex must be considered. For clinical applications, establishing different normal reference values for various age groups and sexes is essential to accurately interpret these biomarkers.
In this study, levels of serum gastrin-17 were positively correlated with serum levels of PGI and PGII and negatively correlated with the PGI/PGII ratio. Clinically, the presence of antral atrophic gastritis may be suspected when gastrin levels are low, and the presence of atrophic gastritis of the corpus may be suspected when gastrin levels are high. When PGI levels and/or the PGI/PGII ratio are low, corpus atrophic gastritis may be present. Therefore, in disease states, gastrin-17 levels should be negatively correlated with serum levels of PGI levels and the PGI/PGII ratio and positively correlated with PGII levels. We assume that the inconsistencies between the anticipated results and our findings might be because of differences in the study population, because our population was relatively healthier than that of those examined in previous studies.
This study has certain limitations. Our participants were recruited from a single-center, hospital-based population instead of a natural population; therefore, there may be some sampling bias, and multicenter validation is required. Additionally, although we found correlations between gastric biomarkers and MetS, the direct or indirect effects of gastrin-17, at both physiological and pathological levels, on blood pressure, glucose, and lipid metabolism remain unclear. These mechanisms warrant further investigation in future studies.
Conclusions
Our research demonstrates gastrin-17 is correlated with MetS and also a potential biomarker for MetS, indicating the promising application of gastrin-17 in monitoring the transition of MetS. Besides, sexual dimorphism was observed in prevalence and transition of MetS associated with gastrin-17.
Data Sharing Statement
All data generated or analyzed during this study are included in this article. Further inquiries can be directed to the first author.
Statement of Ethics
Study protocol and consent forms were approved by the Ethics Committee of the Third Xiangya Hospital (I21102), with all procedures followed by the World Medical Association Declaration of Helsinki, and all essential permissions were obtained from the government and health commission. This study utilized a broad consent form, which was signed by each participant undergoing a physical examination prior to their examination. All personal information was anonymized during analysis and reporting to ensure confidentiality and privacy.
Acknowledgment
The authors gratefully acknowledge the voluntary participation of all study subjects.
Funding
This work was supported by funding from the National Natural Science Foundation of China (General Program) (No. 82303133); China Postdoctoral Science Foundation (No. 2022M723559); Natural Science Foundation of Hunan Province (No. 2020JJ5867); Natural Science Foundation of Hunan Province (No. 2021JJ40951); Natural Science Foundation of Hunan Province (No. 2022JJ30963); Project of Hunan Health Commission (No. B202307017799); and Project of Hunan Health Commission (No. B202309018525); National Natural Science Foundation of China (No. 82400873); Postdoctoral Fellowship Program (Grade B) of China Postdoctoral Science Foundation (No. GZB20240866).
Disclosure
The authors report no conflicts of interest in this work.
References
1. Fahed G, Aoun L, Bou Zerdan M, et al. Metabolic Syndrome: updates on Pathophysiology and Management in 2021. Int J Mol Sci. 2022;23(2). doi:10.3390/ijms23020786
2. Saklayen MG. The Global Epidemic of the Metabolic Syndrome. Curr Hypertens Rep. 2018;20(2):12. doi:10.1007/s11906-018-0812-z
3. Roomi MA, Mohammadnezhad M. Prevalence Of Metabolic Syndrome Among Apparently Healthy Workforce. J Ayub Med Coll Abbottabad. 2019;31(2):252–254.
4. Yao F, Bo Y, Zhao L, et al. Prevalence and Influencing Factors of Metabolic Syndrome among Adults in China from 2015 to 2017. Nutrients. 2021;13(12):4475. doi:10.3390/nu13124475
5. Li Y, Gui J, Liu H, et al. Predicting metabolic syndrome by obesity- and lipid-related indices in mid-aged and elderly Chinese: a population-based cross-sectional study. Front Endocrinol. 2023;14:1201132. doi:10.3389/fendo.2023.1201132
6. Pucci G, Alcidi R, Tap L, Battista F, Mattace-Raso F, Schillaci G. Sex- and gender-related prevalence, cardiovascular risk and therapeutic approach in metabolic syndrome: a review of the literature. Pharmacol Res. 2017;120:34–42. doi:10.1016/j.phrs.2017.03.008
7. Vishram JK, Borglykke A, Andreasen AH, et al. Impact of age and gender on the prevalence and prognostic importance of the metabolic syndrome and its components in Europeans. The MORGAM Prospective Cohort Project. PLoS One. 2014;9(9):e107294. doi:10.1371/journal.pone.0107294
8. Wang WS, Wahlqvist ML, Hsu CC, Chang HY, Chang WC, Chen CC. Age- and gender-specific population attributable risks of metabolic disorders on all-cause and cardiovascular mortality in Taiwan. BMC Public Health. 2012;12(1):111. doi:10.1186/1471-2458-12-111
9. Császár A, Kékes E, Abel T, Papp R, Kiss I, Balogh S. Prevalence of metabolic syndrome estimated by International Diabetes Federation criteria in a Hungarian population. Blood Press. 2006;15(2):101–106. doi:10.1080/08037050600772284
10. Alipour P, Azizi Z, Raparelli V, et al. Role of sex and gender-related variables in development of metabolic syndrome: a prospective cohort study. Eur J Intern Med. 2024;121:63–75. doi:10.1016/j.ejim.2023.10.006
11. Catrysse L, van Loo G. Inflammation and the Metabolic Syndrome: the Tissue-Specific Functions of NF-κB. Trends Cell Biol. 2017;27(6):417–429. doi:10.1016/j.tcb.2017.01.006
12. Saltiel AR, Olefsky JM. Inflammatory mechanisms linking obesity and metabolic disease. J Clin Invest. 2017;127(1):1–4. doi:10.1172/jci92035
13. Hasegawa Y, Saito T, Ogihara T, et al. Blockade of the nuclear factor-κB pathway in the endothelium prevents insulin resistance and prolongs life spans. Circulation. 2012;125(9):1122–1133. doi:10.1161/circulationaha.111.054346
14. Boura-Halfon S, Zick Y. Phosphorylation of IRS proteins, insulin action, and insulin resistance. Am J Physiol Endocrinol Metab. 2009;296(4):E581–91. doi:10.1152/ajpendo.90437.2008
15. Tanti JF, Jager J. Cellular mechanisms of insulin resistance: role of stress-regulated serine kinases and insulin receptor substrates (IRS) serine phosphorylation. Curr Opin Pharmacol. 2009;9(6):753–762. doi:10.1016/j.coph.2009.07.004
16. Weisberg SP, McCann D, Desai M, Rosenbaum M, Leibel RL, Ferrante AW. Obesity is associated with macrophage accumulation in adipose tissue. J Clin Invest. 2003;112(12):1796–1808. doi:10.1172/jci19246
17. Esser N, L’Homme L, De Roover A, et al. Obesity phenotype is related to NLRP3 inflammasome activity and immunological profile of visceral adipose tissue. Diabetologia. 2013;56(11):2487–2497. doi:10.1007/s00125-013-3023-9
18. Cai D, Yuan M, Frantz DF, et al. Local and systemic insulin resistance resulting from hepatic activation of IKK-beta and NF-kappaB. Nat Med. 2005;11(2):183–190. doi:10.1038/nm1166
19. Huang W, Metlakunta A, Dedousis N, et al. Depletion of liver Kupffer cells prevents the development of diet-induced hepatic steatosis and insulin resistance. Diabetes. 2010;59(2):347–357. doi:10.2337/db09-0016
20. Chen H, Zheng X, Zong X, et al. Metabolic syndrome, metabolic comorbid conditions and risk of early-onset colorectal cancer. Gut. 2021;70(6):1147–1154. doi:10.1136/gutjnl-2020-321661
21. Azami M, Baradaran HR, Dehghanbanadaki H, et al. Association of Helicobacter pylori infection with the risk of metabolic syndrome and insulin resistance: an updated systematic review and meta-analysis. Diabetol Metab Syndr. 2021;13(1):145. doi:10.1186/s13098-021-00765-x
22. Vijayvergiya R, Vadivelu R. Role of Helicobacter pylori infection in pathogenesis of atherosclerosis. World J Cardiol. 2015;7(3):134–143. doi:10.4330/wjc.v7.i3.134
23. Shi H, Li Y, Dong C, et al. Helicobacter pylori infection and the progression of atherosclerosis: a systematic review and meta-analysis. Helicobacter. 2022;27(1):e12865. doi:10.1111/hel.12865
24. Jeon CY, Haan MN, Cheng C, et al. Helicobacter pylori Infection Is Associated With an Increased Rate of Diabetes. Diabetes Care. 2012;35(3):520–525. doi:10.2337/dc11-1043
25. Polyzos SA, Kountouras J, Zavos C. Nonalcoholic fatty liver disease: the pathogenetic roles of insulin resistance and adipocytokines. Curr Mol Med. 2009;9(3):299–314. doi:10.2174/156652409787847191
26. Osawa H, Nakazato M, Date Y, et al. Impaired production of gastric ghrelin in chronic gastritis associated with Helicobacter pylori. J Clin Endocrinol Metab. 2005;90(1):10–16. doi:10.1210/jc.2004-1330
27. Roper J, Francois F, Shue PL, et al. Leptin and ghrelin in relation to Helicobacter pylori status in adult males. J Clin Endocrinol Metab. 2008;93(6):2350–2357. doi:10.1210/jc.2007-2057
28. Peng Y, Lei X, Yang Q, et al. Helicobacter pylori CagA-mediated ether lipid biosynthesis promotes ferroptosis susceptibility in gastric cancer. Exp Mol Med. 2024;56(2):441–452. doi:10.1038/s12276-024-01167-5
29. Oshima T, Ozono R, Yano Y, et al. Association of Helicobacter pylori infection with systemic inflammation and endothelial dysfunction in healthy male subjects. J Am Coll Cardiol. 2005;45(8):1219–1222. doi:10.1016/j.jacc.2005.01.019
30. Hoffmeister A, Rothenbacher D, Bode G, et al. Current infection with Helicobacter pylori, but not seropositivity to Chlamydia pneumoniae or cytomegalovirus, is associated with an atherogenic, modified lipid profile. Arterioscler Thromb Vasc Biol. 2001;21(3):427–432. doi:10.1161/01.atv.21.3.427
31. Murray LJ, Bamford KB, O’Reilly DP, McCrum EE, Evans AE. Helicobacter pylori infection: relation with cardiovascular risk factors, ischaemic heart disease, and social class. Br Heart J. 1995;74(5):497–501. doi:10.1136/hrt.74.5.497
32. Niemelä S, Karttunen T, Korhonen T, et al. Could Helicobacter pylori infection increase the risk of coronary heart disease by modifying serum lipid concentrations? Heart. 1996;75(6):573–575. doi:10.1136/hrt.75.6.573
33. Sipponen P, Laxén F, Huotari K, Härkönen M. Prevalence of low vitamin B12 and high homocysteine in serum in an elderly male population: association with atrophic gastritis and Helicobacter pylori infection. Scand J Gastroenterol. 2003;38(12):1209–1216. doi:10.1080/00365520310007224
34. Dottori L, Pivetta G, Annibale B, Lahner E. Update on Serum Biomarkers in Autoimmune Atrophic Gastritis. Clin Chem. 2023;69(10):1114–1131. doi:10.1093/clinchem/hvad082
35. Xu W, Yang B, Lin S, et al. Sex-specific disparities of serum pepsinogen I in relation to body mass index. Clin Chem Lab Med. 2023;61(11):2010–2016. doi:10.1515/cclm-2023-0236
36. Zhang L, Chen Z, Xia X, et al. Helicobacter pylori infection selectively increases the risk for carotid atherosclerosis in young males. Atherosclerosis. 2019;291:71–77. doi:10.1016/j.atherosclerosis.2019.10.005
37. Shan JH, Bai XJ, Han LL, Yuan Y, Sun XF. Changes with aging in gastric biomarkers levels and in biochemical factors associated with Helicobacter pylori infection in asymptomatic Chinese population. World J Gastroenterol. 2017;23(32):5945–5953. doi:10.3748/wjg.v23.i32.5945
38. Gunawardhana N, Jang S, Choi YH, et al. Helicobacter pylori-Induced HB-EGF Upregulates Gastrin Expression via the EGF Receptor, C-Raf, Mek1, and Erk2 in the MAPK Pathway. Front Cell Infect Microbiol. 2017;7:541. doi:10.3389/fcimb.2017.00541
39. Malfertheiner P, Kandulski A, Venerito M. Proton-pump inhibitors: understanding the complications and risks. Nat Rev Gastroenterol Hepatol. 2017;14(12):697–710. doi:10.1038/nrgastro.2017.117
40. Liou JM, Jiang XT, Chen CC, et al. Second-line levofloxacin-based quadruple therapy versus bismuth-based quadruple therapy for Helicobacter pylori eradication and long-term changes to the gut microbiota and antibiotic resistome: a multicentre, open-label, randomised controlled trial. Lancet Gastroenterol Hepatol. 2023;8(3):228–241. doi:10.1016/s2468-1253(22)00384-3
41. Alberti KG, Zimmet P, Shaw J. The metabolic syndrome--a new worldwide definition. Lancet. 2005;366(9491):1059–1062. doi:10.1016/s0140-6736(05)67402-8
42. van der Hoef CCS, Boorsma EM, Emmens JE, et al. Biomarker signature and pathophysiological pathways in patients with chronic heart failure and metabolic syndrome. Eur J Heart Fail. 2023;25(2):163–173. doi:10.1002/ejhf.2760
43. Bekyarova GY, Vankova DG, Madjova VH, et al. Association between Nfr2, HO-1, NF-kB Expression, Plasma ADMA, and Oxidative Stress in Metabolic Syndrome. Int J Mol Sci. 2023;24(23):17067. doi:10.3390/ijms242317067
44. Mir FA, Abdesselem HB, Cyprian F, et al. Inflammatory protein signatures in individuals with obesity and metabolic syndrome. Sci Rep. 2023;13(1):22185. doi:10.1038/s41598-023-49643-8
45. Pan Y, Cao S, Tang J, et al. Cyclooxygenase-2 in adipose tissue macrophages limits adipose tissue dysfunction in obese mice. J Clin Invest. 2022;132(9). doi:10.1172/jci152391
46. Villarroya F, Cereijo R, Gavaldà-Navarro A, Villarroya J, Giralt M. Inflammation of brown/beige adipose tissues in obesity and metabolic disease. J Intern Med. 2018;284(5):492–504. doi:10.1111/joim.12803
47. Aramouni K, Assaf RK, Azar M, et al. Infection with Helicobacter pylori may predispose to atherosclerosis: role of inflammation and thickening of intima-media of carotid arteries. Front Pharmacol. 2023;14:1285754. doi:10.3389/fphar.2023.1285754
48. Rehfeld JF. Gastrin and the Moderate Hypergastrinemias. Int J Mol Sci. 2021;22(13):6977. doi:10.3390/ijms22136977
49. Xu R, Höß C, Swiercz JM, et al. A semaphorin-plexin-Rasal1 signaling pathway inhibits gastrin expression and protects against peptic ulcers. Sci Transl Med. 2022;14(654):eabf1922. doi:10.1126/scitranslmed.abf1922
50. Rehfeld JF. Disturbed islet-cell function related to endogenous gastrin release. Studies on insulin secretion and glucose tolerance in pernicious anemia. J Clin Invest. 1976;58(1):41–49. doi:10.1172/jci108457
51. Grossini E, Caimmi P, Molinari C, Uberti F, Mary D, Vacca G. Intracoronary gastrin 17 increases cardiac perfusion and function through autonomic nervous system, CCK receptors, and nitric oxide in anesthetized pigs. J Appl Physiol. 2011;110(1):95–108. doi:10.1152/japplphysiol.00625.2010
52. Shan J, Bai X, Han L, Yuan Y, Yang J, Sun X. Association between atherosclerosis and gastric biomarkers concerning Helicobacter pylori infection in a Chinese healthy population. Exp Gerontol. 2018;112:97–102. doi:10.1016/j.exger.2018.09.009
53. Jalleh RJ, Jones KL, Rayner CK, Marathe CS, Wu T, Horowitz M. Normal and disordered gastric emptying in diabetes: recent insights into (patho)physiology, management and impact on glycaemic control. Diabetologia. 2022;65(12):1981–1993. doi:10.1007/s00125-022-05796-1
54. Steyaert W, Varney MJ, Benovic JL, et al. Hypergastrinemia, a clue leading to the identification of an atypical form of diabetes mellitus type 2. Clin Chim Acta. 2022;532:79–83. doi:10.1016/j.cca.2022.05.016
55. Singh PK, Hota D, Dutta P, et al. Pantoprazole improves glycemic control in type 2 diabetes: a randomized, double-blind, placebo-controlled trial. J Clin Endocrinol Metab. 2012;97(11):E2105–8. doi:10.1210/jc.2012-1720
56. Borg J, Melander O, Johansson L, Uvnäs-Moberg K, Rehfeld JF, Ohlsson B. Gastroparesis is associated with oxytocin deficiency, oesophageal dysmotility with hyperCCKemia, and autonomic neuropathy with hypergastrinemia. BMC Gastroenterol. 2009;9:17. doi:10.1186/1471-230x-9-17
57. Lindholm M, Eklund A. Inhibitory effect of gastrin peptides on triacylglycerol secretion in Hep G2 cells. Eur J Gastroenterol Hepatol. 1996;8(4):393–398. doi:10.1097/00042737-199604000-00019
58. Jiang X, Zhang Y, Yang Y, et al. Gastrin stimulates renal dopamine production by increasing the renal tubular uptake of l-DOPA. Am J Physiol Endocrinol Metab. 2017;312(1):E1–e10. doi:10.1152/ajpendo.00116.2016
59. Chao C, Hellmich MR. Gastrin, inflammation, and carcinogenesis. Curr Opin Endocrinol Diabetes Obes. 2010;17(1):33–39. doi:10.1097/MED.0b013e328333faf8
60. Abdalla SI, Lao-Sirieix P, Novelli MR, Lovat LB, Sanderson IR, Fitzgerald RC. Gastrin-induced cyclooxygenase-2 expression in Barrett’s carcinogenesis. Clin Cancer Res. 2004;10(14):4784–4792. doi:10.1158/1078-0432.Ccr-04-0015
61. Guo YS, Cheng JZ, Jin GF, Gutkind JS, Hellmich MR, Townsend CM. Gastrin stimulates cyclooxygenase-2 expression in intestinal epithelial cells through multiple signaling pathways. Evidence for involvement of ERK5 kinase and transactivation of the epidermal growth factor receptor. J Biol Chem. 2002;277(50):48755–48763. doi:10.1074/jbc.M209016200
62. Alvarez A, Ibiza S, Hernández C, Alvarez-Barrientos A, Esplugues JV, Calatayud S. Gastrin induces leukocyte-endothelial cell interactions in vivo and contributes to the inflammation caused by Helicobacter pylori. THE FASEB Journal. 2006;20(13):2396–2398. doi:10.1096/fj.05-5696fje
63. Ibiza S, Alvarez A, Romero W, Barrachina MD, Esplugues JV, Calatayud S. Gastrin induces the interaction between human mononuclear leukocytes and endothelial cells through the endothelial expression of P-selectin and VCAM-1. Am J Physiol Cell Physiol. 2009;297(6):C1588–95. doi:10.1152/ajpcell.00082.2009
64. da Mata A, Paz M, de Menezes APM, et al. Evaluation of mutagenesis, necrosis and apoptosis induced by omeprazole in stomach cells of patients with gastritis. Cancer Cell Int. 2022;22(1):154. doi:10.1186/s12935-022-02563-5
65. Helgadottir H, Bjornsson ES. Problems Associated with Deprescribing of Proton Pump Inhibitors. Int J Mol Sci. 2019;20(21):5469. doi:10.3390/ijms20215469
66. Zhou JP, Liu CH, Liu BW, et al. Association of serum pepsinogens and gastrin-17 with Helicobacter pylori infection assessed by urea breath test. Front Cell Infect Microbiol. 2022;12:980399. doi:10.3389/fcimb.2022.980399
67. Gritti I, Banfi G, Roi GS. Pepsinogens: physiology, pharmacology pathophysiology and exercise. Pharmacol Res. 2000;41(3):265–281. doi:10.1006/phrs.1999.0586
68. Veenendaal RA, Biemond I, Peña AS, van Duijn W, Kreuning J, Lamers CB. Influence of age and Helicobacter pylori infection on serum pepsinogens in healthy blood transfusion donors. Gut. 1992;33(4):452–455. doi:10.1136/gut.33.4.452
69. Goldschmiedt M, Barnett CC, Schwarz BE, Karnes WE, Redfern JS, Feldman M. Effect of age on gastric acid secretion and serum gastrin concentrations in healthy men and women. Gastroenterology. 1991;101(4):977–990. doi:10.1016/0016-5085(91)90724-y
70. Huang RG, Xiao HL, Zhou B, et al. Serum Pepsinogen Levels Are Correlated With Age, Sex and the Level of Helicobacter pylori Infection in Healthy Individuals. Am J Med Sci. 2016;352(5):481–486. doi:10.1016/j.amjms.2016.08.005
71. Feldman M, Richardson CT, Walsh JH. Sex-related differences in gastrin release and parietal cell sensitivity to gastrin in healthy human beings. J Clin Invest. 1983;71(3):715–720. doi:10.1172/jci110818
 © 2024 The Author(s). This work is published and licensed by Dove Medical Press Limited. The
full terms of this license are available at https://www.dovepress.com/terms.php
and incorporate the Creative Commons Attribution
- Non Commercial (unported, 3.0) License.
By accessing the work you hereby accept the Terms. Non-commercial uses of the work are permitted
without any further permission from Dove Medical Press Limited, provided the work is properly
attributed. For permission for commercial use of this work, please see paragraphs 4.2 and 5 of our Terms.
© 2024 The Author(s). This work is published and licensed by Dove Medical Press Limited. The
full terms of this license are available at https://www.dovepress.com/terms.php
and incorporate the Creative Commons Attribution
- Non Commercial (unported, 3.0) License.
By accessing the work you hereby accept the Terms. Non-commercial uses of the work are permitted
without any further permission from Dove Medical Press Limited, provided the work is properly
attributed. For permission for commercial use of this work, please see paragraphs 4.2 and 5 of our Terms.