")
Back to Journals » Journal of Inflammation Research » Volume 17
The Mechanism by Which Hedgehog Interacting Protein (HHIP) in Cancer-Associated Fibroblasts Regulate the Secretion of Inflammatory Factors Through the JAK1/STAT3 Pathway Affecting Prostate Cancer Stemness
Authors Wo Q, Shi L, Shi J, Mao Y, Xie L
Received 3 April 2024
Accepted for publication 26 October 2024
Published 11 November 2024 Volume 2024:17 Pages 8659—8680
DOI https://doi.org/10.2147/JIR.S472124
Checked for plagiarism Yes
Review by Single anonymous peer review
Peer reviewer comments 5
Editor who approved publication: Dr Tara Strutt
Qijun Wo,1 Lei Shi,2 Jun Shi,3 Yeqing Mao,4 Liping Xie4
1Urology & Nephrology Center, Department of Urology, Zhejiang Provincial People’s Hospital (Affiliated People’s Hospital), Hangzhou Medical College, Hangzhou, Zhejiang, People’s Republic of China; 2Cancer Center, Department of Radiation Oncology, Zhejiang Provincial People’s Hospital (Affiliated People’s Hospital), Hangzhou Medical College, Hangzhou, Zhejiang, People’s Republic of China; 3Department of Urology,The Second People’s Hospital of Fuyang, Hangzhou, Zhejiang, People’s Republic of China; 4Department of Urology, The First Affiliated Hospital, Zhejiang University School of Medicine, Hangzhou, Zhejiang, People’s Republic of China
Correspondence: Liping Xie, Department of Urology, the First Affiliated Hospital, Zhejiang University School of Medicine, Hangzhou, Zhejiang, 310003, People’s Republic of China, Email [email protected]
Purpose: Prostate cancer (PCa) is seriously affecting men’s health and quality of life. Existing studies indicate that PCa stem cells are responsible for promoting the growth and contributing to the high recurrence rate of PCa.
Methods: We retrieved and downloaded PCa-related datasets from both the GEO and TCGA database. These datasets were subsequently analyzed using single-cell analysis, difference analysis, WGCNA, and machine learning algorithms. WB was performed to detect the expression of Hedgehog interacting protein (HHIP), JAK1/STAT3 pathway-related protein, CD133 and CD44. Immunohistochemistry was conducted to assess the distribution of HHIP and Ki67. The levels of inflammatory factors were measured using ELISA. The tumor cell stemness was evaluated through spheroid formation assay and flow cytometry.
Results: Through bioinformatics analysis, we identified eight genes (ARHGAP24, HHIP, MITF, CBX7, PPP1R12B, PLEKHA1, ADGRA2, and PGR). Among these genes, we selected HHIP for follow-up experiments and confirmed its low expression in PCa tumor tissues. Primary cancer-associated fibroblasts (CAFs) were extracted, and to further explore the mechanism of HHIP, we overexpressed or knocked down HHIP in CAFs. Overexpression of HHIP was found to inhibit the JAK1/STAT3 pathway and the secretion of inflammatory factors, thus suppressing both the proliferation and stemness of PCa cells. Treatment of CAFs with the JAK1/STAT3 pathway inhibitor AG490 led to a decrease in inflammatory factor secretion, along with inhibition of PCa cell proliferation and stemness. On this basis, knockdown of HHIP partially reversed the inhibitory effects of AG490 on PCa cells. Finally, we constructed a mouse subcutaneous tumor model and found that HHIP inhibited tumor proliferation and densification.
Conclusion: In summary, HHIP in CAFs can regulate the JAK1/STAT3 pathway and affect the secretion of inflammatory factors, thus affecting the proliferation of PCa.
Keywords: prostate cancer, single-cell analysis, Hedgehog interacting protein, JAK1/STAT3 pathway, cancer stemness
Corrigendum for this paper has been published.
Introduction
Prostate Cancer (PCa) is the second leading cause of cancer-related mortality in men,1 particularly in regions such as Australia, Northern and Western Europe, and the United States.2 While the incidence and mortality of PCa are now lower in China compared to European and American countries, it is important to recognize the rapidly increasing incidence of PCa in China due to an aging population and changing lifestyles.3 Currently, the primary treatments for PCa include androgen deprivation therapy and surgery,4–6 both of which have shown relatively favorable clinical outcomes in early-stage PCa. However, in advanced-stage PCa, androgen resistance often develops following androgen deprivation therapy, even leading to the progression of castration-resistant prostate cancer (CRPC), which is associated with a heavy economic burden and poor prognosis for many patients.7 Therefore, it is imperative to investigate the fundamental mechanisms of tumor growth in order to decrease the death rate among patients with PCa.
Composed of multiple subtypes, fibroblasts are heterogeneous cells that affect immune cell infiltration within the tumor microenvironment (TME), either promoting or inhibiting tumor growth.8 Multiple studies have demonstrated the important role of cancer-associated fibroblasts (CAFs) in promoting the progression and metastasis of various cancers, including PCa.9,10 CAFs contribute to the malignant progression of PCa primarily through two modes of cellular communication: contact dependence and paracrine.10 Moreover, single-cell sequencing data have revealed that CCL2 produced by CAFs may participate in the recruitment of inflammatory cells, while also potentially directly regulating tumor growth.11 Therefore, it is necessary to investigate the interplay between PCa cells and CAFs in the TME, elucidate the impact of CAFs on tumor proliferation, and identify therapeutic targets for the clinical management of PCa.
In this study, through key gene screening in PCa-related single-cell and batch datasets, we identified PPP1R12B and HHIP as key genes associated with PCa progression in fibroblasts. While HHIP has been shown to play a role in gastric cancer,12 melanoma13 and other cancers, its involvement in PCa has not been investigated. Therefore, we selected HHIP for a detailed mechanistic investigation to examine how it regulates tumor proliferation at both the animal and cellular levels. The goal of this study is to identify additional potential therapeutic targets for PCa through bioinformatics analysis.
Materials and Methods
Single-Cell Analysis
The PCa-related single-cell dataset GSE193337 was obtained from the GEO database, comprising four tumor and four benign samples. We analyzed this dataset using the “Seurat” (v 4.3.0.1) applying data filtering criteria of 200 < nFeature_RNA < 9000 and percent.mt < 25. Subsequently, we used the “harmony” (v 0.1.1) for batch correction of the samples. Following the removal of batch effects, we annotated the cells using the “SingleR” package (v 2.0.0) based on the methods described in relevant literature.14,15 Finally, by setting |log2FC| > 0.5 and adj.p-val < 0.05 as criteria, differentially expressed genes (DEGs) were screened among fibroblasts. Then, we used the “CellChat” package (v 1.6.1) to analyze intercellular communication on the single-cell dataset against the “Cell-Cell Contact” database.
Wgcna
We used the “TCGAbiolinks” (v 2.28.4) to download the PCa-related bulk dataset, which included 496 tumor and 52 paracancer samples, from TCGA database. We performed sample clustering on the dataset, calculated the correlation of gene expression in the dataset, carried out sub-scale operations, set the soft threshold to 18 (R2 = 0.85), built a scale-free network, and constructed the differential genes into an adjacency matrix with R2 = 0.85, which was then transformed into a topological overlap matrix.
Difference Analysis
We used “limma” (v 3.56.2) to perform differential analysis in the dataset. DEGs were identified using |log2FC| > 0.5 and adj.p-val < 0.05 as screening criteria. “VennDiagram” package was applied to draw the Wayne Diagram. Gene Ontology (GO) functional enrichment analysis was conducted using the DAVID database.
Disease Subtype Analysis
We first used the “cluster” package (v 2.1.4) to perform K-means clustering on the cancer samples, and subsequently the “factoextra” package (v 1.0.7) to PCA to test the clustering results. Finally, “GSVA” package (v 1.48.3) was used to calculate the GSVA values of inflammasome-related genes (see Supplementary Box 1) and inflammatory response-related genes (see Supplementary Box 2) to evaluate the inflammation levels of samples in each group.
Machine Learning Algorithms
Used “glmnet” package (v 4.1) to perform LASSO and “e1071” package (v 1.7.13) to conduct SVM-RFE analysis for the screening of key genes.
Correlation Analysis
Correlation analysis was conducted using the R programming language. The “fmsb” package (v 0.7.5) was used to visualize the correlation between genes and inflammation-related indices, and the “ggplot2” package (v 3.4.4) was used to illustrate the correlation.
CIBERSORT Analysis
We used CIBERSORTx for CIBERSORT analysis on the TCGA dataset. The rank-sum test in the “ggpubr” package (v 0.6.0) was used to analyze differences in immune infiltration scores among the 22 classes of immune cells between groups.
Gsva
We used the “clusterProfiler” (v 4.8.3) to conduct functional enrichment analysis of individual genes.
Collection of Clinical Samples
We collected 20 freshly frozen human PCa tissues and para-cancer tissues. Each sample was evaluated by two experienced uropathologists. None of the patients had received anti-tumor therapy prior to surgery. A portion of the collected clinical samples was used for immunohistochemistry (IHC) detection, while the remaining samples were used for fibroblast isolation.
In vivo Xenograft Assay
4–5 weeks old male BALB/c nude mice were randomly divided into three groups: PC3+CAF, PC3+CAF+oe-NC, and PC3+CAF+oe-HHIP, with six mice per group. The mice were kept under alternating 12 h light/dark cycles at a humidity of 58±8% and a temperature of 23±2°C in a pathogen-free environment, with unrestricted access to water and food. Each mouse was subcutaneously injected in the right axilla with 2×10⁶ PC3 cells mixed with an equal number of CAFs. The tumors were excised, weighed, and preserved for subsequent studies.
Ihc
Clinical samples and mouse tumor tissues were fixed, embedded in paraffin, and sectioned, followed by antigen repair, serum sealing, antibody incubation, and color development (stained by diaminobenzidine complex, with the nuclei counterstained with haematoxylin). Tissue sections were incubated with HHIP (Invitrogen, HL1969) or Ki67 (Invitrogen, MA5-14520) antibodies for 12 h at 4°C.
Hematoxylin-Eosin (HE) Staining
The tissue slices were roasted for 2 h at 60°C and allowed to cool naturally before dewaxing. The dried slices were soaked in dimethylbenzene solution for 15 min and subsequently dried naturally, which was a process repeated three times. Subsequently, the slices were successively soaked in 100%, 95%, 85%, and 75% ethanol solutions for 5 min each, followed by rinsing with distilled water for 5 min. Next, the slices were stained with hematoxylin (Beyotime, C0105M), for 5 min, rinsed with distilled water to remove excess dye, and washed with phosphate-buffered saline to restore the blue color. The sections were then stained with eosin for 1 s, followed by an immediate rinse with distilled water. After two rounds of staining, the slices were dried using a baking machine, cut, soaked in xylene solution for 10 min, and dried naturally.
Cell Culture
The human PCa cells PC3 (CL-0185) and DU145 (CL-0075) used in this study were purchased from Pricella. PC3 cells were cultured in Ham’s F-12K (PM150910) medium containing 10% fetal bovine serum (FBS) (164,210–50) and 1% penicillin-streptomycin (P/S) (PB180120). DU145 cells were cultured in NEAA-containing MEM (PM150410) medium containing 10% FBS and 1% P/S. All cells were cultured in an incubator containing 5% CO2 at 37°C.
Isolation of Primary Fibroblasts16
PCa and para-cancer tissues were cut into small pieces (2–3 mm3) and cultured in DMEM supplemented with 10% FBS. Once the fibroblasts began to grow from the tissue block, the tissue was removed and the cells were cultured as regular monolayer cultures. All primary fibroblasts used in the study were within 8 generations. Finally, we detected the expression of α-SMA to confirm that the extracted cells were indeed fibroblasts.
Overexpression or Interference with HHIP
We inoculated fibroblasts in 12-well plates at a density of 1.2×10⁵ cells/well. After the cells were attached to the wall, adenovirus packaged with HHIP (Sangon Biotech) was added, and the cells were cultured for 24 h. Then, the cells were incubated in DMEM for 12 h, and oe-NC was constructed as a control. Additionally, we also inoculated fibroblasts into 12-well plates at a density of 1.2×10⁵ cells/well and cultured them with jetPRIME® transfection reagent (Polyplus, 101000001) and siRNA oligonucleotides of HHIP (Sangon Biotech) for 6 h. After incubation with DMEM for 24 h, si-NC was constructed as a negative control. siHHIP: AGUUACUGGAGGAAAUCAATT, si-NC: UUCUCCGAACGUGUCACGUTT.
Collection Conditioned Medium
We inoculated fibroblasts in 10 cm petri dish at a density of 2×10⁶ cells/dish. After culture for 12 h, the medium was removed, and 8 mL of serum-free medium was added. The cells were then continually cultured for 36 h, after which the medium was collected and centrifuged at 1000 g for 10 min. Next, the medium was filtered with a 0.2 μm sterile filter to ensure the removal of cells and cell debris, and finally stored at −20°C for subsequent experiments.
Wb
We extracted total proteins from tissues or cells with lysate containing 1% protease inhibitor. Following quantification, the samples underwent electrophoresis, membrane transfer, antibody incubation, and color development. The following antibodies were used in this study: HHIP (Invitrogen, PA5-115355), E-cadherin (Invitrogen, 14–3249-82), vimentin (Invitrogen, PA5-27231), α-SMA (cell signaling technology, CST, 19245), p-JAK1 (CST, 3331), JAK1 (CST, 3332), p-JAK2 (CST, 3771), JAK2 (CST, 3230), STAT1 (CST, 9172), p-STAT1 (CST, 9167), STAT3 (CST, 30835), p-STAT3 (CST, 9145), CD44 (CST, 37259), and CD133 (CST, 64326). GAPDH (Invitrogen, PA1-988) was selected as the internal reference protein.
Immunofluorescence (IF)
We inoculated 1×10⁶ cells into 24 mm sterile cell slides and placed them in a 6-well plate. Once the cells attached to the wall, they were fixed with 4% formaldehyde, sealed with blocking buffer, and incubated with antibodies. DAPI was finally added to stain the nucleus. After sealing, the cells were observed under a confocal laser microscope. The primary antibodies used in this study included HHIP (Invitrogen, PA5-115355), E-cadherin (Invitrogen, 14–3249-82), vimentin (Invitrogen, PA5-27231), and α-SMA (CST, 19245).
Elisa
The secretion levels of the corresponding proteins in the cell supernatant were detected according to the instructions provided by IL-6 ELISA Kit (Beyotime, PI325), TGF-β ELISA Kit (Beyotime, PT880), and IL-1β ELISA Kit (Beyotime, PI305).
Cck8
Cells were inoculated into 12-well plates (6000 cells/well) and cultured for 48 h. 10 µL of CCK8 reagent (Beyotime, C0037) was added and the cells were incubated in a 37°C incubator for 2 h. The detection area was selected and the wavelength of the enzyme labeler was set at 450 nm to measure the value of optical density for the evaluation of cell activity.
EdU
Cells were inoculated into 12-well plates (6000 cells/well) and cultured overnight to restore them to a normal state. Thereafter, 2×EdU working solution (Beyotime, C0071S) was added, and the cells were incubated in a 37°C incubator for 2 h. Next, 1 mL of fixing solution was added for 15 min. Afterwards, the click reaction solution was added and incubated for 30 min.
Clone Formation
A total of 1000 cells were inoculated in 6-well plates and cultured until the majority of the monoclonal clones contained more than 50 cells. After washing, the cells were fixed with 1 mL of 4% paraformaldehyde for 30 min, followed by the addition of 1 mL of crystal violet staining solution for 10 min. Finally, the cells were washed, dried, and photographed.
Scratch Wound Healing Assay
Monolayered adherent cells were cultured in vitro. A trace gun was used to mark the central region of cell growth. The marked area was then removed, and the cells were cultured in serum-free medium. The cell culture plate was subsequently removed, and the surrounding cells were observed under a microscope to determine whether they migrated to the central scratch area.
Transwell
The Matrigel matrix glue was applied to the bottom of the 24-well Transwell chamber. After solidification, 100 μL of cell suspension was added to the upper compartment, and the medium was added to the lower chamber. Following routine culture in the cell incubator for 24 h, the number of cells in the visual field was observed.
Spheroid Formation Assay
The cells were digested with trypsin, counted, and then cultured in ultra-low adsorption 96-well plates at a density of 200 cells per well, with 2 mL medium (containing 20 ng/mL EGF, 10 ng/mL bFGF, and 2% B27 serum-free DMEM/F12 (Pricella, PM150312)) per well. After a 14-day culture period, the size and number of cells were observed and counted (spheroids with the diameter > 50 μm).
The Stemness of Tumor Cells Determined by Flow Cytometry
We collected 1×10⁶ cancer cells and incubated them with CD133 antibodies (Invitrogen, 11–1339-41) at 4°C for 20 min. The cells were then re-suspended in 500 µL binding buffer and analyzed using flow cytometry.
Statistical Analysis
Statistical analysis was carried out using the R programming language for the bioinformatics section, and the IBM SPSS Statistics software for the experimental section. GraphPad Prism 9 was used to draw bar charts. Measurement data were expressed as mean ± standard deviation ( ±SD). T-test was used to detect the differences between two groups of samples. P < 0.05 was considered to be statistically significant.
Results
Single-Cell Analysis
We analyzed single-cell data from the GSE193337, screening out a total of 24,375 genes and 27,794 cells. Based on the genetic composition of the cells and the trend of gene expression, we categorized the cells into 20 clusters (Figure 1A). Subsequently, following cell annotation, we identified eight types of cells: CD8+ T cells, epithelial cells, CD4+ T cells, endothelial cells, patient specific cells (characterized by significant differences in cell counts between cancer and para-cancer samples), B cells, mast cells, and fibroblasts (Figure 1B). We further visualized the distribution and proportion of each type of cells in each sample and in each group (Figure 1C and Supplementary Figure 1A-C), revealing significant differences in fibroblasts between groups. We screened out 68 DEGs in the fibroblasts (Figure 1D). Cell-cell communication analysis revealed a total of 495 interaction pairs among the eight identified types of cells in the dataset (Figure 2A). As signal exporters, fibroblasts were found to potentially communicate with CD4+ T cells, patient specific cells, endothelial cells, and B cells through APP-CD74 in the APP signaling pathway (Figure 2B and D–F). However, when functioning as signal receivers, Fibroblasts were shown to potentially communicate with mast cells, CD8+ T cells, fibroblasts, CD4+ T cells, endothelial cells, epithelial cells, and patient specific cells through CD99-CD99 in the CD99 signaling pathway (Figure 2C and G-I).
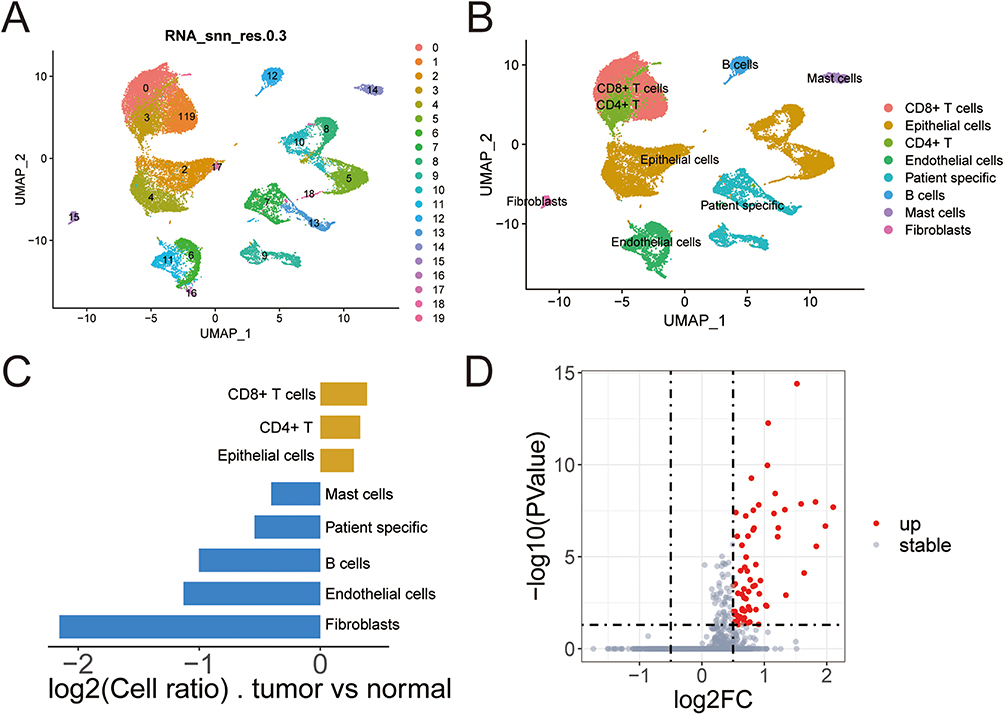 |
Figure 1 Single-cell analysis. (A) Dimensionality reduction diagram of cell clustering; (B) Dimensionality reduction diagram of cell annotation; (C) The proportion of cells between groups; (D) Volcano map of DEGs in fibroblasts. |
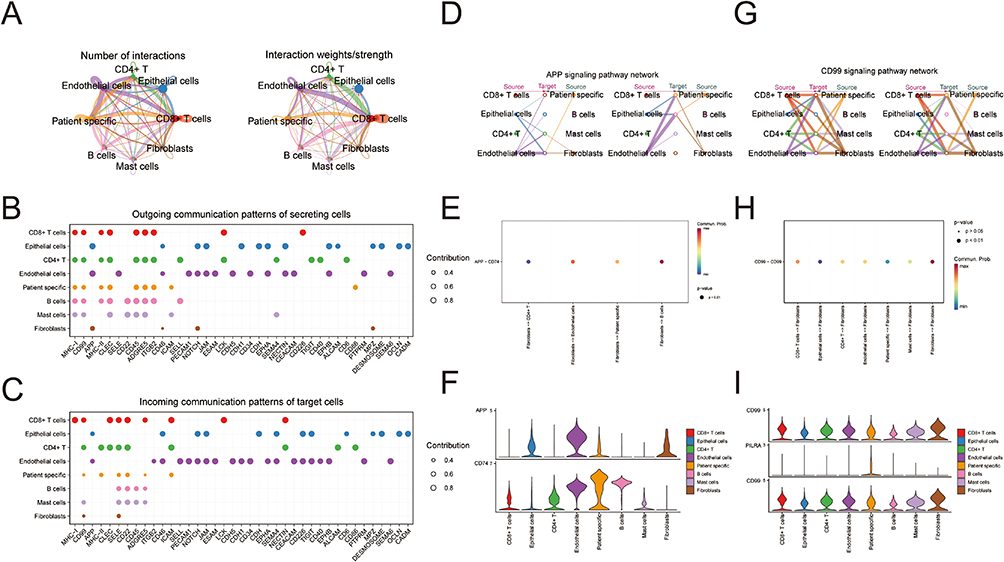 |
Figure 2 Cell communication analysis. (A) The number of interactions and communication strength between cells; (B) A pathway through which cells communicate with other cells when they act as signal exporters; (C) A pathway through which cells communicate with other cells when they act as signal receivers; (D) Communication analysis of each cell under the APP signaling pathway; (E) Receptor-ligands and possibilities for communication between cells via APP signaling pathway; (F) The expression of receptor-ligand in each cell; (G) Communication analysis of each cell under the CD99 signaling pathway; (H) Receptor-ligands and possibilities for communication between cells via the CD99 signaling pathway; (I) The expression of receptor-ligand in each cell. |
Wgcna
We calculated the inflammasome index in the TCGA dataset, and found a significant difference in the inflammasome index between cancer and para-cancer samples (Figure 3A). To further screen out inflammation-related genes that influence PCa progression, we performed WGCNA on the TCGA dataset. We conducted a clustering analysis on the samples in the TCGA dataset and deleted the outlier samples (Figure 3B). Thereafter, based on the independence and average connectivity analysis, we selected the power of 18 (R2 = 0.85) to build a weighted co-expression network (Figure 3C-D), and clustered genes into 13 modules. We then conducted a correlation analysis between sample features (inflammasome) and the identified modules (Figure 3E). Based on p<0.05 and cor > 0.5 during module screening, we screened out the purple module (588 genes), the brown module (1312 genes), and the blue module (66 genes). Gene significance versus module membership (GS vs MM) analysis showed that genes in the purple (cor=−0.37, p=0.0022), brown (cor=0.82, p=4e-144) and blue (cor=0.27, p=2.4e-23) modules were significantly correlated with the modules and inflammation (Figure 3F–H).
 |
Figure 3 WGCNA. (A) Evaluation of the inflammasome index in cancer and para-cancer tissues; (B) Cluster analysis of samples; (C) Network topology analysis under various soft thresholds; (D) Clustering phylogenetic trees of dissimilar genes based on topological overlap; (E) Correlation between each module and inflammasome index; (F) GS vs MM analysis of the purple module; (G) GS vs MM analysis of the brown module; (H) GS vs MM analysis of the blue module. |
Screening of Intersection Genes
Through differential analysis, we identified 4173 DEGs, with 1666 being up-regulated and 2507 down-regulated (Figure 4A). Subsequently, we identified intersection genes by overlapping inflammation-related genes in the dataset, DEGs from the dataset, and DEGs from fibroblasts. A total of 12 intersection genes were screened out: ARHGAP24, HHIP, MITF, CBX7, CAMK4, PPP1R12B, SPRED1, RGMA, PLEKHA1, EPS8, ADGRA2, and PGR (Figure 4B). These 12 genes were demonstrated to be distributed in different locations on the chromosome (Figure 4C). GO enrichment analysis of the 12 genes revealed their potential involvement in the negative regulation of biological processes, such as signaling, plasma membrane region, and protein binding (Figure 4D).
 |
Figure 4 Screening of intersection genes. (A) The volcano map of DEGs; (B) Venn diagram showing intersection genes; (C) The distribution of intersection genes on chromosomes; (D) GO functional enrichment analysis of intersection genes. |
Tumor Subtype Analysis
Using clustering analysis based on the 12 identified genes, the tumor samples were classified into two subtypes, K1 and K2 (Figure 5A–B). The PCA map showed better grouping (Figure 5C). Subsequently, we calculated the inflammasome and inflammatory response index for samples in K1 and K2 subgroups (Figure 5D–E). The results showed that the inflammatory correlation index of samples was higher in the K2 subgroup compared to the K1 subgroup. Additionally, we found differences in the expression of four immune checkpoints (CD274, PDCD1, LAG3, CTLA4) between K1 and K2, with all being highly expressed in the K2 subgroup (Figure 5F–I). These findings suggest that these 12 genes can predict the progression of PCa.
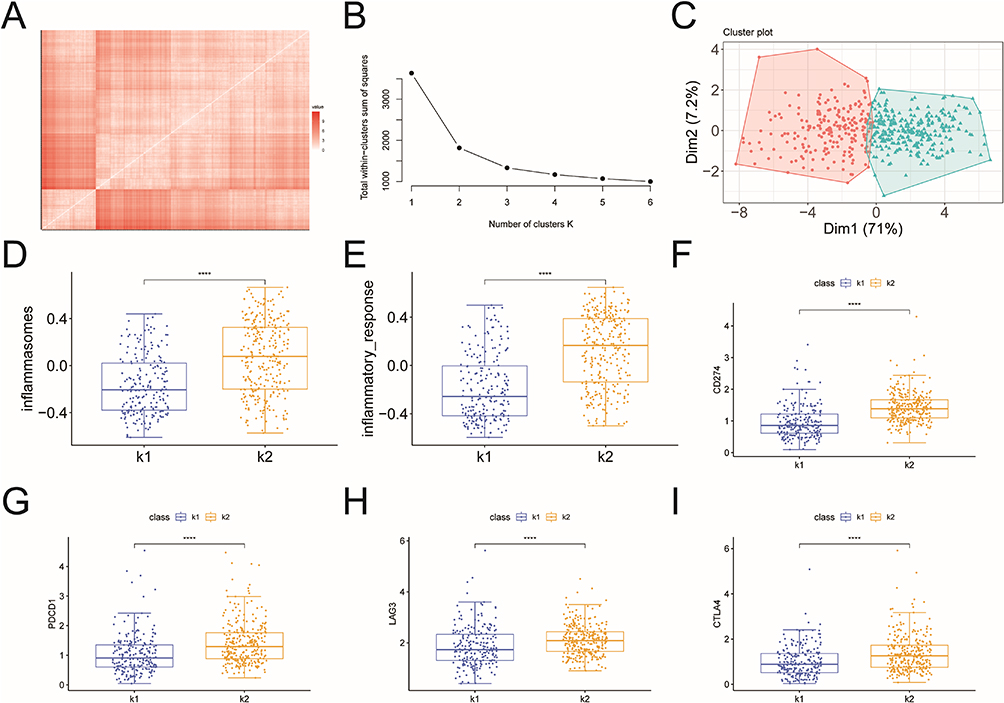 |
Figure 5 Tumor subtype analysis. (A) The distance matrix between tumor samples; (B) Screened plot; (C) PCA analysis; (D) Inflammasome index in K1 and K2; (E) Inflammatory response index in K1 and K2; (F) The difference of CD274 expression in K1 and K2; (G) The difference of PDCD1 expression in K1 and K2; (H) The difference of LAG3 expression in K1 and K2; (I) The difference of CTLA4 expression in K1 and K2. ****p<0.0001. |
Screening of Key Genes
The SVM-RFE (Figure 6A–B) and the Lasso-cox (Figure 6C–D) were machine learning algorithms jointly used for the screening of key genes affecting the progression of PCa, through which we identified eight key genes: ARHGAP24, HHIP, MITF, CBX7, PPP1R12B, PLEKHA1, ADGRA2, and PGR.
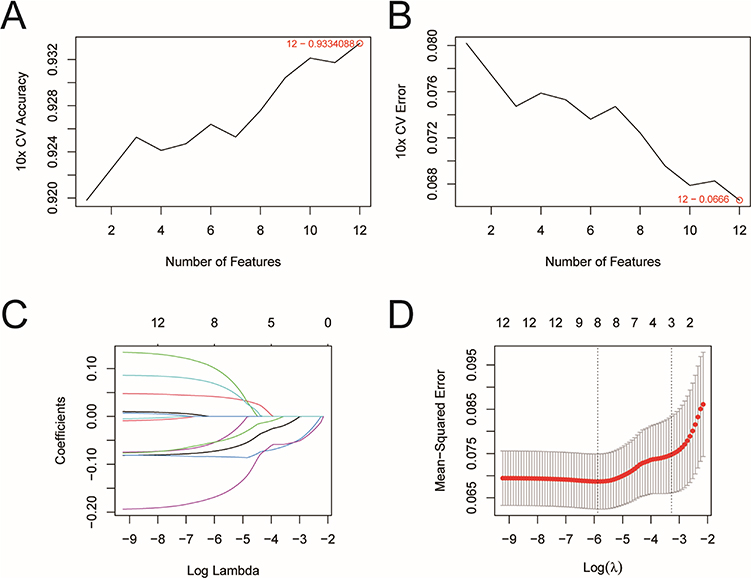 |
Figure 6 Screening of key genes. (A) Accuracy of curve changes after 10-fold cross validation; (B) Error rate of curve changes after 10-fold cross validation; (C) Distribution of lasso regression coefficients; (D) Parametric graph of lasso regression. |
The Expression of Genes in Each Dataset
The eight key genes were observed to be down-regulated in cancer samples (Figure 7A). Moreover, these genes showed a positive correlation with each other (Figure 7B) and were also significantly positively correlated with inflammasomes (Figure 7C) and the inflammatory response (Figure 7D). Further verification using the rank-sum test confirmed differential expression of these eight genes, revealing that HHIP and PPP1R12B were significantly different in fibroblasts, while ARHGAP24, MITF, CBX7, PLEKHA1, ADGRA2, and PGR did not show significant differences in fibroblasts (Supplementary Figure 2A-H).
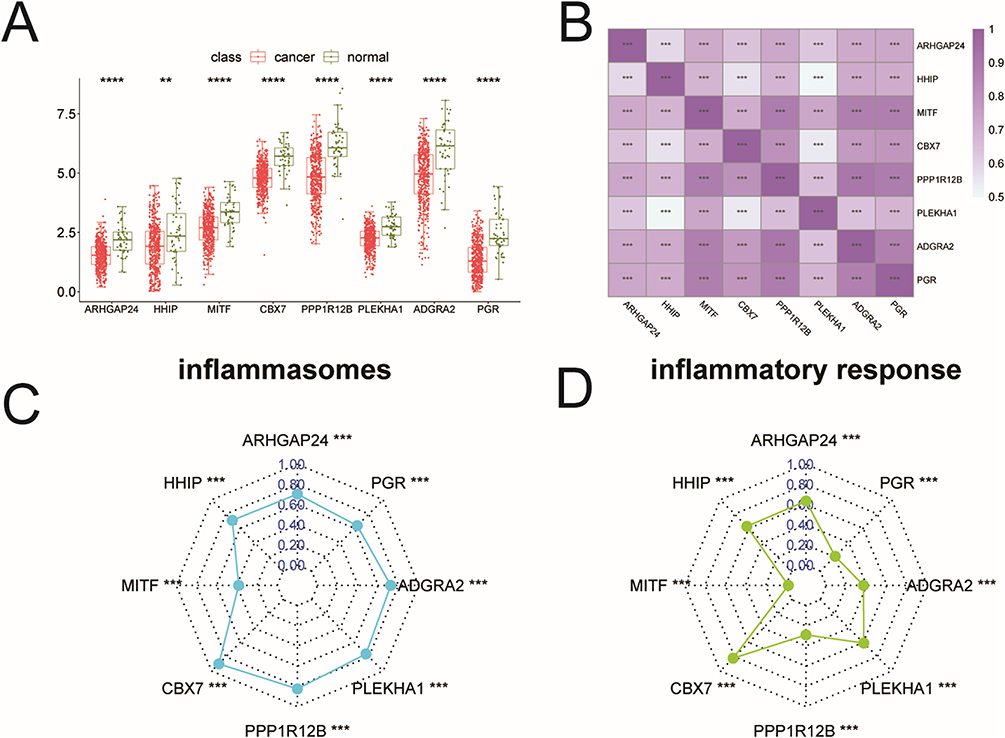 |
Figure 7 The expression of key genes in each dataset. (A) The expression of key genes in the TCGA dataset; (B) Correlation analysis between key genes; (C) Correlation between key genes and inflammasomes associated indices; (D) Correlation between inflammatory response correlation index and key genes. **p<0.01, ***p<0.001, ****p<0.0001. |
Immune Infiltration Analysis
We performed immune infiltration analysis on the samples (Figure 8A), and analyzed the differences of each immune cell among the groups. The analysis revealed significant differences in immune cells, including B cells memory, NK cells activated, macrophages M0, T cells follicular helper, macrophages M2, T cells regulatory tregs, plasma cells, mast cells resting, and mast cells activated, among the groups (Figure 8B). Correlation analysis of these immune cells with significant differences showed that B cells memory was negatively correlated with mast cells resting, plasma cells, and macrophages M2, while they were positively correlated with T cells follicular helper and T cells regulatory tregs (Figure 8C). Further correlation analysis between these eight immune cells and key genes showed that HHIP was significantly positively correlated with mast cells resting, and negatively correlated with T cells regulatory tregs, macrophages M2, and T cells follicular helper (Figure 8D). PPP1R12B was negatively correlated with T cells follicular helper, T cells regulatory tregs, and macrophages M2 (Figure 8E). PLEKHA1 was negatively correlated with macrophages M2, NK cells activated, and T cells regulatory tregs (Figure 8F). PGR was significantly positively correlated with mast cells resting, and negatively correlated with T cells follicular helper, macrophages M2, and T cells regulatory tregs (Figure 8G). MITF was negatively correlated with T cells follicular helper, T cells regulatory tregs, and macrophages M2 (Figure 8H). CBX7 was negatively correlated with T cells regulatory tregs and macrophages M2 (Figure 8I). ARHGAP24 was negatively correlated with T cells follicular helper, T cells regulatory tregs, and macrophages M2 (Figure 8J). ADGRA2 was significantly positively correlated with mast cells resting, and negatively correlated with T cells follicular helper, T cells regulatory tregs, and macrophages M2 (Figure 8K). These findings suggest that the degree of immune cell infiltration in the TME may affect the malignant progression of PCa.
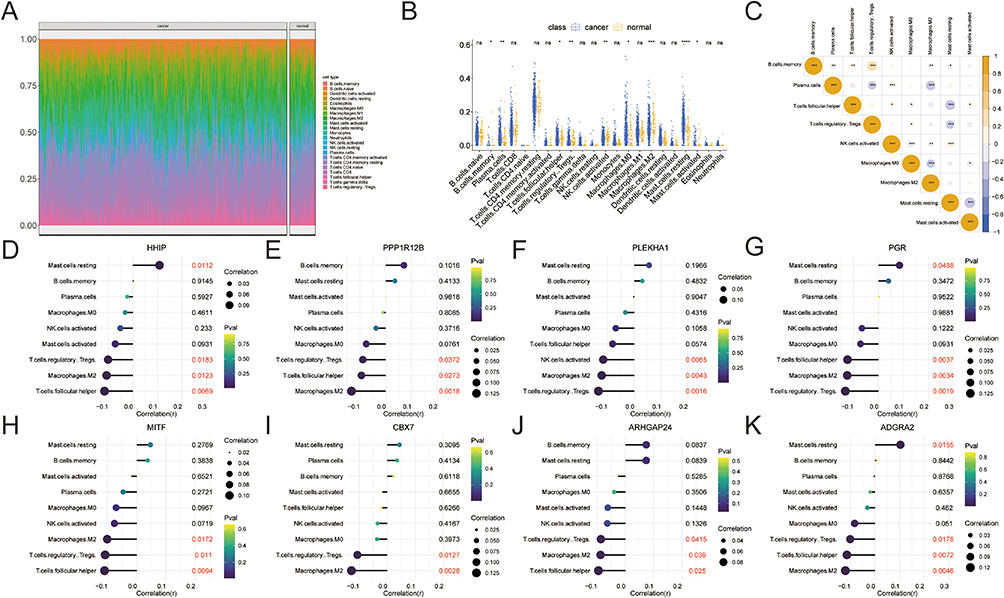 |
Figure 8 Immune infiltration analysis. (A) The proportion of immune cells in each sample; (B) The differences between the immune cells in each group; (C) Correlation analysis between immune cells; (D) Correlation between immune cells and HHIP, (E) PPP1R12B, (F) PLEKHA1, (G) PGR, (H) MITF, (I) CBX7, (J) ARHGAP24, (K) ADGRA2. nsp>0.05, *p<0.05, **p<0.01, ***p<0.001, ****p<0.0001. |
Gsva
GSVA of the eight key genes revealed that HHIP was highly enriched in the JAK-STAT pathway (Figure 9A); PPP1R12B, MITF, ARHGAP24, and ADGRA2 were highly enriched in Focal adhesion (Figure 9B–E); PLEKHA1 was enriched in autophagy (Figure 9F); PGR was enriched in the regulation of actin cytoskeleton (Figure 9G); and CBX7 was enriched in ECM−receptor interaction (Figure 9H).
 |
Figure 9 GSVA. (A) HHIP; (B) PPP1R12B; (C) MITF; 9D) ARHGAP24; (E) ADGRA2; (F) PLEKHA1; (G) PGR; (H) CBX7. |
Low Expression of HHIP in Pca Tissues and CAFs
We chose HHIP for subsequent experimental verification. IHC (Figure 10A) and WB (Figure 10B) were performed to assess the expression of HHIP in clinical samples. The results revealed that the expression of HHIP in PCa was lower than that in para-cancer tissues. Thereafter, we detected the expression of HHIP in primary CAFs and primary normal fibroblasts (NFs). Our findings demonstrated that the expression of HHIP was lower in CAFs than that in NFs (Figure 10C–E).
 |
Figure 10 Low expression of HHIP in Pca tissues and CAFs. (A) Detection of HHIP expression by IHC (n=4) (Bar, 100 μm); (B) Detection of HHIP expression by WB (n=6); (C) Detection the markers of fibroblasts (n=3); (D) Detection the expression level of HHIP in fibroblasts (n=3); (E) Detection the markers of fibroblasts and the expression level of HHIP (n=3) (Bar, 50 μm). **p<0.01. |
HHIP Regulates the Inflammatory Response of CAFs
To further clarify the mechanism of HHIP, we overexpressed or knocked down the expression of HHIP in the extracted primary CAFs (Figure 11A). The results indicated that changing the level of HHIP expression did not affect cell activity (Figure 11B), but down-regulated HHIP expression led to increased expression of α-SMA, a specific marker protein of CAFs. It suggested that the increase of HHIP expression might promote the transformation of CAFs into NFs17 (Figure 11C). Simultaneously, we found that HHIP inhibited the secretion of inflammatory factors, IL-6, TGF-β, and IL-1β, from CAFs (Figure 11D). The aforementioned bioinformatics analysis showed that HHIP may regulate the JAK-STAT pathway. Therefore, we detected the expression levels of the JAK-STAT pathway-related proteins. Our results showed that HHIP inhibited the phosphorylation levels of JAK1 and STAT3 (Figure 11A). Thus, we concluded that HHIP plays a regulatory role in the JAK1-STAT3 pathway.
 |
Figure 11 HHIP regulates the inflammatory response of CAFs. (A) Detection of the expression of HHIP and the JAK-STAT pathway-related proteins in cells by WB (n=3); (B) Detection of the cells’ activity (n=3); (C) Detection of the expression level of α-SMA by IF (n=3) (Bar, 50 μm); (D) The secretion of inflammatory factors detected by ELISA (n=3). nsp>0.05, **p<0.01. |
HHIP Regulates the Inflammatory Response of CAFs and Influences the Stemness of PCa Cells
We collected the supernatants from CAF+oe-NC and CAF+oe-HHIP cells and co-cultured them with PC3 and DU145 cells. We found that CAF+oe-HHIP cells inhibited the cell activity (Figure 12A), cell proliferation (Figure 12B), colony formation (Figure 12C), migration, and invasion (Figure 12D–E) of PC3 and DU145 cells. Additionally, CAF+oe-HHIP cells were found to inhibit the sphere formation of cancer cells (Figure 12F). Furthermore, flow cytometry (Figure 12G) and WB (Figure 12H) analyses showed that CAF+oe-HHIP cells reduced the proportion of CD133+ cell subpopulations and decreased the expression of CD133 and CD44, markers of tumor cell stemness. Based on the above experimental results, we concluded that HHIP regulates the inflammatory response of CAFs and affects the stemness of PCa cells.
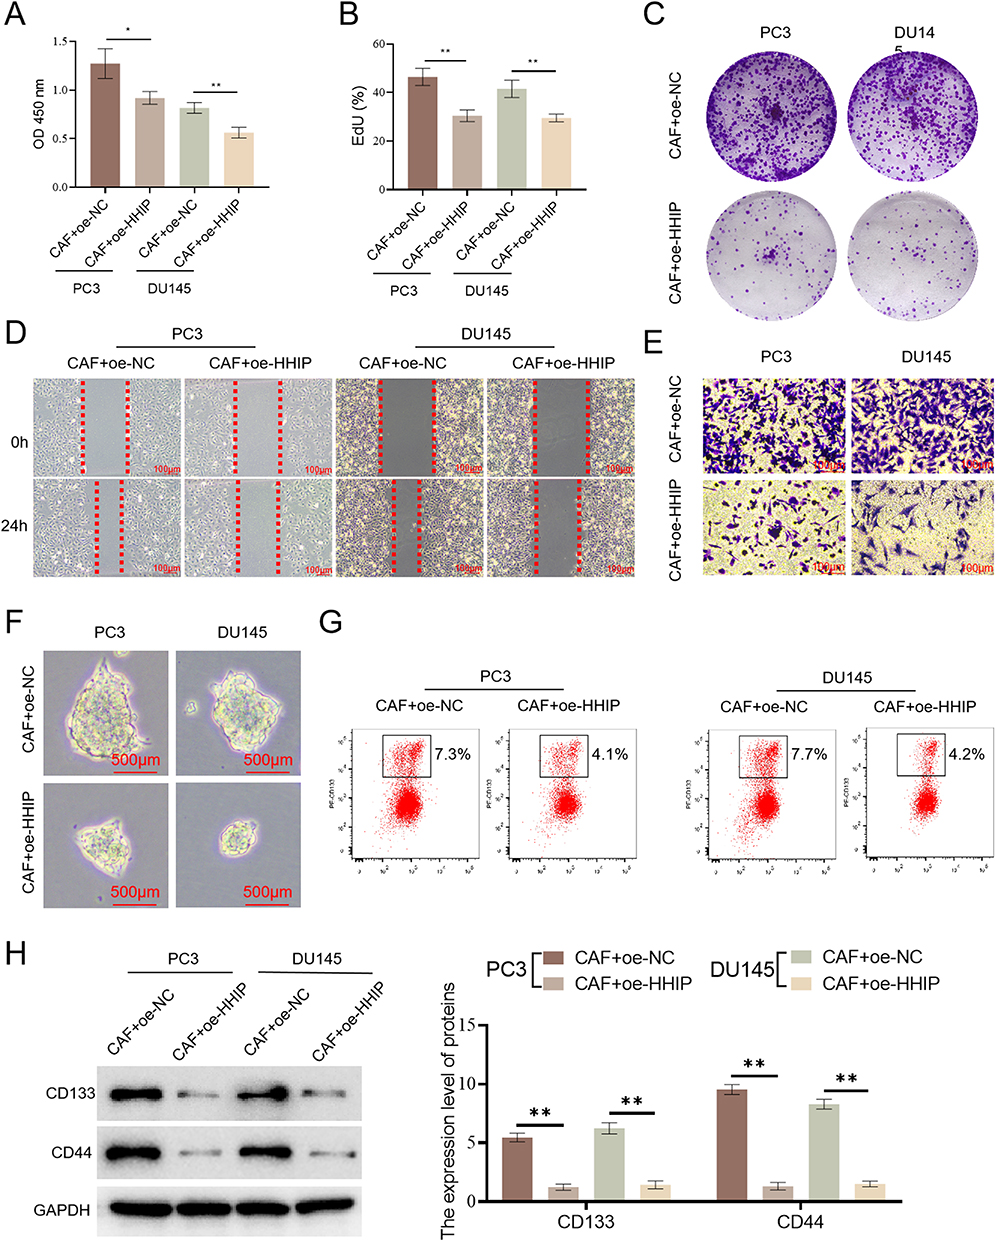 |
Figure 12 HHIP regulates the inflammatory response of CAFs and influences the stemness of PCa cells.(A) The activity of cancer cells was detected (n=3); (B) The proliferation of cancer cells was detected (n=3); (C) The colony formation of cancer cells (n=3); (D) The migration of cancer cells (n=3); (E) The invasion of cancer cells (n=3) (Bar, 100 μm); (F) The sphere-forming ability of cancer cells (n=3) (Bar, 500 μm); (G) Flow cytometry detection of CD133 + cells (n=3); (H) Detection the CD133 and CD44 (n=3). *p<0.05, **p<0.01. |
HHIP Influences the Stemness of PCa Cells by Regulating the Inflammatory Response of CAFs Through the JAK1-STAT3 Signaling Pathway
We pretreated CAFs with AG490, an inhibitor of the JAK1-STAT3 pathway, and found that AG490 inhibited the JAK1-STAT3 signaling pathway in CAFs without changing the expression level of HHIP (Figure 13A), suggesting that HHIP is the upstream regulator of the JAK1-STAT3 pathway. Upon HHIP knockdown, JAK1-STAT3 was reactivated, and the secretion of inflammatory factors by CAFs was also increased (Figure 13A–B). We simultaneously collected the above cell supernatants and co-cultured them with PC3 cells. The results indicated that AG490 inhibited cell activity (Figure 13C), cell proliferation (Figure 13D), colony formation (Figure 13E), migration, and invasion (Figure 13F–G), as well as the sphere formation (Figure 13H) of cancer cells. However, knocking down the expression of HHIP reversed the inhibitory effect of AG490. Therefore, we inferred that HHIP regulates the inflammatory response of CAFs through the JAK1-STAT3 pathway, subsequently impacting the stemness of PCa cells.
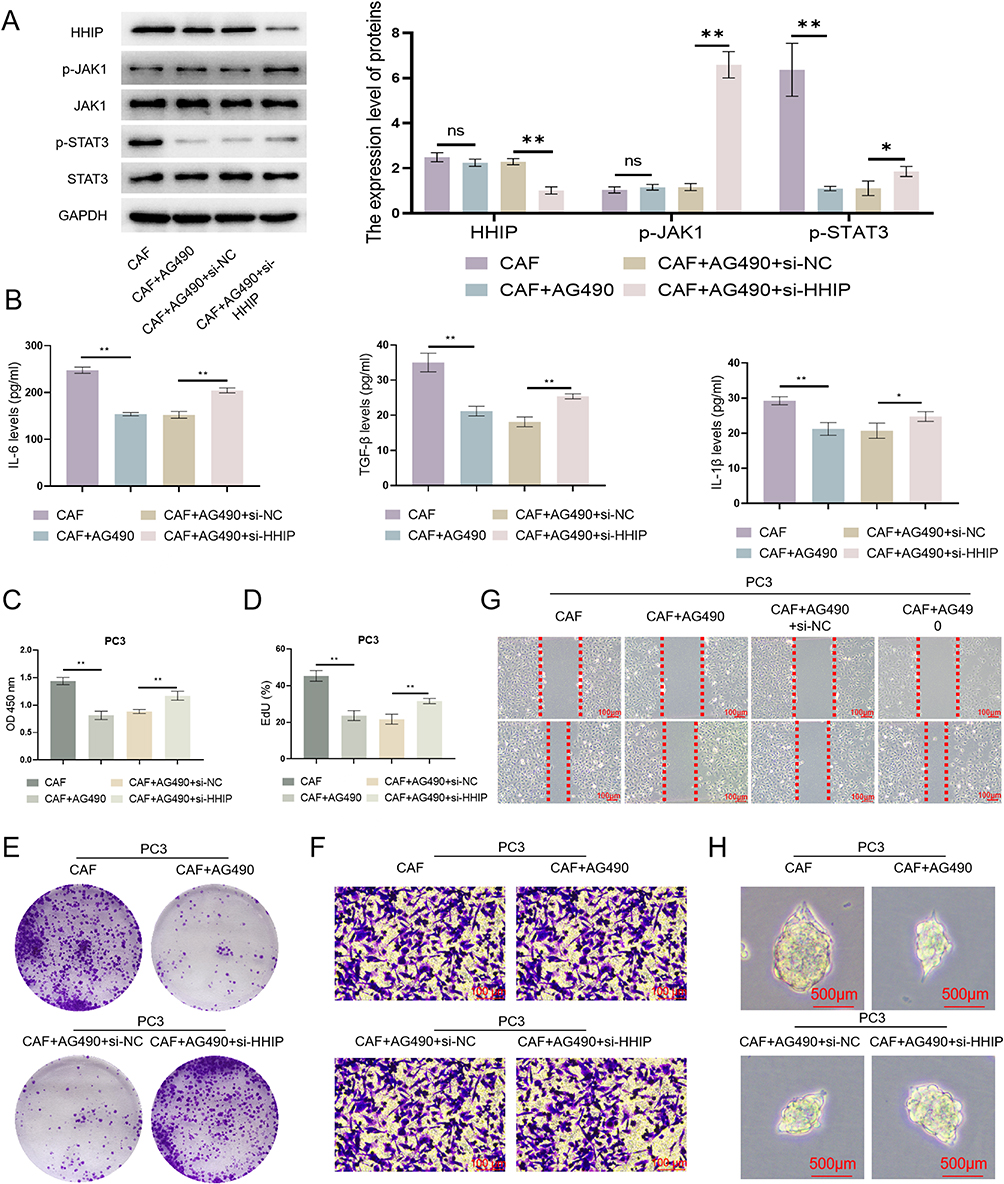 |
Figure 13 HHIP influences the stemness of PCa cells by regulating the inflammatory response of CAFs through the JAK1-STAT3 pathway. (A) The expression of HHIP and the JAK1-STAT3 pathway-related proteins was detected (n=3); (B) The secretion of inflammatory factors was detected (n=3); (C) The activity of cancer cells was detected (n=3); (D) The proliferation of cancer cells was detected (n=3); (E) The colony formation of cancer cells (n=3); (F) The migration of cancer cells (n=3) (Bar, 100 μm); (G) The invasion of cancer cells (n=3) (Bar, 100 μm); (H) The sphere-forming ability of cancer cells (n=3) (Bar, 500 μm), *p<0.05, **p<0.01. |
HHIP Inhibits Tumor Proliferation in PCa
To confirm the effect of HHIP on tumor proliferation, we conducted tumor formation experiments in mice. The results showed that HHIP inhibited PCa proliferation (Figure 14A–C) and significantly reduced tumor densification (Figure 14D). Therefore, we concluded that HHIP has the ability to inhibit tumor proliferation in PCa.
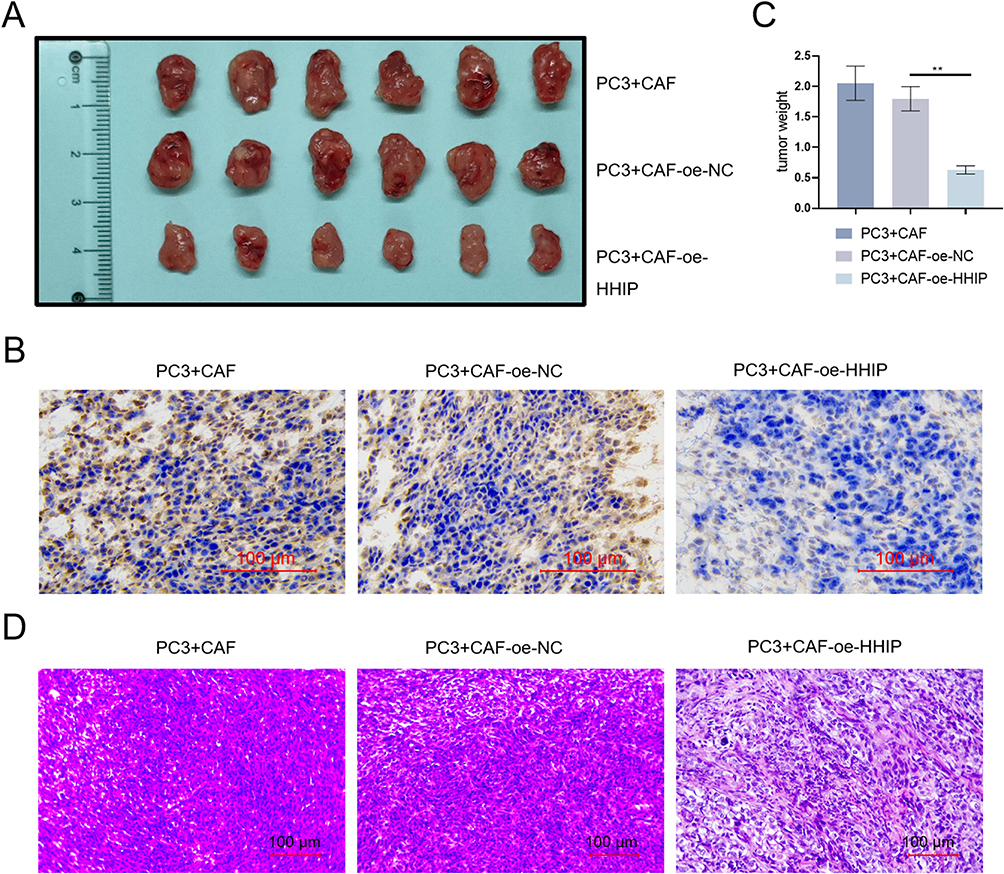 |
Figure 14 HHIP inhibits tumor proliferation in PCa. (A) The size of the tumor (n=6); (B) Ki67 was detected by IHC to assess tumor proliferation (n=6) (Bar, 100 μm); (C) The weight of the tumor (n=6); (D) The density of the tumor was detected by HE staining (n=6) (Bar, 100 μm), **p<0.01. |
Discussion
Fibroblasts in the tumor stroma have an impact on the occurrence and invasion of PCa and are crucial in the malignant transformation of prostate epithelial cells.18 Single-cell analysis has highlighted the important role of fibroblasts in PCa progression. Studies have shown that CAFs can affect the growth of PCa cells by regulating autophagy through ATG5.19 In addition, fibroblasts can impact cancer cells through autocrine or paracrine ways. For instance, fibroblasts can accelerate the invasion of cancer cells through the secretion of chemokine CCL3;20 glucosamine secreted by CAFs can increase glycosylation modification in PCa cells, and then up-regulate androgen synthesis in tumors to overcome castration;21 and CAFs can also inhibit GSK3β/β-catenin signaling through miR-1290 in exosomes, thereby promoting PCa cell growth and tumorigenesis.22 Progress have been made in the therapeutic strategies targeting CAFs and CAFs-related pathways in animal and clinical trials,23 making CAFs a focal point in both clinical and preclinical research. In this study, we focused on fibroblasts, screening DEGs in the fibroblasts with the help of single-cell dataset to explore the mechanism of CAFs in the regulation of cancer cells.
Fibroblasts are characterized by their multi-origin nature and high heterogeneity. There are different subtypes of CAFs in different tumors.24 The polarization of these subtypes is regulated by inflammation-related factors IL-1α or TGF-β1.25 Simultaneously, it has been reported that IL-6 secreted by CAFs can promote the transformation of non-invasive bladder cancer cells into an aggressive phenotype,26 and IL-1β secreted by CAFs can induce the formation of neutrophil extracellular trapping net, thus promoting liver metastasis of colorectal cancer.27 The aforementioned studies suggest that inflammatory factors within the TME may regulate the interaction between cancer cells and CAFs, thus affecting cancer occurrence and metastasis, and response to anti-cancer therapies. Therefore, we performed WGCNA to identify inflammation-related genes that may impact the progression of PCa.
In this study, two key genes (PPP1R12B and HHIP) were screened out by bioinformatics analysis. PPP1R12B has been reported to regulate the progression of esophageal and colorectal cancer. Specifically, it regulates the cell cycle pathway to inhibit the progression of esophageal cancer,28 and regulates the Grb2/PI3K/Akt pathway to inhibit the metastasis of colorectal cancer.29 In glioblastoma, HHIP is regulated by microRNA-221 to promote tumor progression.30 In hepatocellular carcinoma, circFAM114A2 enhances HHIP expression, thereby inhibiting tumor growth.31 Other studies have shown that exosomes secreted by chronic hepatitis B patients can inhibit the co-expression of HHIP and TCF21, thus promoting the progression of liver cancer.32 However, the role of HHIP in PCa has not yet been investigated. Studies have reported that HHIP can upregulate IL-18 pathway-related genes in lung fibroblasts, leading to increased IFN-γ levels in CD8+ T cells in vitro,33 suggesting that HHIP has the potential to regulate CAFs in PCa to influence cancer cells.
Tumor cells induce immune tolerance by secreting signaling molecules to change the TME. Immune cells in the TME can subsequently affect the prognosis of patients.34 PCa is generally regarded as an immune “cold” tumor characterized by low density of immune cell infiltration and poor immunogenic response. However, docetaxel, a drug used in the clinical treatment of PCa, promotes T cell infiltration and activates anti-tumor immune response in a cGAS/STING-dependent manner to achieve therapeutic effects.35 To further investigate the role of immune cells in PCa progression and the potential impact of HHIP on immune cell infiltration in tumor tissues, we performed immune infiltration analyses in the TCGA dataset. The results showed significant differences in various immune cells, including NK cells, B cells, Mast cells, and T cells between groups. As the main cells of humoral immunity, B cells secrete a neurotransmitter, gamma-aminobutyric acid (GABA), which inhibits the killer function of CD8+ T cells and suppresses anti-tumor immunity.36 Mast cells increase radiotherapy and chemotherapy resistance of PCa,37 whereas, Vibostolimab, a drug currently used in clinical practice, enhances T cell chemotaxis induced by activated NK cells, exerting anti-tumor effects on CRPC.38 The aforementioned studies on anti-tumor immunity have deepened our understanding of immunity in PCa. Our analysis further demonstrated HHIP’s regulation in immune cell invasion, highlighting it as a target for advancing clinical immunotherapy in PCa.
In the process of our attempt to clarify the mechanism by which HHIP regulates fibroblasts, HHIP was found to have the potential in regulating the JAK-STAT inflammatory pathway in fibroblasts through ssGSEA. Promoter hypermethylation has been shown to promote PCa cell migration and stem cell sphere formation by inhibiting AJAP1 expression and activating the JAK/STAT pathway.39 The JAK-STAT pathway can promote the transformation of iCAF.40 Furthermore, IL-6 secreted by fibroblasts in PCa can inhibit doxorubicin-induced apoptosis of cancer cells by affecting the JAK-STAT pathway of cancer cells.41 Nevertheless, the potential regulatory role of HHIP in the JAK-STAT signaling pathway remains unreported. Our subsequent experiments revealed that HHIP in fibroblasts can regulate the JAK1-STAT3 pathway to affect the secretion of inflammatory factors IL-1β, IL-6, and TGF-β, which in turn affects the stemness of PCa cells.
In this study, through bioinformatics methods, we screened out HHIP, an inflammatory-related factor that has an impact on the progression of PCa. Through experimental validation, we confirmed that HHIP can affect the stemness of PCa cells by regulating CAFs through the JAK1/STAT3 pathway. However, there are still shortcomings in our study. PPP1R12B, also identified in this study, requires further investigation to elucidate its role in PCa progression. Additionally, more and more clinical samples are required to be collected to further confirm the role of HHIP in PCa.
Data Sharing Statement
The data that support the findings of this study are available from the corresponding author upon reasonable request.
Ethics Approval
The clinical experiment was performed in line with the principles of the Declaration of Helsinki. Approval was granted by the Ethics Committee of Zhejiang Provincial People’s Hospital (Approval NO.: 2024[031]). The animal experiment was approved by the Institutional Animal Care and Use Committee of Zhejiang Center of Laboratory Animals (Approval No.: ZJCLA-IACUC-20010552). All animal experiments meet the requirements of National Institutes of Health guide for the care and use of Laboratory animals (NIH publications No. 8023, revised 1978).
Consent to Participate
Informed consent was obtained from all individual participants included in the study.
Author Contributions
All authors made a significant contribution to the work reported, whether that is in the conception, study design, execution, acquisition of data, analysis and interpretation, or in all these areas; took part in drafting, revising or critically reviewing the article; gave final approval of the version to be published; have agreed on the journal to which the article has been submitted; and agree to be accountable for all aspects of the work.
Funding
This work was supported by Zhejiang Medical and Health Science and Technology Project (Grant number [2021KY050]).
Disclosure
The authors report no conflicts of interest in this work.
References
1. Siegel RL, Miller KD, Wagle NS, Jemal A. Cancer statistics, 2023. CA Cancer J Clin. 2023;73(1):17–48. doi:10.3322/caac.21763
2. Bray F, Ferlay J, Soerjomataram I, et al. Global cancer statistics 2018: GLOBOCAN estimates of incidence and mortality worldwide for 36 cancers in 185 countries. CA Cancer J Clin. 2018;68(6):394–424. doi:10.3322/caac.21492
3. Qiu H, Cao S, Xu R. Cancer incidence, mortality, and burden in China: a time-trend analysis and comparison with the United States and United Kingdom based on the global epidemiological data released in 2020. Cancer Commun (Lond). 2021;41(10):1037–1048. doi:10.1002/cac2.12197
4. Faiena I, Salmasi A, Pantuck AJ, Drakaki A. Re: abiraterone for prostate cancer not previously treated with hormone therapy. Eur Urol. 2018;73(6):981. doi:10.1016/j.eururo.2018.01.023
5. O’Hara SM, Moreno JG, Zweitzig DR, et al. Multigene reverse transcription-PCR profiling of circulating tumor cells in hormone-refractory prostate cancer. Clin Chem. 2004;50(5):826–835. doi:10.1373/clinchem.2003.028563
6. Raimondi A, Sepe P, Claps M, et al. Safety and activity of radium-223 in metastatic castration-resistant prostate cancer: the experience of Istituto Nazionale dei Tumori. Tumori. 2020;106(5):406–412. doi:10.1177/0300891620905646
7. Cai M, Song X-L, Li X-A, et al. Current therapy and drug resistance in metastatic castration-resistant prostate cancer. Drug Resist Updat. 2023;68:100962. doi:10.1016/j.drup.2023.100962
8. Knipper K, Lyu SI, Quaas A, Bruns CJ, Schmidt T. Cancer-associated fibroblast heterogeneity and its influence on the extracellular matrix and the tumor microenvironment. Int J Mol Sci. 2023;24(17):13482. doi:10.3390/ijms241713482
9. Ma Z, Li X, Mao Y, et al. Interferon-dependent SLC14A1(+) cancer-associated fibroblasts promote cancer stemness via WNT5A in bladder cancer. Cancer Cell. 2022;40(12):1550–1565e1557. doi:10.1016/j.ccell.2022.11.005
10. Bedeschi M, Marino N, Cavassi E, Piccinini F, Tesei A. Cancer-associated fibroblast: role in prostate cancer progression to metastatic disease and therapeutic resistance. Cells. 2023;12(5):802. doi:10.3390/cells12050802
11. Vickman RE, Broman MM, Lanman NA, et al. Heterogeneity of human prostate carcinoma-associated fibroblasts implicates a role for subpopulations in myeloid cell recruitment. Prostate. 2020;80(2):173–185. doi:10.1002/pros.23929
12. Song Y, Tu J, Cheng Y, et al. HHIP overexpression suppresses human gastric cancer progression and metastasis by reducing its cpg island methylation. Front Oncol. 2020;10:1667. doi:10.3389/fonc.2020.01667
13. Li L, Ji Y, Zhang L, et al. Wogonin inhibits the growth of HT144 melanoma via regulating hedgehog signaling-mediated inflammation and glycolysis. Int Immunopharmacol. 2021;101:108222. doi:10.1016/j.intimp.2021.108222
14. Heidegger I, Fotakis G, Offermann A, et al. Comprehensive characterization of the prostate tumor microenvironment identifies CXCR4/CXCL12 crosstalk as a novel antiangiogenic therapeutic target in prostate cancer. Mol Cancer. 2022;21(1):132. doi:10.1186/s12943-022-01597-7
15. Wen XY, Wang RY, Yu B, et al. Integrating single-cell and bulk RNA sequencing to predict prognosis and immunotherapy response in prostate cancer. Sci Rep. 2023;13(1):15597. doi:10.1038/s41598-023-42858-9
16. Linxweiler J, Hajili T, Körbel C, et al. Cancer-associated fibroblasts stimulate primary tumor growth and metastatic spread in an orthotopic prostate cancer xenograft model. Sci Rep. 2020;10(1):12575. doi:10.1038/s41598-020-69424-x
17. Ma J, Xu Y, Zheng Q, et al. Ligustilide inhibits the activation of cancer-associated fibroblasts. Life Sci. 2019;218:58–64. doi:10.1016/j.lfs.2018.12.032
18. Sasaki T, Yoshikawa Y, Kageyama T, et al. Prostate fibroblasts enhance androgen receptor splice variant 7 expression in prostate cancer cells. Prostate. 2023;83(4):364–375. doi:10.1002/pros.24468
19. Liu X, Tang J, Peng L, et al. Cancer-associated fibroblasts promote malignant phenotypes of prostate cancer cells via autophagy: cancer-associated fibroblasts promote prostate cancer development. Apoptosis. 2023;28(5–6):881–891. doi:10.1007/s10495-023-01828-2
20. Noh KH, Jeong AJ, Lee H, et al. Crosstalk between prostate cancer cells and tumor-associated fibroblasts enhances the malignancy by inhibiting the tumor suppressor PLZF. Cancers (Basel). 2020;12(5):1083. doi:10.3390/cancers12051083
21. Cui D, Li J, Zhu Z, et al. Cancer-associated fibroblast-secreted glucosamine alters the androgen biosynthesis program in prostate cancer via HSD3B1 upregulation. J Clin Invest. 2023;133(7). doi:10.1172/JCI161913
22. Wang S, Du P, Cao Y, et al. Cancer associated fibroblasts secreted exosomal miR-1290 contributes to prostate cancer cell growth and metastasis via targeting GSK3beta. Cell Death Discov. 2022;8(1):371. doi:10.1038/s41420-022-01163-6
23. Hu D, Li Z, Zheng B, et al. Cancer-associated fibroblasts in breast cancer: challenges and opportunities. Cancer Commun (Lond). 2022;42(5):401–434. doi:10.1002/cac2.12291
24. Affo S, Nair A, Brundu F, et al. Promotion of cholangiocarcinoma growth by diverse cancer-associated fibroblast subpopulations. Cancer Cell. 2021;39(6):883. doi:10.1016/j.ccell.2021.05.010
25. Mosa MH, Michels BE, Menche C, et al. A Wnt-induced phenotypic switch in cancer-associated fibroblasts inhibits EMT in colorectal cancer. Cancer Res. 2020;80(24):5569–5582. doi:10.1158/0008-5472.CAN-20-0263
26. Goulet CR, Champagne A, Bernard G, et al. Cancer-associated fibroblasts induce epithelial-mesenchymal transition of bladder cancer cells through paracrine IL-6 signalling. BMC Cancer. 2019;19(1):137. doi:10.1186/s12885-019-5353-6
27. Li C, Chen T, Liu J, et al. FGF19-Induced Inflammatory CAF promoted neutrophil extracellular trap formation in the liver metastasis of colorectal cancer. Adv Sci (Weinh). 2023;10(24):e2302613. doi:10.1002/advs.202302613
28. Chen Z, Tang W, Ye W, Song L, Chen Z. ADAMTS9-AS2 regulates PPP1R12B by adsorbing miR-196b-5p and affects cell cycle-related signaling pathways inhibiting the malignant process of esophageal cancer. Cell Cycle. 2022;21(16):1710–1725. doi:10.1080/15384101.2022.2067675
29. Ding C, Tang W, Wu H, et al. The PEAK1-PPP1R12B axis inhibits tumor growth and metastasis by regulating Grb2/PI3K/Akt signalling in colorectal cancer. Cancer Lett. 2019;442:383–395. doi:10.1016/j.canlet.2018.11.014
30. Chang L, Yin L, Zhang D, et al. MicroRNA-221 promotes tumor progression by targeting HHIP in human glioblastoma. Transl Cancer Res. 2021;10(2):1073–1081. doi:10.21037/tcr-21-99
31. Lai M, Li D, Liu M, et al. CircFAM114A2 inhibits the progression of hepatocellular carcinoma via miR −630/ HHIP axis. Cancer Med. 2023;12(11):12553–12568. doi:10.1002/cam4.5894
32. Ouyang Y, Tang Y, Fu L, et al. Exosomes secreted by chronic hepatitis B patients with PNALT and liver inflammation grade >/= A2 promoted the progression of liver cancer by transferring miR-25-3p to inhibit the co-expression of TCF21 and HHIP. Cell Prolif. 2020;53(7):e12833. doi:10.1111/cpr.12833
33. Yun JH, Lee C, Liu T, et al. Hedgehog interacting protein-expressing lung fibroblasts suppress lymphocytic inflammation in mice. JCI Insight. 2021;6(17). doi:10.1172/jci.insight.144575
34. Wu W, Wang X, Le W, et al. Immune microenvironment infiltration landscape and immune-related subtypes in prostate cancer. Front Immunol. 2022;13:1001297. doi:10.3389/fimmu.2022.1001297
35. Ma Z, Zhang W, Dong B, et al. Docetaxel remodels prostate cancer immune microenvironment and enhances checkpoint inhibitor-based immunotherapy. Theranostics. 2022;12(11):4965–4979. doi:10.7150/thno.73152
36. Zhang B, Vogelzang A, Miyajima M, et al. B cell-derived GABA elicits IL-10(+) macrophages to limit anti-tumour immunity. Nature. 2021;599(7885):471–476. doi:10.1038/s41586-021-04082-1
37. Xie H, Li C, Dang Q, Chang LS, Li L. Infiltrating mast cells increase prostate cancer chemotherapy and radiotherapy resistances via modulation of p38/p53/p21 and ATM signals. Oncotarget. 2016;7(2):1341–1353. doi:10.18632/oncotarget.6372
38. Wang F, Liu S, Liu F, et al. TIGIT immune checkpoint blockade enhances immunity of human peripheral blood NK cells against castration-resistant prostate cancer. Cancer Lett. 2023;568:216300. doi:10.1016/j.canlet.2023.216300
39. Chen L, Wang Y, Zhang B. Hypermethylation in the promoter region inhibits AJAP1 expression and activates the JAK/STAT pathway to promote prostate cancer cell migration and stem cell sphere formation. Pathol Res Pract. 2023;241:154224. doi:10.1016/j.prp.2022.154224
40. Biffi G, Oni TE, Spielman B, et al. IL1-Induced JAK/STAT signaling is antagonized by TGFbeta to shape CAF heterogeneity in pancreatic ductal adenocarcinoma. Cancer Discov. 2019;9(2):282–301. doi:10.1158/2159-8290.CD-18-0710
41. Cheteh EH, Sarne V, Ceder S, et al. Interleukin-6 derived from cancer-associated fibroblasts attenuates the p53 response to doxorubicin in prostate cancer cells. Cell Death Discov. 2020;6(1):42. doi:10.1038/s41420-020-0272-5
 © 2024 The Author(s). This work is published and licensed by Dove Medical Press Limited. The
full terms of this license are available at https://www.dovepress.com/terms.php
and incorporate the Creative Commons Attribution
- Non Commercial (unported, 3.0) License.
By accessing the work you hereby accept the Terms. Non-commercial uses of the work are permitted
without any further permission from Dove Medical Press Limited, provided the work is properly
attributed. For permission for commercial use of this work, please see paragraphs 4.2 and 5 of our Terms.
© 2024 The Author(s). This work is published and licensed by Dove Medical Press Limited. The
full terms of this license are available at https://www.dovepress.com/terms.php
and incorporate the Creative Commons Attribution
- Non Commercial (unported, 3.0) License.
By accessing the work you hereby accept the Terms. Non-commercial uses of the work are permitted
without any further permission from Dove Medical Press Limited, provided the work is properly
attributed. For permission for commercial use of this work, please see paragraphs 4.2 and 5 of our Terms.