")
Back to Journals » Clinical Interventions in Aging » Volume 19
The Monocyte-to-High-Density Lipoprotein Cholesterol Ratio as a Novel Predictor of the Prevalence of Senile Osteoporosis
Authors Lin N , Li D, Lin S, Ke Y, Lu J, Wu Y, Huang T, Hong H
Received 12 July 2024
Accepted for publication 19 October 2024
Published 1 November 2024 Volume 2024:19 Pages 1773—1788
DOI https://doi.org/10.2147/CIA.S478461
Checked for plagiarism Yes
Review by Single anonymous peer review
Peer reviewer comments 2
Editor who approved publication: Dr Zhi-Ying Wu
Nan Lin,1,* Dang Li,1,2,* Si Lin,1 Yilang Ke,1 Jianping Lu,3 Yinrong Wu,1 Tianwen Huang,1,3 Huashan Hong1
1Fujian Key Laboratory of Vascular Aging, Department of Geriatrics, Fujian Institute of Geriatrics, Fujian Clinical Research Center for Senile Vascular Aging and Brain Aging, Fujian Medical University Union Hospital, Fuzhou, Fujian, People’s Republic of China; 2Nursing Department, Fujian Medical University Union Hospital, Fuzhou, Fujian, People’s Republic of China; 3Department of Neurology, Fujian Medical University Union Hospital, Fuzhou, Fujian, People’s Republic of China
*These authors contributed equally to this work
Correspondence: Huashan Hong, Fujian Key Laboratory of Vascular Aging, Department of Geriatrics, Fujian Institute of Geriatrics, Fujian Clinical Research Center for Senile Vascular Aging and Brain Aging, Fujian Medical University Union Hospital, 29 Xinquan Road, Fuzhou, Fujian, 350001, People’s Republic of China, Tel +86 591 8621 8525, Fax +86 591 8621 8545, Email [email protected]
Purpose: The prevalence of osteoporosis in elderly individuals is high, and osteoporosis is strongly associated with chronic inflammation. The monocyte-to-high-density lipoprotein ratio (MHR) is acknowledged as a marker for assessing systemic inflammation and oxidative stress, and changes in the MHR are associated with many chronic disease prevalent among the elderly population. This study investigated the relationships between the MHR and the incidence of osteoporosis in older adults, along with its predictive value.
Patients and Methods: Data from 563 participants aged ≥ 70 years were retrospectively analysed. The haematological parameters were evaluated via established methodologies, utilizing fasting blood samples collected from the participants. The absolute monocyte count was used to calculate the MHR (MHR=monocyte/HDL-C). BMD was measured by dual-energy X-ray absorptiometry. The results were evaluated via comparative statistical analyses, Spearman correlation, logistic regression analyses, and receiver operating characteristic (ROC) curve analysis.
Results: The differences in the MHR were statistically significant among the osteoporosis groups (p < 0.001). Spearman correlation analysis revealed a positive correlation between the MHR and BMD. Furthermore, stratifying the sample into four groups on the basis of quartiles of MHR (M1, M2, M3, and M4) revealed a decreased risk of osteoporosis in the highest quartile compared with the lowest quartile (p < 0.001). Multiple logistic regression analysis revealed that BMI and the MHR were independent risk factors for osteoporosis. The area under the ROC curve and the cut-off value of the MHR were 0.710 and 0.308(109/mmol), with specificity and sensitivity of 0.599 and 0.735, respectively (95% CI: 0.668~0.752, p < 0.0001).
Conclusion: A low MHR was associated with a greater risk of senile osteoporosis. In clinical practice, the MHR has shown predictive value for senile osteoporosis, contributing to early intervention and treatment of this disease.
Keywords: senile osteoporosis, monocyte-to-high-density lipoprotein ratio, bone mineral density, inflammation, senescence
A Letter to the Editor has been published for this article.
A Response to Letter by Dr Dou has been published for this article.
Introduction
Osteoporosis is a disease characterized by increased bone turnover and decreased bone mass with associated skeletal fragility.1 The estimated global cumulative incidence of osteoporosis is projected to reach 263.2 million from 2030 to 2034.2 Senile osteoporosis has become a significant health concern worldwide because it is an age-related disorder that occurs in people in their 70s and leads to the attenuation of both cortical and trabecular bones.3 The global occurrence rate of osteoporosis among elderly individuals is 21.7%, and findings from an inaugural epidemiological survey on osteoporosis in China published in 2018 revealed a staggering prevalence rate of 32.0% among individuals aged 65 years and above.4 The prevalence of osteoporosis among elderly individuals residing in rural areas is significantly greater than that among their urban counterparts, while the rates of diagnosis and treatment remain low. As the disease progresses, unfavourable outcomes such as fractures often occur, which severely impair quality of life and impose a considerable medical burden on individuals, their families, and society.
Osteoporosis is also considered a silent disease, as there are typically no symptoms until the first fracture occurs.5 Therefore, early osteoporosis screening of elderly individuals is imperative to facilitate timely intervention and mitigate potential risks. Currently, the World Health Organization employs bone mineral density (BMD) and the T score to define osteoporosis, relying primarily on imaging examinations to obtain the necessary diagnostic data.5 However, the available instruments for osteoporosis screening or diagnosis, such as quantitative ultrasound (QUS), quantitative computed tomography (QCT), radiographic absorptiometry (RA), and dual-energy X-ray absorptiometry (DXA), are predominantly found in medical centres with limited accessibility. Particularly in China, primary health care institutions such as community health centres and rural hospitals face challenges in acquiring corresponding examination equipment because of their high costs and monitoring expenses. This situation hinders early detection and timely treatment of osteoporosis among elderly individuals. Therefore, there is an urgent need for a simple predictor that enables early detection.
The pathogenesis of osteoporosis involves oxidative stress, inflammatory processes, and dysregulation of the expression of microRNAs.6 Chronic inflammation is a crucial pathophysiological mechanism underlying osteoporosis.7 Inflammatory changes in the bone microenvironment result in alterations leading to both excessive bone loss and bone formation.8 Therefore, markers associated with inflammation and the immune response are anticipated to serve as indicators for the early prediction of osteoporosis.
Monocytes are innate immune cells with diverse functions that serve as precursors to osteoclasts (OCs), macrophages, and dendritic cells (DCs). One study revealed that monocytes can secrete monocyte chemoattractant protein 1 (MCP-1), which subsequently induces positive telomerase activity in inflammatory cells. This cascade triggers osteoclastogenesis by monocytes under the influence of macrophage colony-stimulating factor (M-CSF), ultimately leading to enhanced bone resorption and subsequent development of osteoporosis.9 High-density lipoprotein (HDL) levels are tightly linked with bone physiology and pathology. Specifically, HDL levels are associated with the development of an inflammatory microenvironment that affects the differentiation and function of osteoblasts.10 The monocyte-to-HDL-C ratio (MHR) is a novel and composite predictor that can reflect the balance between the inflammatory and oxidative stress of monocytes and HDL-C. The ability of the MHR to predict clinical outcomes might be better than that of either of its two components (monocyte count and HDL-C concentration) in isolation.11 The MHR has been shown to be associated with prognosis in cardiovascular, diabetic, and systemic sclerosis patients.12–15 The MHR presents the advantages of cost-effectiveness and convenient acquisition. Therefore, the MHR has the potential to serve as a reliable, economical, innovative, and easily generalizable biomarker for osteoporosis in the elderly population; however, research on the relationship between the MHR and osteoporosis is still limited. This retrospective study aimed to investigate the association between the serum MHR and senile osteoporosis, highlighting the clinical significance of the MHR in this population.
Materials and Methods
Participants
This retrospective analysis was conducted with older adults recruited from the Bone Density Test Room at Fujian Medical University Union Hospital (Fujian, China) between January 2017 and July 2022. The inclusion criteria were as follows: (1) aged 70 years or older and (2) had complete relevant clinical and laboratory examination data. The exclusion criteria were as follows: (1) had a serious and unstable health condition (ie, severe cardiovascular or cerebrovascular diseases, obvious liver or renal dysfunction, severe anaemia, haemolysis, or malignant tumours); (2) had acute or chronic infections; (3) had thyroid or rheumatic diseases; and (4) had undergone long-term administration of glucocorticoids.
This study was conducted in accordance with the Declaration of Helsinki (revised in 2013) and it was approved by the Medical Faculty of Fujian Medical University Union Hospital Ethics Committee (2023KY139). Considering the retrospective nature of this study, the requirement for individual consent was waived upon application by the investigators, following approval from the Ethics Committee of Fujian Medical University Union Hospital. All patient information and data used in this study were handled with strict confidence and deidentified to protect patient privacy in compliance with relevant ethical and legal standards.
Anthropometric and Laboratory Assessments
A standardized questionnaire regarding demographic data was administered by a trained team of interviewers. A review of medical records and laboratory data was conducted to obtain demographic and medical information, including age, sex, anamnesis and medication history. Anthropometric data, including height and weight, were collected by the research nurses. Body mass index (BMI) was calculated using the following formula: BMI (kg/m2) = weight (kg)/height2 (m2).
Laboratory assessments were conducted according to standard methods using fasting venous blood samples that were taken before bone mineral density examination between 8:00 and 10:00 a.m. after fasting overnight. Blood samples were collected into vacuum blood collection vessels. A total of 2 mL of venous blood was collected in EDTA collection vessels for routine blood tests and 2 mL of venous blood was collected in EDTA collection vessels for HbA1C tests, whereas 5 mL of venous blood was collected in procoagulant collection vessels for biochemical index tests. Additionally, 2.7 mL of venous blood was collected in sodium citrate collection vessels for fibrinogen testing. All drawn blood samples were stored at room temperature and sent to the same laboratory within one hour of collection to minimize experimental errors. For blood index testing, 1 mL of whole blood was used for routine blood analysis, whereas 2 mL of whole blood was used for HbA1c measurement. Additionally, 100 µL of serum was used for biochemical indicator and 100 µL of plasma was used for fibrinogen assessment following sample centrifugation. Each participant’s blood sample underwent a standardized procedure according to the protocol. The routine blood examination included counts of white blood cells (WBCs), neutrophils, monocytes, lymphocytes, and platelets (PLTs), as well as haemoglobin (Hb) levels. The biochemical indicators included triglyceride (TG) levels, cholesterol levels, high-density lipoprotein (HDL-C) levels, low-density lipoprotein (LDL-C) levels, albumin and globulin concentrations, and uric acid (UA) levels. The parameters used were as follows: 1) MHR = Monocytes (×109/L)/HDL (mmol/L)); 2) TG/HDL= TG (mmol/L)/HDL-C (mmol/L); and 3) NLR= Neutrophils (×109/L)/Lymphocytes (×109/L).
Biochemical indices were measured with an autobiochemical analyser (Roche, Basel, Switzerland, C702). HbA1c was evaluated by high-performance liquid chromatography with a D10 set (Bio-Rad). Complete blood counts were measured with a Sysmex XN-10(B4) analyser (Sysmex, Kobe, Japan). Fibrinogens were measured with a Stago STA-R Evolution analyser (Stago, Paris, France).
Assessment of Bone Mineral Density
The participants were subjected to bone mineral density (BMD) examination via dual-energy X-ray absorptiometry (General Electric, GE Healthcare, Lunar iDXA, ME+ 210673, Madison) in the supine position by the same experienced practitioner. The BMD was measured in the left proximal femur and lumbar vertebrae (L1-L4) and in the total hip and femoral neck. Standard modules were used for quality control before daily operation, and the practitioner was blinded to the clinical information. BMD values are presented as the amount of mineral (g) per scanned area (cm2) and were subsequently converted into T scores based on the corresponding coefficients. The precision error was 1.0% for the BMD measurements. Osteoporosis was diagnosed following the World Health Organization (WHO) criteria (2011) of a BMD T score of less than or equal to −2.5 SDs of the mean value for the healthy population of the same race, age and sex. Participants with a T score ≤ −2.5 were classified into the osteoporosis group, those with a T score ≥ −1 were classified into the normal group, and those with −2.5 < T score < −1 were classified into the osteopenia group.
Statistical Analyses
The data were analysed by using SPSS 26.0 software (SPSS Inc., IBM). The normality of the descriptive data was assessed via the Kolmogorov‒Smirnov test. Normally distributed variables are presented as the mean ± standard deviation (SD) and differences among groups were analysed with one-way analysis of variance (ANOVA) followed by the Tukey’s test for multiple comparisons. Nonnormally distributed variables are expressed as the median and interquartile range (IQR) and were analysed via the Kruskal‒Wallis H rank sum test. Discrete variables are summarized in frequency tables (N, %). The chi-square (χ2) test or Fisher’s exact test was used for comparisons of categorical variables. The correlations between the MHR and BMD were determined by Spearman correlation analysis. In the investigation of disease-influencing factors, both univariate and multivariate logistic regression analyses were employed. Receiver operating characteristic (ROC) curves were used to assess the value of the MHR and MAR for identifying osteoporosis. The optimal cut-off value was based on the greatest value of Youden’s index. A two-tailed value of p < 0.05 was considered to indicate statistical significance.
Results
Clinical Characteristics of the Participants
The participant enrolment process is shown in Figure 1. The baseline demographic features and laboratory indices of all 563 participants are shown in Table 1. The mean age of these adults was 77.36±6.1 years; 200 (35.52%) were men, and 363 (64.48%) were women. A total of 71 (12.61%) patients had a normal BMD and were aged 77.17 years (70~92). However, 314 (55.77%) patients aged 77.72 years (70~101) had a significantly reduced BMD and met the diagnostic criteria for osteoporosis. There were no obvious differences in the age, ALB, GLB, HbA1c, NLR, WBC count, lymphocyte count, neutrophils count, or PLT among the three groups (p > 0.05). Compared with those in the normal group, the percentages of women in the osteopenia group and the osteoporosis group were significantly greater (p< 0.05). Decreasing trends were observed in height, weight and BMI from the normal group to the osteoporosis group (p< 0.05). The Hb level tended to decrease across the three groups, with significant differences observed in pairwise comparisons (p< 0.05). Compared with those in the other two groups, the RBC count, TG, and uric acid levels in the osteoporosis group were lower (p< 0.05), whereas the TC, HDL-C, and LDL-C levels were higher than those in the other two groups (p< 0.05). A statistically significant difference in the MHR and TG/HDL-C between the osteoporosis group and the other groups was found (MHR in the normal group: 0.38 (0.31, 0.59), p<0.001; MHR in the osteopenia group: 0.41 (0.31, 0.53), p<0.001; MHR in the osteoporosis group: 0.31 (0.23, 0.43), p<0.001; TG/HDL-C in the normal group: 1.25 (0.91, 1.73), p<0.001; TG/HDL-C in the osteopenia group: 1.37 (0.87, 1.88), p<0.001; TG/HDL-C in the osteoporosis group: 0.85 (0.60, 1.35), p<0.001). The outcomes of the pairwise group comparisons revealed that the MHR value in the osteoporosis group was significantly lower than those in the other two groups (p<0.05). However, we observed no statistically significant disparity in MHR between the normal group and the osteopenia group.
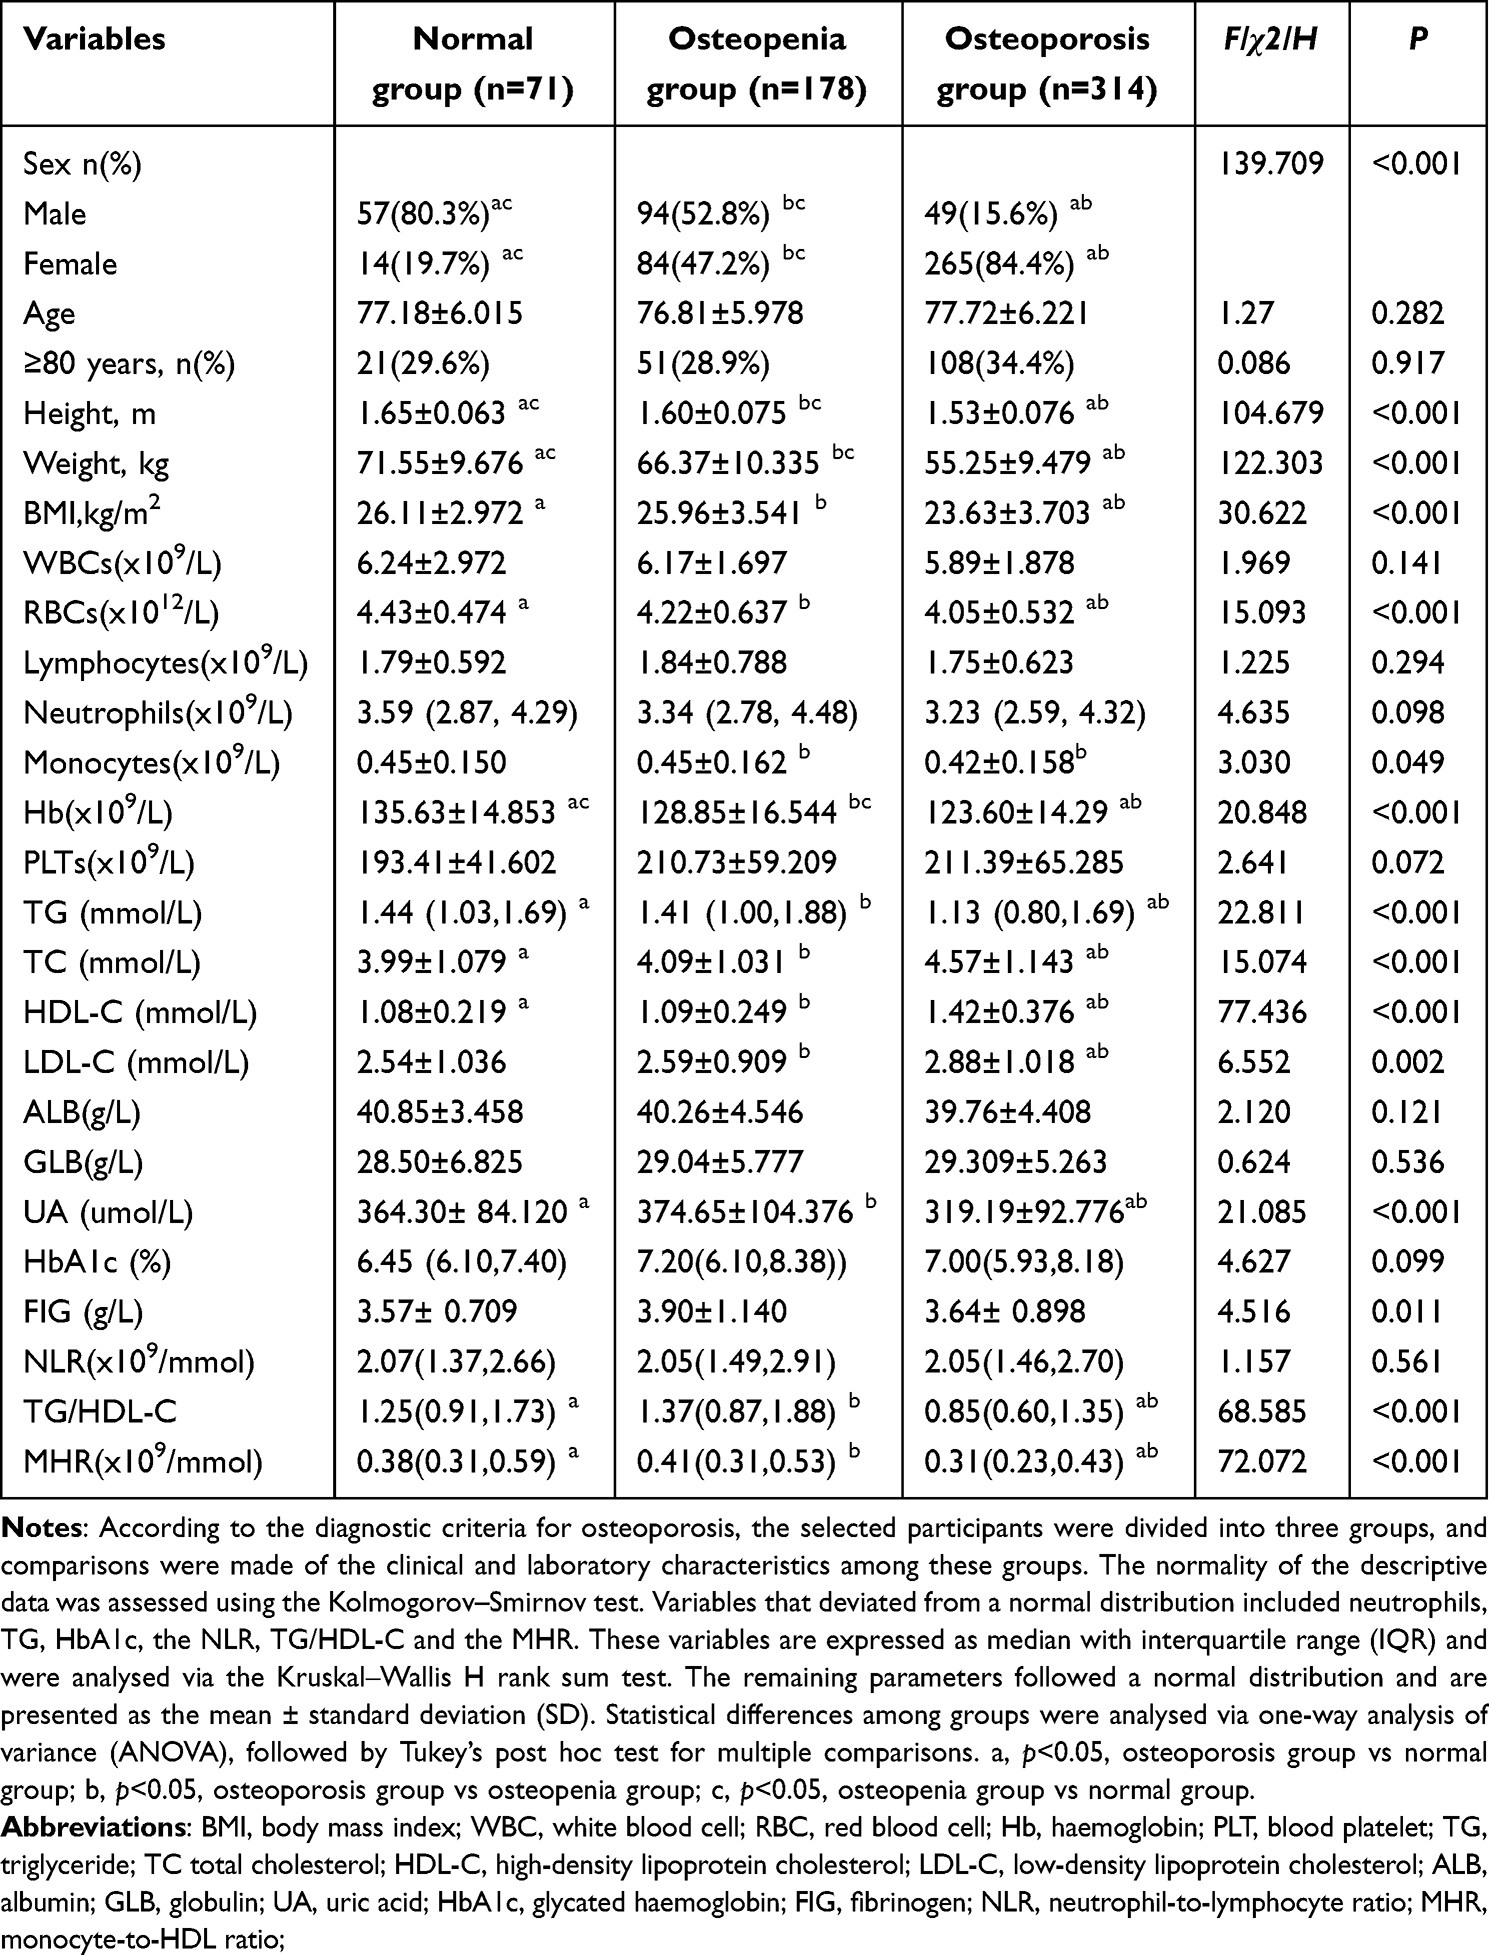 |
Table 1 Comparison of the Clinical and Laboratory Characteristics of the Participants Among the Three Groups |
 |
Figure 1 Flow diagram of the inclusion of participants in this study. Data were sourced from the Bone Density Test Room of Fujian Medical University Union Hospital between January 2017 and July 2022 (n=1907). A total of 563 older adults were included in this study. |
Subgroup Analysis by Age and Sex
Our data revealed a correlation between age and the incidence of osteoporosis. The data presented in Table 2 and Figure 2 demonstrate a positive correlation between age and the incidence of osteoporosis in both sexes, with a significantly greater incidence observed among women than men. The incidence rate of osteoporosis in centenarians reached 57.14% in men and 100% in women.
 |
Table 2 Distribution of Elderly Individuals Across Various Age Groups and Sexes Within Different Bone Metabolism Categories |
 |
Figure 2 Prevalence of osteoporosis among individuals of varying ages and sexes. The participants were categorized into three age groups (70–79, 80–89, and ≥90), and the prevalence of osteoporosis was positively correlated with advancing age and female sex. |
Correlations Between the MHR and BMD at Various Anatomical Sites
According to the data in Table 1, the MHR clearly significantly differed among the three groups. As the MHR data did not adhere to a normal distribution, Spearman correlation analysis was employed to investigate the association between bone mineral density and the MHR. The results revealed that the MHR was positively correlated with BMD (Figure 3). The main correlations between the MHR and BMD of the 563 participants are presented in Table 3. Spearman correlation analysis of bone mineral density and the MHR revealed that the MHR was significantly correlated with BMD of the lumbar spine (L1-L4), hip joint, femoral neck, Ward’s triangle, and greater trochanter. The correlation coefficients γ of the MHR and BMD at these sites were 0.376, 0.297, 0.244, 0.215 and 0.306, respectively (p<0.001). The correlation coefficients γ of the MHR and T score at various anatomical sites were 0.375, 0.293, 0.241, 0.222 and 0.310, respectively (p<0.001). The correlation coefficient revealed that the MHR had the strongest correlation with BMD of the lumbar spine. According to the criteria set by the World Health Organization, osteoporosis diagnosis in elderly individuals is based on the lowest T score obtained from bone mineral density measurements at various sites, such as the lumbar spine, femoral neck or total hip. The MHR of each subject was correlated with the lowest measured T score. The number of relative relationships was 0.362 (p<0.001).
 |
Table 3 Correlation Analysis Between the MHR and BMD at Different Locations |
 |
Figure 3 Correlation analysis showing a positive correlation between the MHR and BMD. Spearman correlation analysis revealed a significant positive correlation between the MHR and bone mineral density (γ=0.362, p<0.001). |
As shown in Table 4, the elderly participants were categorized into three groups on the basis of their age (70–79, 80–89, and ≥90 years). Notably, a significant association between the MHR and BMD was observed across different age cohorts. The correlation coefficient between the MHR and bone mineral density in individuals aged over 90 years was significantly greater than that in other age groups, indicating a stronger association between the MHR and BMD. Moreover, the correlation between the MHR and BMD of the femoral neck was the greatest (γ=0.582, p=0.001).
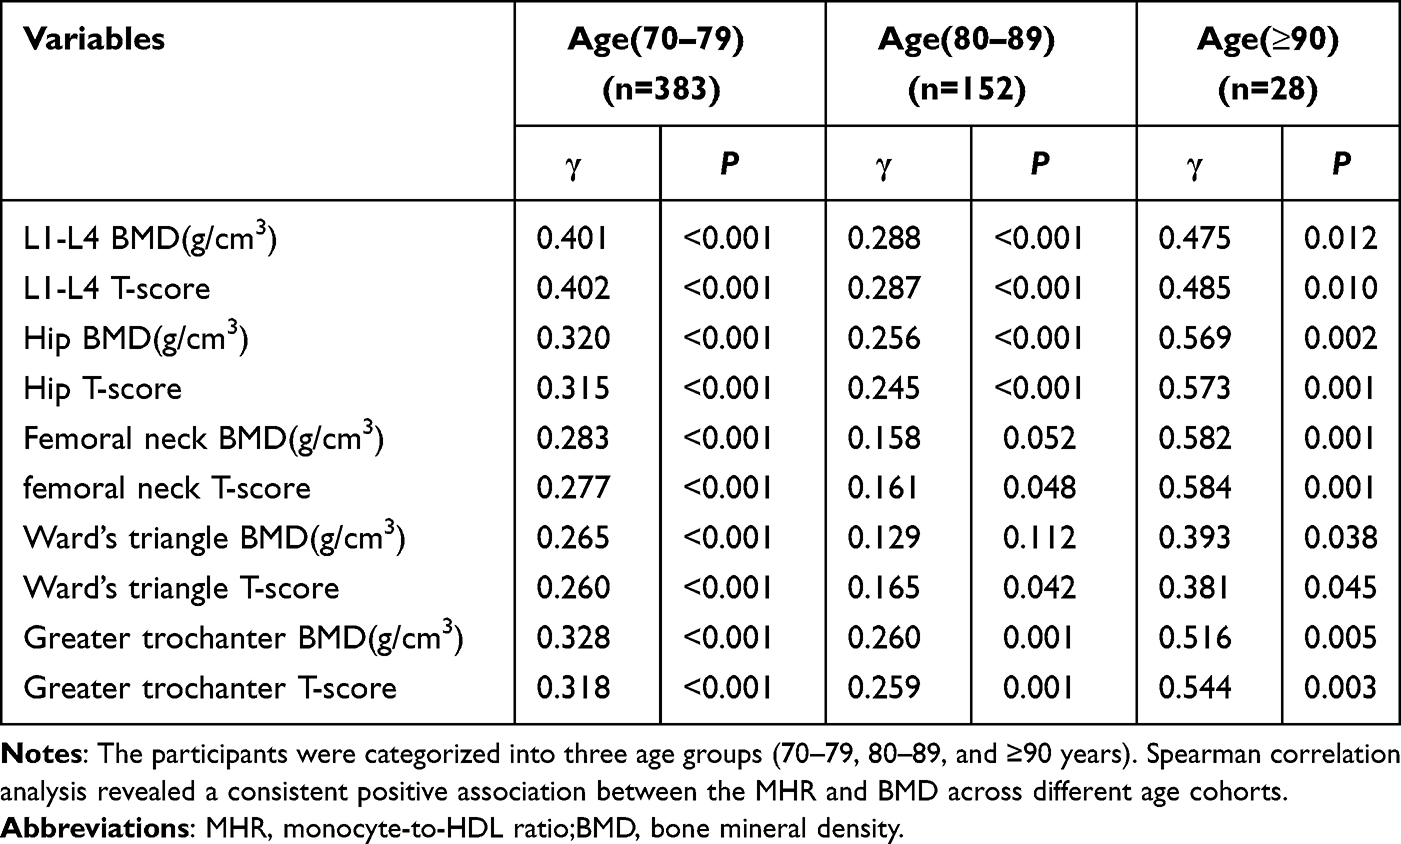 |
Table 4 Correlation Analysis Between the MHR and BMD at Different Locations Across Different Age Groups |
Bone Mineral Density of Participants in the MHR Quartile
The bone mineral density and T scores of all 563 patients based on MHR quartiles are shown in Table 5. The MHR was divided into quartiles with the following values: M1 ≤0.240; 0.240 < M2 ≤ 0.323; 0.323< M3 ≤ 0.455; and M4 > 0.455. As expected, increasing trends were also observed in the L1‒L4 BMD, L1‒L4 T score, hip BMD, hip T score, femoral neck BMD, femoral neck T score, Ward’s triangle BMD, Ward’s triangle T score, greater trochanter BMD and greater trochanter T score (p < 0.001) with increasing MHR. The incidence of osteoporosis in the M1 segment was the highest, reaching an alarming rate of 81.43% (p < 0.001). The BMD T score in the MHR, grouped by quartile, was significantly different according to the results of one-way analysis of variance (ANOVA) followed by the Tukey’s test (F=22.862, p < 0.001). Figure 4 clearly shows that the average BMD T score in the lower MHR quartile group was significantly lower (M1: −3.025±1.107; M2: −2.538±1.216; M3: −2.322±1.272; M4: −1.867±1.170), indicating a higher prevalence of osteoporosis among individuals with lower MHR values (p < 0.001).
 |
Table 5 BMD of Participants from Different Locations Based on MHR Quartiles |
 |
Figure 4 Distribution of BMD T scores according to MHR quartile. The MHR was divided into quartiles with the following values: M1 ≤0.240; 0.240 < M2 ≤ 0.323; 0.323< M3 ≤ 0.455; and M4 > 0.455. The BMD T score (y-axis) demonstrated that the lower the MHR was, the lower the BDM T score was. Box plots represent the interquartile range (first, median and third quantiles), with dots representing individual participants. The halfviolin plots represent the sample density. |
Univariate Logistic Regression of the Risk Factors for Osteoporosis
To explore the risk factors for osteoporosis, univariate logistic regression analyses were performed to identify the general information and blood indicators that were correlated with the incidence. Univariate logistic analyses revealed that the factors associated with osteoporosis were sex, height, weight, BMI, the number of red blood cells, the number of monocytes, haemoglobin, triglycerides, total cholesterol, LDL-C, HDL-C, uric acid levels, TG/HDL-C and the MHR (Table 6). The parameters associated with blood lipids are considered risk factors for osteoporosis. However, the NLR was not correlated with the risk of osteoporosis (p=0.459>0.05). The MHR and TG/HDL-C ratio were significantly correlated with the risk of osteoporosis, with lower values of the MHR and TG/HDL indicating a greater susceptibility to osteoporosis (OR, 0.018; 95% CI, 0.006–0.054; p<0.001; and OR, 0.441; 95% CI, 0.342–0.570; p<0.001, respectively).
 |
Table 6 Univariate Logistic Regression of the Risk Factors for Osteoporosis |
Multivariate Logistic Regression of the Risk Factors for Osteoporosis
The presence of osteoporosis in elderly patients was considered the dependent variable; repeated calculations of the indicators were excluded; and all of the factors were included in the multivariate logistic regression analysis (Table 7). Additionally, the backwards stepwise method was used to screen variables and determine the final regression model, which included sex, age, BMI, white blood cell count, triglyceride, total cholesterol, LDL-C, albumin, uric acid and MHR. The results revealed that age (OR, 1.071; 95% CI, 1.028–1.115), female sex (OR, 11.877; 95% CI, 6.968–20.245), BMI (OR, 0.837; 95% CI, 0.783–0.895), white blood cell count (OR, 1.186; 95% CI, 1.010–1.393), triglyceride level (OR, 0.464; 95% CI, 0.327–0.660), total cholesterol level (OR, 4.566; 95% CI, 2.314–9.766),LDL-C level (OR, 0.261; 95% CI, 0.119–0.571), albumin level (OR, 0.929; 95% CI, 0.876–0.985) and the MHR (OR, 0.061; 95% CI, 0.010–0.378) were independent risk factors for osteoporosis in older adults (Table 7). The analysis revealed that the risk of osteoporosis increases with lower values of BMI, TG, LDL-C, ALB and MHR. Conversely, the risk of osteoporosis increases with higher values of age, WBCs and TC. The results indicated that older adults with the above factors were more likely to experience osteoporosis than their counterparts without these factors were (p<0.05).
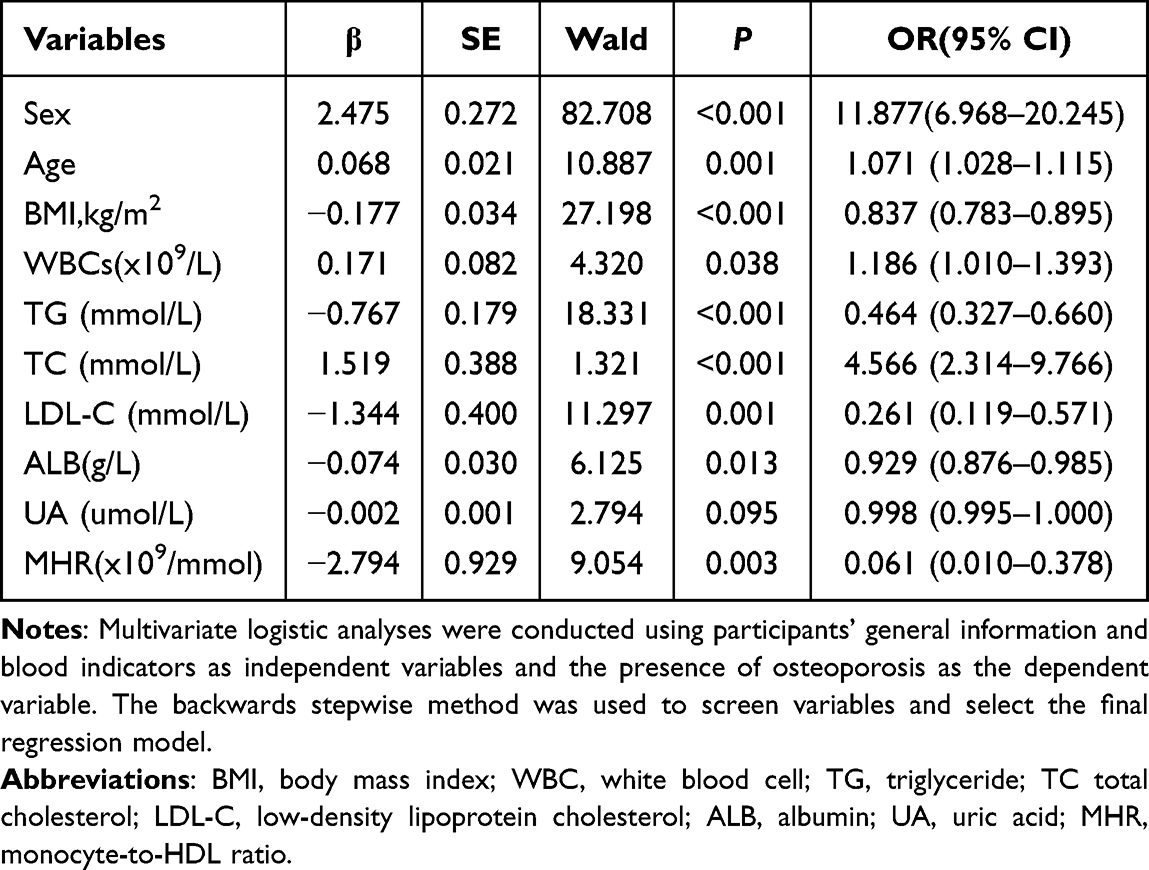 |
Table 7 Multivariate Logistic Regression of the Risk Factors for Osteoporosis |
Analysis of ROC Curves
The independent risk factors obtained above (with the exception of sex) were subjected to ROC curve analysis to assess their predictive value for osteoporosis in elderly individuals (refer to Table 8). According to the data presented in Table 8, the area under the curve (AUC) of the MHR and BMI was the highest, indicating that these two indicators have superior predictive efficacy for senile osteoporosis compared with other risk factors. The AUC for BMI was 0.688 (95% CI: 0.645–0.731, p < 0.001), the best cut-off value was 24.74 kg/m2, the Youden index was 0.312, the sensitivity was 66.3%, and the specificity was 65.0%. The AUC for the MHR was 0.710 (95% CI: 0.668~0.752, p < 0.0001), the optimal cut-off value was 0.308×10⁹/mmol, and the Youden index was 0.334, yielding a specificity of 59.9% and a sensitivity of 73.5% (Figure 5). The above results showed that the MHR has the highest AUC value and has good diagnostic potential for osteoporosis in elderly individuals.
 |
Table 8 Receiver Operating Characteristic Curve Analysis of the Risk Factors for Osteoporosis |
 |
Figure 5 Receiver operating characteristic curves for the cut-off values of the MHR and BMI for identifying osteoporosis. The predictive value of the MHR for osteoporosis in elderly individuals is greater than that of BMI, with an ROC curve area of 0.710, an optimal cut-off value of 0.308(×109/mmol), a sensitivity of 73.5%, and a specificity of 59.9%. |
Discussion
As society ages, osteoporosis has emerged as a prevalent chronic metabolic ailment among the elderly population that specifically results in detrimental outcomes such as fractures, posing significant threats to individuals’ well-being and imposes substantial economic burdens on both families and society. Our study focused on the associations between the MHR and the occurrence and severity of senile osteoporosis. The results of our study revealed a positive correlation between the MHR and BMD, with individuals in the lower quartile of the MHR group exhibiting a higher incidence of osteoporosis among adults aged 70 years and older. Moreover, the MHR was also an independent risk factor for osteoporosis in older adults and seemed to have a greater predictive value for osteoporosis in 70-year-old and older adults.
With age, the incidence of osteoporosis increases, as does the incidence of bone resorption and fragility. Senile osteoporosis, a condition associated with ageing, affects both sexes and is commonly observed in individuals aged 70 years or older.16 The average age of patients with osteoporotic fractures exceeds 70 years.17,18 Therefore, the participants in this study were exclusively individuals aged 70 years and older. Our study also revealed that the severity of osteoporosis increased progressively with advancing age. In addition, we found a significantly greater proportion of women in the osteoporosis group than in the normal group. The occurrence of osteoporosis increases with age in both sexes, reaching 100% in women older than 90 years. The susceptibility of elderly women to osteoporosis may be attributed to oestrogen deficiency. Previous studies have demonstrated that postmenopausal women experience reduced levels of osteoprotective hormone (OPG) due to oestrogen insufficiency, which promotes local bone inflammation and increases inflammatory cytokine expression. Conversely, increased expression of inflammatory factors can increase osteoclast activity, exacerbating bone loss and ultimately leading to osteoporosis.19 The differentiation of osteoblasts can be modulated by androgens via their interaction with androgen receptors on osteoblasts, or they may confer a bone-protective effect through conversion into oestrogen via aromatization.20 Age-related decreases in circulating testosterone levels and other male steroid hormones are adverse risk factors for the pathogenesis of osteoporosis.21
The pathogenesis of senile osteoporosis involves multiple factors and mechanisms, with the age-related decline in organ function being the primary determinant. During the process of ageing, epigenetic metabolic alterations in physiology contribute to the development of chronic inflammation, ultimately leading to osteoporosis.22 Multiple investigations have underscored the robust associations between inflammatory processes and various pathological factors connected to nutritional status, vascular function, and bone metabolic activity. The outcome for patients with these conditions has been linked to the degree of inflammation, a connection substantiated by numerous longitudinal cohort studies.23–26 These elements are likely to be pivotal in the onset and progression of osteoporosis. Age-driven changes in the status of immune cells explain the occurrence of chronic inflammation resulting in osteoporosis.27 Historically, monocytes were presumed to be precursor cells for macrophages and dendritic cells (DCs). Monocytes extravasating from blood vessels to sites of inflammation differentiate into macrophages or dendritic cells and contribute to inflammatory processes and repair.28 Recent research has revealed that monocytes can actively participate in the inflammatory process rather than solely functioning as precursors.29,30 Proteomic analysis of peripheral blood mononuclear cells (PBMCs) from individuals with low bone mineral density revealed upregulation of the ANXA2 protein. Subsequent investigations demonstrated the importance of ANXA2 in facilitating monocyte migration across the endothelial barrier. Consequently, the increased expression of ANXA2 likely promotes increased monocyte migration rates from the bloodstream to bone tissue, subsequently leading to differentiation into osteoclasts and contributing to bone resorption activity.31 Our study also revealed a significant difference in monocyte counts between the osteoporosis group and the other two groups, with particular statistical significance observed when the osteoporosis group was compared with the bone loss group (p<0.05). However, our findings suggest that the number of monocytes in the osteoporosis group was lower than that in the other two groups, which contradicts the findings of previous studies.32,33 To explain this inconsistency, we propose multiple contributing factors. First, our recruited patients were characterized by an advanced mean age, which is known to be associated with diminished monocyte functionality due to ageing effects. Second, chronic inflammation within the bone microenvironment was aggravated, particularly among those diagnosed with osteoporosis, thus promoting enhanced migration of circulating monocytes towards bone tissue while concurrently diminishing monocyte presence within the peripheral circulation.
In the past few years, there has been a gradually increasing volume of data documenting a strong connection between fat and bone metabolism. In fact, several older studies have suggested that weight gain plays a preventive role in mitigating bone loss and the onset of osteoporosis.34,35 Our study also revealed that the BMI of the osteoporosis group was significantly lower than that of the normal group and the osteopenia group. However, according to more recent studies, the incidence of osteoporosis and bone fractures is greater in obese individuals than in individuals with a normal weight.36 The findings of our study also revealed a statistically significant increase in blood lipid indices in individuals with osteoporosis compared with those in the other two groups (p<0.05). Cholesterol and its metabolites influence bone homeostasis by modulating the differentiation and activation of osteoblasts and osteoclasts.37 The serum cholesterol concentration was negatively correlated with both BMD and the level of bone transformation markers.38 HDL-C and its major apolipoprotein (APOA1) were reported to directly interact with osteoblasts and osteoclasts. Several studies have demonstrated the impact of HDL-C and APOA1 on osteoblast and osteoclast formation as well as on patient survival.39–41 Clinical studies have also shown a direct correlation between HDL-C and osteoporosis, but the correlation between HDL-C and BMD remains inconclusive, with potential variations based on race and hormonal status.32 Additionally, HDL-C levels are negatively correlated with BMD in the Chinese population,42 which is consistent with the results of our study.
With increasing age, all systems of elderly individuals, such as chronic proinflammatory responses,43 immune ageing,44 lipids, blood glucose and other metabolic disorders, lipid accumulation, and abnormal glucose tolerance,45 change. Therefore, the use of a single index as an evaluation standard for geriatric diseases has inherent limitations. The monocyte-to-HDL-C ratio (MHR) not only is a simple and efficient calculation method but also incorporates multiple factors, which are believed to be closely related to inflammatory activity and changes in lipid profiles, thereby surpassing the limitations of single indicators. Capturing the complementary relationships between different pathways enables a more accurate depiction of osteoporosis changes in older adults. Several studies have suggested a potential association between the MHR and osteoporosis;32,46 however, there is a lack of data specifically focusing on the elderly population, and the majority of the subjects in previous studies had an average age of approximately 60 years. In our study, we included individuals aged ≥70 years, with an average age of 77 years in each group. Notably, we included centenarians in the osteoporosis group, which has been less explored in previous relevant research. We also observed a more robust association between the MHR and BMD in individuals aged ≥90 years, thereby reinforcing the significance of identifying the MHR in the geriatric population. Additionally, we analysed the NLR, TG/HDL ratio, and other indicators previously mentioned in research related to osteoporosis-related research; nevertheless, no statistically significant differences were observed among the groups (Table 1 and Table 7). We postulate that the observed phenomenon can be attributed to the limitations of employing a single system as an evaluative index in the geriatric population, owing to the distinctive nature of their physical functionality, as mentioned above.
We found by univariate logistic analysis that the MHR, BMI, sex and other indicators were related to the occurrence of osteoporosis. TG/HDL-C and the MHR were significantly correlated with the risk of osteoporosis (OR, 0.441; 95% CI, 0.342–0.570; p<0.001; and OR, 0.018; 95% CI, 0.006–0.054; p<0.001, respectively). Multivariate logistic regression analysis was further conducted, and we demonstrated that indicators such as BMI and the MHR were independently associated with osteoporosis incidence. Numerous studies have consistently demonstrated a greater incidence of osteoporosis among elderly women than among men. Consequently, we further investigated the predictive value of additional independent risk factors beyond sex in elderly individuals with osteoporosis via ROC curve analysis. To our surprise, the results of our study also revealed that the MHR and BMI were not only independent risk factors for osteoporosis but also seemed to have good value for identifying osteoporosis, with relatively high AUC values of 0.710 and 0.688, respectively. Our findings suggest a stronger correlation between the MHR and BMD in the oldest-old population, indicating that the MHR may serve as a potential indicator of osteoporosis in older adults in China. However, further longitudinal studies are warranted to validate these findings.
The correlation observed between the MHR and disease incidence underscores the potential of the MHR as a robust indicator for predicting osteoporosis in older adults, which is a key strength of this study. However, we also observed variability in a portion of the data from our findings. We observed a positive correlation between the MHR and bone mineral density, as well as the incidence of osteoporosis, via both Spearman correlation analysis and statistical analysis of the MHR quartile groups (p<0.001). The outcomes of the pairwise group comparisons revealed that the MHR value in the osteoporosis group was significantly lower than those in the other two groups (p<0.05). Although, according to Table 1, we noted that the median MHR was highest among individuals in the osteopenia group. However, through pairwise comparison analysis between groups, we observed no statistically significant disparity in MHR between the normal group and the osteopenia group. Consequently, the elevated median value observed in the osteopenia group did not reach statistical significance. We attribute this phenomenon to the limited sample size included in this study. In addition, certain limitations need to be acknowledged. First, owing to the retrospective nature of our research design, large-scale prospective studies need to be conducted to validate our findings. Second, the relatively small sample size consisting solely of patients from our hospital’s physical examination population limits the generalizability of our results. Therefore, future investigations should aim to include multiple medical centres and increase the number of patients analysed. Finally, despite these significant findings, the specific mechanisms underlying how the MHR influences the onset and progression of osteoporosis remain unknown; thus, further comprehensive studies are needed.
We focused on the predictive value of the MHR, which is detectable in primary hospitals and communities for elderly patients, aiming to facilitate its promotion in these settings and to remind elderly patients to undergo further relevant examinations and treatments for osteoporosis. According to the inclusion criteria and findings of our study, we speculate that the MHR may serve as a particularly promising biomarker for predicting osteoporosis in the oldest old population, particularly in community and primary care settings where testing resources are limited. Additionally, it may also be valuable in assessing elderly individuals with multiple chronic conditions. Additionally, we acknowledge that the AUC value of the MHR in our study was only 0.710, indicating its limited predictive value for osteoporosis in elderly individuals. However, this study incorporated real-world data from the elderly population, and the AUC value of the MHR was greater than that of other factors, suggesting its superior predictive value compared with other factors. By addressing our limitations, such as expanding the sample size and including multicentre data, we anticipate obtaining more favourable outcomes in future research.
Conclusion
This study demonstrated a correlation between the MHR and osteoporosis in elderly patients. A low MHR was associated with a greater risk of senile osteoporosis. Although this study has certain limitations, the MHR demonstrated potential for utilization in conjunction with other diagnostic methods or markers. Given its easy accessibility, the MHR can be used to help detect cases of senile osteoporosis in clinical practice, thereby contributing to early intervention and treatment of this condition.
Acknowledgments
We would like to express our gratitude to all those who exerted their efforts in completing this study.
Funding
This work was supported by the China National Key R&D Program (No. 2020YFC2008606), the Top Hospital and Specialty Excellence of Fujian Province [No. 2021 (76)], and the Excellent Young Scholars Cultivation Project of Fujian Medical University Union Hospital (No. 2022XH033).
Disclosure
The authors declare that there are no conflicts of interest related to this work.
References
1. Bijlsma AY, Meskers CG, Westendorp RG, Maier AB. Chronology of age-related disease definitions: osteoporosis and sarcopenia. Ageing Res Rev. 2012;11(2):320–324. doi:10.1016/j.arr.2012.01.001
2. Zhu Z, Yu P, Wu Y, et al. Sex specific global burden of osteoporosis in 204 countries and territories, from 1990 to 2030: an age-period-cohort modeling study. J Nutr Health Aging. 2023;27(9):767–774. doi:10.1007/s12603-023-1971-4
3. Nuti R, Brandi ML, Checchia G, et al. Guidelines for the management of osteoporosis and fragility fractures. Intern Emerg Med. 2019;14(1):85–102. doi:10.1007/s11739-018-1874-2
4. Salari N, Darvishi N, Bartina Y, et al. Global prevalence of osteoporosis among the world older adults: a comprehensive systematic review and meta-analysis. J Orthop Surg Res. 2021;16(1):669. doi:10.1186/s13018-021-02821-8
5. Johnston CB, Dagar M. Osteoporosis in older adults. Med Clin North Am. 2020;104(5):873–884. doi:10.1016/j.mcna.2020.06.004
6. Iantomasi T, Romagnoli C, Palmini G, et al. Oxidative stress and inflammation in osteoporosis: molecular mechanisms involved and the relationship with microRNAs. Int J Mol Sci. 2023;24(4):3772. doi:10.3390/ijms24043772
7. Mundy GR. Osteoporosis and inflammation. Nutr Rev. 2007;65(12 Pt 2):S147–51. doi:10.1111/j.1753-4887.2007.tb00353.x
8. Adamopoulos IE. Inflammation in bone physiology and pathology. Curr Opin Rheumatol. 2018;30(1):59–64. doi:10.1097/BOR.0000000000000449
9. Mulholland BS, Forwood MR, Morrison NA. Monocyte chemoattractant protein-1 (MCP-1/CCL2) drives activation of bone remodelling and skeletal metastasis. Curr Osteoporos Rep. 2019;17(6):538–547. doi:10.1007/s11914-019-00545-7
10. Papachristou NI, Blair HC, Kypreos KE, Papachristou DJ. High-density lipoprotein (HDL) metabolism and bone mass. J Endocrinol. 2017;233(2):R95–R107. doi:10.1530/JOE-16-0657
11. Jiang M, Yang J, Zou H, Li M, Sun W, Kong X. Monocyte-to-high-density lipoprotein-cholesterol ratio (MHR) and the risk of all-cause and cardiovascular mortality: a nationwide cohort study in the United States. Lipids Health Dis. 2022;21(1):30. doi:10.1186/s12944-022-01638-6
12. Kim HB, Kim A, Kim Y, et al. Associations of serum monocyte-to-high-density lipoprotein cholesterol ratio with digital ulcers and skin fibrosis in patients with systemic sclerosis. Scand J Rheumatol. 2021;50(3):231–238. doi:10.1080/03009742.2020.1837237
13. Li C, Fan H, Liu Y, et al. The monocyte to high-density lipoprotein cholesterol ratio and outcomes in type 2 diabetes mellitus patients with non-ST-segment elevation acute coronary syndrome. Ann Transl Med. 2021;9(21):1627. doi:10.21037/atm-21-4876
14. Li Q, Lin X, Bo X, et al. Monocyte to high-density lipoprotein cholesterol ratio predicts poor outcomes in ischaemic heart failure patients combined with diabetes: a retrospective study. Eur J Med Res. 2023;28(1):493. doi:10.1186/s40001-023-01451-6
15. Ruan C, Li Y, Ran Z, et al. Association between monocyte-to-high-density lipoprotein ratio and prediabetes: a cross-sectional study in Chinese population. Diabetes Metab Syndr Obes. 2024;17:1093–1103. doi:10.2147/DMSO.S451189
16. Qadir A, Liang S, Wu Z, Chen Z, Hu L, Qian A. Senile osteoporosis: the involvement of differentiation and senescence of bone marrow stromal cells. Int J Mol Sci. 2020;21(1):349. doi:10.3390/ijms21010349
17. Wang O, Hu Y, Gong S, et al. A survey of outcomes and management of patients post fragility fractures in China. Osteoporos Int. 2015;26(11):2631–2640. doi:10.1007/s00198-015-3162-6
18. Guzon-Illescas O, Perez Fernandez E, Crespi Villarias N, et al. Mortality after osteoporotic hip fracture: incidence, trends, and associated factors. J Orthop Surg Res. 2019;14(1):203. doi:10.1186/s13018-019-1226-6
19. Barbour KE, Lui LY, Ensrud KE, et al. Inflammatory markers and risk of hip fracture in older white women: the study of osteoporotic fractures. J Bone Miner Res. 2014;29(9):2057–2064. doi:10.1002/jbmr.2245
20. Nakamura T, Imai Y, Matsumoto T, et al. Estrogen prevents bone loss via estrogen receptor alpha and induction of Fas ligand in osteoclasts. Cell. 2007;130(5):811–823. doi:10.1016/j.cell.2007.07.025
21. Vescini F, Chiodini I, Falchetti A, et al. Management of osteoporosis in men: a narrative review. Int J Mol Sci. 2021;22(24):13640. doi:10.3390/ijms222413640
22. Ferrucci L, Fabbri E. Inflammageing: chronic inflammation in ageing, cardiovascular disease, and frailty. Nat Rev Cardiol. 2018;15(9):505–522. doi:10.1038/s41569-018-0064-2
23. Tan Y, Li Y, Huang X, et al. The ratio of red blood cell distribution width to albumin as a predictor for rehospitalization risk and rehospitalization all-cause mortality in middle-aged and elderly survivors with sepsis: an ambispective ICU cohort study. J Inflamm Res. 2024;17:1227–1240. doi:10.2147/JIR.S451769
24. Pan J, Xu G, Zhai Z, et al. Geriatric nutritional risk index as a predictor for fragility fracture risk in elderly with type 2 diabetes mellitus: a 9-year ambispective longitudinal cohort study. Clin Nutr. 2024;43(5):1125–1135. doi:10.1016/j.clnu.2024.03.032
25. Wei R, Chen S, Huang X, et al. The triglyceride glucose index as a sensitive predictor for the risk of MACCEs in patients with diabetic foot ulcers: an ambispective longitudinal cohort study. Int Wound J. 2024;21(4):e14874. doi:10.1111/iwj.14874
26. Huang X, Han J, Nong Y, et al. Triglyceride-glucose index is strongly associated with all-cause mortality in elderly females with diabetic foot ulcers: a 9-year follow-up study. Int Wound J. 2024;21(1):e14344. doi:10.1111/iwj.14344
27. Yarbro JR, Emmons RS, Pence BD. Macrophage immunometabolism and inflammaging: roles of mitochondrial dysfunction, cellular senescence, CD38, and NAD. Immunometabolism. 2020;2(3):e200026. doi:10.20900/immunometab20200026
28. Auffray C, Sieweke MH, Geissmann F. Blood monocytes: development, heterogeneity, and relationship with dendritic cells. Annu Rev Immunol. 2009;27(1):669–692. doi:10.1146/annurev.immunol.021908.132557
29. Kratofil RM, Kubes P, Deniset JF. Monocyte conversion during inflammation and injury. Arterioscler Thromb Vasc Biol. 2017;37(1):35–42. doi:10.1161/ATVBAHA.116.308198
30. Jakubzick C, Gautier EL, Gibbings SL, et al. Minimal differentiation of classical monocytes as they survey steady-state tissues and transport antigen to lymph nodes. Immunity. 2013;39(3):599–610. doi:10.1016/j.immuni.2013.08.007
31. Deng FY, Lei SF, Zhang Y, et al. Peripheral blood monocyte-expressed ANXA2 gene is involved in pathogenesis of osteoporosis in humans. Mol Cell Proteomics. 2011;10(11):M111011700. doi:10.1074/mcp.M111.011700
32. Huang R, Chen Y, Tu M, Wang W. Monocyte to high-density lipoprotein and apolipoprotein A1 ratios are associated with bone homeostasis imbalance caused by chronic inflammation in postmenopausal women with type 2 diabetes mellitus. Front Pharmacol. 2022;13:1062999. doi:10.3389/fphar.2022.1062999
33. Gao K, Zhu W, Liu W, et al. The predictive role of monocyte-to-lymphocyte ratio in osteoporosis patient. Medicine. 2019;98(34):e16793. doi:10.1097/MD.0000000000016793
34. Reid IR, Ames RW, Evans MC, Sharpe SJ, Gamble GD. Determinants of the rate of bone loss in normal postmenopausal women. J Clin Endocrinol Metab. 1994;79(4):950–954. doi:10.1210/jcem.79.4.7962303
35. Reid IR. Relationships between fat and bone. Osteoporos Int. 2008;19(5):595–606. doi:10.1007/s00198-007-0492-z
36. Cao JJ. Effects of obesity on bone metabolism. J Orthop Surg Res. 2011;6(1):30. doi:10.1186/1749-799X-6-30
37. Yin W, Li Z, Zhang W. Modulation of bone and marrow niche by cholesterol. Nutrients. 2019;11(6):1394. doi:10.3390/nu11061394
38. Yang Y, Liu G, Zhang Y, et al. Association between bone mineral density, bone turnover markers, and serum cholesterol levels in type 2 diabetes. Front Endocrinol. 2018;9:646. doi:10.3389/fendo.2018.00646
39. Papachristou DJ, Blair HC. Bone and high-density lipoprotein: the beginning of a beautiful friendship. World J Orthop. 2016;7(2):74–77. doi:10.5312/wjo.v7.i2.74
40. Blair HC, Kalyvioti E, Papachristou NI, et al. Apolipoprotein A-1 regulates osteoblast and lipoblast precursor cells in mice. Lab Invest. 2016;96(7):763–772. doi:10.1038/labinvest.2016.51
41. Huang X, Lv Y, He P, et al. HDL impairs osteoclastogenesis and induces osteoclast apoptosis via upregulation of ABCG1 expression. Acta Biochim Biophys Sin. 2018;50(9):853–861. doi:10.1093/abbs/gmy081
42. Cui R, Zhou L, Li Z, Li Q, Qi Z, Zhang J. Assessment risk of osteoporosis in Chinese people: relationship among body mass index, serum lipid profiles, blood glucose, and bone mineral density. Clin Interv Aging. 2016;11:887–895. doi:10.2147/CIA.S103845
43. Furman D, Campisi J, Verdin E, et al. Chronic inflammation in the etiology of disease across the life span. Nat Med. 2019;25(12):1822–1832. doi:10.1038/s41591-019-0675-0
44. Franceschi C, Bonafe M, Valensin S, et al. Inflamm-aging. An evolutionary perspective on immunosenescence. Ann N Y Acad Sci. 2000;908(1):244–254. doi:10.1111/j.1749-6632.2000.tb06651.x
45. Guo J, Huang X, Dou L, et al. Aging and aging-related diseases: from molecular mechanisms to interventions and treatments. Signal Transduct Target Ther. 2022;7(1):391. doi:10.1038/s41392-022-01251-0
46. Zhou F, Wu L, Shen G, et al. Association between monocyte to high-density lipoprotein-cholesterol ratio and osteoporosis: an analysis of the national health and nutrition examination survey 2013-2014. J Investig Med. 2024;72(1):3–12. doi:10.1177/10815589231204057
 © 2024 The Author(s). This work is published and licensed by Dove Medical Press Limited. The
full terms of this license are available at https://www.dovepress.com/terms.php
and incorporate the Creative Commons Attribution
- Non Commercial (unported, 3.0) License.
By accessing the work you hereby accept the Terms. Non-commercial uses of the work are permitted
without any further permission from Dove Medical Press Limited, provided the work is properly
attributed. For permission for commercial use of this work, please see paragraphs 4.2 and 5 of our Terms.
© 2024 The Author(s). This work is published and licensed by Dove Medical Press Limited. The
full terms of this license are available at https://www.dovepress.com/terms.php
and incorporate the Creative Commons Attribution
- Non Commercial (unported, 3.0) License.
By accessing the work you hereby accept the Terms. Non-commercial uses of the work are permitted
without any further permission from Dove Medical Press Limited, provided the work is properly
attributed. For permission for commercial use of this work, please see paragraphs 4.2 and 5 of our Terms.
Recommended articles
Systemic Inflammation Markers Associated with Bone Mineral Density in perimenopausal and Postmenopausal Women
Chen Y, Yu J, Shi L, Han S, Chen J, Sheng Z, Deng M, Jin X, Zhang Z
Journal of Inflammation Research 2023, 16:297-309
Published Date: 22 January 2023
Cannabidiol (CBD) Upregulates Vitamin D3 Receptors (VDRs) Expression That Modulates Cytokines (TNF-α, IL-6), Tissue Elasticity, Cellular Senescence, and Mitochondrial ATP Generation in Human and Rodent Cell Lines

Trivedi MK, Branton A, Trivedi D, Mondal S, Jana S
Nutrition and Dietary Supplements 2023, 15:91-100
Published Date: 6 November 2023
The Interplay of Aging and PANoptosis in Osteoarthritis Pathogenesis: Implications for Novel Therapeutic Strategies
Liu S, Zhang G, Li N, Wang Z, Lu L
Journal of Inflammation Research 2025, 18:1951-1967
Published Date: 10 February 2025