")
Back to Journals » Journal of Inflammation Research » Volume 17
The Predictive Value of TyG Index and NLR for Risk of CHD and the Severity of Coronary Artery Lesions in Patients with Type 2 Diabetes Mellitus
Authors Li H, Chen M, Wang Y, Cui W, Lou Y, Chen D, Deng H, Shen Z
Received 15 September 2024
Accepted for publication 21 November 2024
Published 28 December 2024 Volume 2024:17 Pages 11813—11828
DOI https://doi.org/10.2147/JIR.S496419
Checked for plagiarism Yes
Review by Single anonymous peer review
Peer reviewer comments 3
Editor who approved publication: Professor Ning Quan
Haixia Li,1 Mingxian Chen,2 Youhua Wang,3 Weilu Cui,1 Yuqing Lou,1 Dong Chen,4 Haiming Deng,5 Zican Shen6
1Department of Cardiology, Guang’anmen Hospital, China Academy of Chinese Medical Sciences, Beijing, People’s Republic of China; 2Department of Gastroenterology, Tongde Hospital of Zhejiang Province, Zhejiang, People’s Republic of China; 3Department of Cardiology, Longhua Hospital, Shanghai University of Traditional Chinese Medicine, Shanghai, People’s Republic of China; 4Department of Oncology, Beijing Hospital of Traditional Chinese Medicine, Capital Medical University, Beijing, People’s Republic of China; 5Department of Cardiology, Pingxiang People’s Hospital, Pingxiang, Jiangxi, People’s Republic of China; 6Department of Cardiology, Renmin Hospital of Wuhan University, Wuhan, Hubei, People’s Republic of China
Correspondence: Zican Shen, Department of Cardiology, Renmin Hospital of Wuhan University, Wuhan, Hubei, 430000, People’s Republic of China, Email [email protected] Haiming Deng, Department of Cardiology, Pingxiang People’s Hospital, Pingxiang, Jiangxi, 337000, People’s Republic of China, Email [email protected]
Background: There is a paucity of research examining the Triglyceride-glucose (TyG) index and Neutrophil-to-lymphocyte ratio (NLR) in relation to the onset and severity of coronary heart disease (CHD) in individuals with type 2 diabetes mellitus (T2DM). This study aims to explore the relationship between these biomarkers and the risk of CHD in T2DM patients and clarify their association with the CHD severity.
Methods: A total of 518 patients with T2DM who underwent coronary angiography (CAG) were included and categorized into either the T2DM group or the T2DM combined with CHD group based on the angiographic findings. The association of the TyG index and NLR with CHD and its severity were validated by logistic regression analyses. The predictive efficacy of both biomarkers, individually and in combination, for CHD was evaluated using receiver operating characteristic (ROC) curves.
Results: Among the 518 patients with T2DM, 396 individuals were identified as having a combination of CHD of varying severity. Multifactorial logistic regression analysis showed that after adjusting for age, sex, smoking, hypertension, and history use of glucose- and lipid-lowering medications, both TyG index and NLR were risk factors for CHD in T2DM patients (TyG index: OR:3.89, 95% CI:2.60– 5.82; NLR: OR:1.44, 95% CI:1.22– 1.71; all P< 0.05). The odds ratios(OR) for the highest tertile compared to the lowest tertile of TyG index and NLR were 3.61(95% CI:2.41– 5.40) and 1.62(95% CI:1.25– 2.09).The TyG index exhibited a significant correlation with CHD severity in T2DM patients (OR:2.96, 95% CI:1.19– 7.32; P=0.019). The areas under the curve for TyG index and NLR alone, and in combination, to predict CHD were 0.717, 0.692, and 0.761, respectively (all P< 0.001).
Conclusion: The TyG index and NLR were significantly associated with the occurrence of CHD in the T2DM population. The combined use of these two biomarkers enhances diagnostic accuracy, which is beneficial for the prevention of CHD.
Keywords: triglyceride-glucose index, neutrophil-to-lymphocyte ratio, type 2 diabetes, coronary heart disease, coronary heart disease severity
Graphical Abstract:

Background
Coronary heart disease (CHD) is a chronic ischemic condition caused by the narrowing of the coronary arteries, with acute coronary syndrome (ACS) being one of its most serious manifestations.1 With an aging population and the prevalence of unhealthy lifestyles, the morbidity and mortality of CHD are increasing, seriously jeopardizing global public health.2 Diabetes mellitus (DM) is considered a serious risk factor for CHD.3 In diabetic patients, coronary arteries exhibit larger necrotic cores and heightened infiltration of inflammatory macrophages and T cells, resulting in more extensive coronary artery damage.4 An established link exists between hyperglycemia, coronary artery calcification(CAC), and glycated hemoglobin(HbA1c), which serves as a predictor of cardiovascular disease.5 Prior research6 has demonstrated that an abnormal elevation in blood glucose levels is associated with an increased risk of CHD. Data from the survey indicate that for each 1% increment in HbA1c, there is an estimated increase in cardiovascular events ranging from 11% to 16%. Patients with CHD and comorbid glucose metabolism abnormalities often have multibranch vasculopathy and a higher risk of subsequent adverse cardiovascular events.7
Insulin resistance (IR) is a classic marker of type 2 diabetes mellitus (T2DM).8 IR patients are prone to a range of metabolic disorders, including abnormalities in blood lipids, blood pressure, and blood glucose levels.9 IR has been widely recognised as a serious risk factor for cardiovascular disease.10,11 The high insulin-glucose clamp test (HIEC) is currently the gold standard for the detection of IR, but its clinical use is limited by the complexity of the test procedure.12 The Triglyceride-Glucose (TyG) index, calculated from fasting blood glucose (FBG) and triglycerides (TG), has been increasingly recognized as a reliable indicator of IR. Numerous studies have validated the TyG index against the hyperinsulinemic-euglycemic clamp (HIEC) and the homeostasis model assessment of estimated insulin resistance (HOMA-IR).13,14 There is substantial evidence that the Triglyceride-Glucose (TyG) index is associated with various cardiovascular diseases, including coronary atherosclerosis, stenosis, and ACS.15,16 Additionally, TyG index has been shown to be an independent predictor of future adverse cardiovascular events in patients with DM and ACS, highlighting its potential for clinical use.17 Neutrophil-to-lymphocyte ratio (NLR) is a novel inflammatory marker used to reflect the severity of systemic inflammation.18 It has been shown that NLR is strongly associated with CHD progression, and that patients with higher ratios are also at higher risk of cardiovascular events and mortality.19,20 In addition, chronic inflammation plays a crucial role in the pathogenesis of DM. Chronic inflammation can affect adipose tissue and mitochondrial function by impairing normal lipid accumulation, which leads to IR. Conversely, IR can exacerbate the chronic inflammatory response.21 The two interact to form a vicious circle.
The severity of CHD is a critical factor in the development and prognosis of cardiovascular disease. Patients with CHD combined with multibranch coronary artery disease represent a high-risk group for mortality, particularly within the DM population.22 Both the TyG index and NLR are associated with atherosclerosis and IR. However, the combined value of the TyG index and NLR in predicting CHD and its severity remains uncertain. Therefore, this study aims to provide clinical insights for the early prevention of coronary heart disease in patients with T2DM by investigating the associations between the TyG index, NLR, and CHD and its severity.
Methods
Study Population
This retrospective study selected 720 patients with T2DM who attended the People’s Hospital of Pingxiang City, Jiangxi Province, from January 2021 to December 2023, all of whom underwent coronary angiography (CAG) during hospitalisation. All patients were divided into T2DM and T2DM+CHD groups based on CAG results, and the following patients were excluded: (1) patients with severe arrhythmias, cardiomyopathy, valvular disease, and congenital heart disease; (2) patients with previous coronary artery bypass grafting (CABG) or cardiogenic shock; (3) patients with severe hepatic or renal insufficiency; (4) patients with severe infections, thyroid function disorders, hematological disorders, autoimmune diseases, and tumours; (5) patients who have recently suffered severe trauma or major surgery; (6) pregnant or breastfeeding women; and (7) patients lacking NLR, FBG, TG and CAG data. Finally 518 patients were included in the analysis and the enrolment process is shown in Figure 1. The study adhered to the Declaration of Helsinki and was approved by the Ethics Committee of Pingxiang People’s Hospital. The requirement for informed consent was waived due to the retrospective nature of the study. Furthermore, the confidentiality of all patient data was guaranteed.
 |
Figure 1 Flow chart of patient recruitment. Abbreviations: T2DM, type 2 diabetes mellitus; TG, triglyceride; FPG, fasting plasma glucose; Neu, Neutrophils; Lym, lymphocyte; CAG, coronary angiography; CHD, coronary heart disease. |
Data Collection
Clinical data of the enrolled patients during hospitalisation were collected through the electronic medical record system, including (1) general information such as: gender, age, body mass index (BMI), admission systolic blood pressure (SBP) and diastolic blood pressure (DBP), history of smoking, hypertension, oral hypolipidemic and hypoglycaemic drugs. (2) Laboratory test indications: fasting elbow vein blood was collected the next morning and placed in anticoagulant tubes for examination. These include: total cholesterol (TC), triglyceride (TG), low-density lipoprotein (LDL-C), high-density lipoprotein (HDL-C), fasting blood glucose (FBG), glycated hemoglobin (HbA1c), serum creatinine (Scr), neutrophil (NE) count, lymphocyte (LY) count. (3) CAG was performed by at least two cardiovascular interventional experts who were blinded to the study protocol via radial or femoral artery and the results were recorded.
Definitions
(1) TyG index and NLR are calculated as follows:TyG=Ln(TG[mg/dL]× FBG[mg/dL]/2);13 NLR=(NE counts[×109/L]/LY counts[×109/L]).23 (2) BMI was calculated by dividing weight (kg) by the square of height (m), expressed in kg/m2. (3) Diagnostic criteria for hypertension included a documented history of hypertension, current use of antihypertensive medications, or systolic blood pressure (SBP) ≥ 140 mmHg or diastolic blood pressure (DBP) ≥ 90 mmHg. (4) According to the American Diabetes Association criteria,24 T2DM is defined as: FBG ≥ 7.0 mmol/L or HbA1c ≥ 6.5%, or oral glucose tolerance test shows that 2-hour postprandial blood glucose ≥ 11.1 mmol/l, or a previous diagnosis of T2DM and received hypoglycemic drug treatment. (5) CHD was defined as the stenosis of at least one major coronary artery (left main artery, left anterior descending artery, left circumflex artery and right coronary artery) assessed by CAG ≥ 50%. The number of diseased vessels with stenosis ≥ 50% can reflect the severity of CHD.22 Patients with only one major coronary artery involved were defined as single vessel CHD, and patients with two or more major coronary arteries involved were defined as multi vessel CHD.
Statistical Analysis
Continuous variables following a normal distribution are presented as mean ± standard deviation, while non-normally distributed variables are presented as median and interquartile range. Categorical variables are shown as frequencies and percentages (%). The unpaired samples t-test and Mann–Whitney U-test were used to compare two continuous variables with normal and non-normal distributions, respectively. The χ²-test or Fisher’s exact test was used to compare categorical variables. Logistic regression models, including odds ratios (ORs) and corresponding 95% confidence intervals (CIs), were used to validate the correlation of the TyG index and NLR with CHD.The interaction of TyG index and NLR with CHD was examined by building three models: model I, unadjusted for status; model II, adjusted for age and sex by including them as covariates; and model III, refined by introducing the variables of model II and incorporating smoking status, history of hypertension, and history of glucose-lowering and lipid-lowering medications. In addition, to examine the association between TyG index and NLR with CHD and its severity, the same three models were again built for logistic regression analysis separately. The predictive validity of these two indices individually as well as jointly for CHD was determined by calculating the area under the curve (AUC) and the corresponding 95% confidence interval (CI) from the receiver operating characteristic (ROC) curve. All statistical analyses were performed using SPSS 26.0 (IBM, USA) and GraphPad Prism 8.0 (San Diego, California, USA). A two-sided P value of <0.05 was considered significant.
Results
Clinical and Biochemical Characteristics of T2DM and T2DM+CHD Groups
Data from this study were obtained from 518 individuals with T2DM (285 males and 233 females), including 396 CHD participants and 122 non-CHD participants.The mean age of individuals in the T2DM with and without CHD groups was 63.7 ± 9.5 years and 61.6 ± 9.8 years, respectively. Table 1 shows the demographic and clinical characteristics of the two groups. There were no significant differences between the two groups of participants in terms of BMI, SBP, DBP, TC, LDL-C, HDL-C, history of smoking, hypertension, antihypertensive and glucose-lowering medication use (P>0.05). The T2DM combined with CHD group had a higher mean age, a higher proportion of male, heart failure, antiplatelets and lipid-lowering medication-using patients; and higher levels of TG, FBG, HBA1c, TyG index, and NLR, with statistically significant differences (P < 0.05).
 |
Table 1 Demographic and Clinical Characteristics of Included Patients |
Univariate and Multivariate Analysis of Factors Associated with CHD in T2DM
Univariate logistic regression analysis showed that TG, FBG, HBA1c, TyG index and NLR were associated with the development of CHD in patients with T2DM (P< 0.05). Hypoglycemic and lipid-lowering medications play a pivotal role in the prevention and management of CHD. Their administration has been shown to mitigate the risk of cardiovascular disease and to lower both the incidence and mortality rates of cardiovascular events among patients with T2DM.25,26 Consequently, we have controlled for these medications to account for their potential confounding effects. After correcting for confounders such as age, sex, smoking, hypertension, and history of taking hypoglycaemic and dyslipidemia medications, multifactorial logistic regression analysis suggested that TyG index (OR, 3.89; 95% CI, 2.60–5.82; P< 0.001) and NLR (OR, 1.44; 95% CI, 1.22–1.71; P<0.001) remained risk factors for CHD in T2DM patients (Table 2).
 |
Table 2 Univariate and Multivariate Analysis of Factors Associated with CHD in T2DM |
Clinical and Biological Characteristics According to TyG Index Tertiles
To understand the relationship between different TyG levels and the development of CHD in patients with T2DM, all participants were divided into three groups based on the TyG index tertiles:T1(n=171; 7.91≤ TyG index ≤ 9.03), T2(n=174; 9.04≤ TyG index ≤ 9.57), and T3(n=173; 9.58≤ TyG index ≤ 11.48). The median TyG index for the three groups were 8.7, 9.3 and 10.0, respectively. Compared with patients in the lowest tertile of the TyG index (T1), the highest tertile of the TyG index (T3) had higher proportions of male patients, heart failure, TC, TG, LDL-C, FPG, and HbA1c, and lower rates of HDL-C, hypoglycaemic, and dyslipidemia medication use (P<0.05). In addition, the prevalence of CHD and the risk of developing multiple coronary lesions were higher in the T3 group compared with the T1 group (P<0.001, Table 3).
 |
Table 3 Demographic and Clinical Characteristics of Participants by TyG Index Tertiles |
Association of TyG Index and NLR with CHD in T2DM
Logistic regression modelling showed a significant association between TyG index and the occurrence of CHD in the T2DM population after adjusting for relevant cardiovascular risk factors and pharmacological treatment. Logistic regression analyses of the risk of developing CHD in the T2 and T3 groups were performed using TyG index as a categorical variable and T1 as a control group. The results showed that, after adjusting for age, sex, smoking, hypertension, and history of taking hypoglycaemic and dyslipidemia medications, each 1-unit increase in TyG index was associated with a 1.86-fold increase in the risk of CHD in the T2 group (OR, 1.86; 95% CI, 1.13–3.05; P=0.014); whereas in the T3 group, the risk of CHD increased by 3.61-fold (OR, 3.61; 95% CI, 2.41–5.40; P<0.001; Table 4).
 |
Table 4 Association Between the TyG Index and CHD |
Similarly, using NLR as a categorical variable, all participants were categorised into three groups based on the tertiles of NLR: T1(0.54 ≤ NLR ≤ 2.31), T2(2.32 ≤ NLR ≤ 3.64) and T3(NLR ≥ 3.65). After multifactorial correction, the results showed the same correlation between NLR and CHD. Among them, the risk of CHD in the T2 and T3 groups was 1.34 times (OR, 1.34; 95% CI, 1.14–1.58, P=0.001) and 1.62 times (OR, 1.62; 95% CI, 1.25–2.09, P<0.001; Table 5) higher than that in the T1 group, respectively.
 |
Table 5 Association Between the NLR and CHD |
In addition, we performed a sensitivity analysis based on the risk factors included in Model III. Initially, we conducted propensity score matching(PSM) for all enrolled patients at a 1:2 and 1:3 ratio, respectively, and determined that the TyG index and NLR remained significant risk factors for CHD (Sensitivity Analysis I,Table S1). Subsequently, we adjusted BMI, TC, LDL, and HDL and found that, consistent with the main model, TyG and NLR were risk factors for CHD (Sensitivity Analysis II,Table S1). Ultimately, we stratified the enrolled patients based on estimated glomerular filtration rate (eGFR), categorizing those with eGFR<60mL/min as having reduced renal function. Further sensitivity analysis confirmed that the outcomes were consistent with those of the primary model(Sensitivity Analysis III,Table S1).
Correlation Between TyG Index and CHD Severity in T2DM
Patients with T2DM combined with CHD were classified into single-vessel CHD (group V1) and multivessel CHD (group V2 including 2 coronary stenoses and group V3 with greater than 2 coronary stenoses) based on CAG results. Baseline clinical characteristics are shown in Table 6.TG, LDL-C, Scr, HBA1c, heart failure, antihypertensive drugs and TyG index were higher in the V3 group than in the V1 group, whereas HDL-C was lower than in the V1 group, and the difference was statistically significant (Table 6, P<0.05).
 |
Table 6 Clinical and Biological Characteristics According to CHD Severity |
Correlation analyses between CHD severity with BMI, TG, FGB, HBA1c, TyG index and NLR index showed no correlation between CHD severity and BMI (r=−0.077, P=0.079); and with TG (r=0.145, P=0.001), HBA1c (r=0.244, P<0.001), FPG (r=0.261, P<0.001), NLR (r=0.250, P<0.001), and TyG index (r=0.315, P<0.001) were weakly correlated with each other (Table 7). Figure 2 presents the CHD severity in TyG subgroups and TyG index in CHD severity subgroups among patients in the T2DM+CHD group, which showed a positive correlation with a statistically significant difference (P<0.001).
 |
Table 7 Relationship Between the Severity of CHD with BMI, TG, FGB, HBA1c, TyG and NLR |
 |
Figure 2 The relationship between TyG index and severity of CHD in T2DM+CHD patients. The red bar chart illustrates the number of coronary artery stenoses within the three-segment TyG index group of T2DM+CHD patients. Conversely, the blue bar chart represents the TyG index values corresponding to the number of three-segment coronary artery stenoses in this patient cohort. Abbreviations: TyG index, triglyceride-glucose index; CHD, coronary heart disease. |
Associations of the TyG Index and NLR with CAD Severity in T2DM
Logistic regression modelling showed a significant association between TyG index and CHD severity. Using TyG index as a categorical variable and T1 as the control group, after adjusting for risk factors such as age, sex, smoking, hypertension, and history of taking hypoglycaemic and dyslipidemia medications, the risk of multivessel CHD was 2.02 times (OR,2.02; 95% CI,1.29–3.17; P=0.002) and 2.96 times (OR,2.96; 95% CI,1.19–7.32; P=0.019; Table 8), a statistically significant difference. In contrast, in the NLR tertile subgroup, the results showed no statistically significant difference between NLR and CHD severity (P>0.05, Table 9).
 |
Table 8 Association Between TyG Index and CHD Severity |
 |
Table 9 Association Between NLR and CHD Severity |
Predictive Value of TyG Index and NLR for the Development of CHD in T2DM
ROC curves were used to evaluate the diagnostic value of TyG index, NLR and their combinations for the occurrence of CHD in the T2DM population. As shown in Table 10, the AUCs of TyG index and NLR for predicting CHD were 0.717(95% CI, 0.659–0.775) and 0.692(95% CI, 0.639–0.746), respectively; the sensitivities were 85.6% and 66.4%, respectively; and the specificities were 54.1% and 63.9%, respectively.The combined predictive value of TyG index and NLR was 0.761(95% CI, 0.709–0.813); sensitivity was 87.1%; and specificity was 54.9%. The optimal cut-off values of TyG index, NLR and their combination for the diagnosis of CHD were 8.858, 2.542 and 0.687, respectively(all P<0.001). The TyG index combined with the NLR enhanced the predictive strength and diagnostic ability of CHD, and all results were statistically significant (Figure 3, P<0.001).
 |
Table 10 ROC Curves Analysis of TyG Index or/and NLR to Predict CHD |
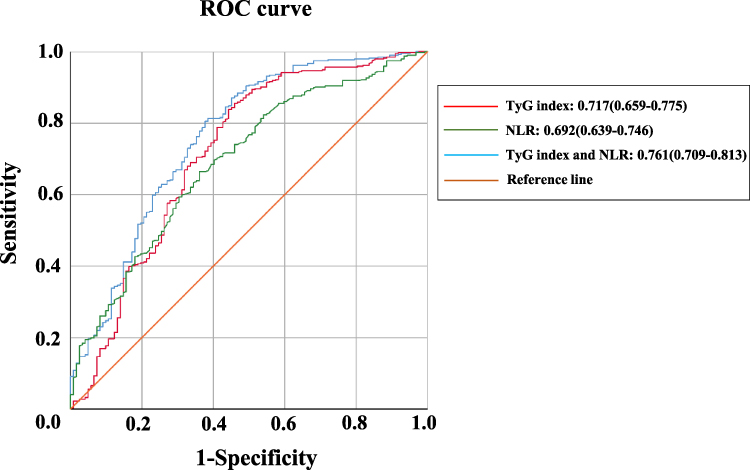 |
Figure 3 ROC curve analysis of TyG index or/and NLR to predict CHD. Abbreviations: ROC, receiver operating characteristic; TyG index, triglyceride-glucose index; NLR, neutrophil/lymphocyte ratio. |
The AUC for the combined TyG index and NLR model exceeds that of either individual model. To ascertain the model’s efficacy, we conducted additional interaction analyses. As shown in Table S2, in the analysis of additive interaction, the relative excess risk due to interaction (RERI) is 0.089 (95% CI, 0.022–0.156). The attributable proportion due to interaction (APAB) is estimated at 0.054 (95% CI, 0.027–0.081). The synergy index (SI) is calculated to be 1.157 (95% CI, 1.117–1.198). A value of SI greater than 1 signifies the presence of a synergistic effect, and a 95% CI above 1 indicates that this synergistic effect is statistically significant. Thus, the additive interaction analysis has elucidated the synergistic effect between the TyG index and NLR, revealing that their combined effect surpasses the sum of their individual effects. Additionally, we executed net reclassification index(NRI) and integrated discrimination improvement(IDI) analyses for both combined and individual indicators. The results demonstrated that NRI was greater than 0, suggesting that the combined model can more accurately differentiate between distinct risk groups. Additionally, an IDI value greater than 0 indicates that the joint model has enhanced the overall predictive accuracy. Furthermore, the 95% CI for both NRI and IDI did not include 0, which further confirms the statistical significance of the combined effect (Table S3).This finding underscores the importance of considering both factors concurrently in clinical practice.
Discussion
This study investigated the correlation between TyG index and NLR with CHD and its severity in T2DM patients. The main findings were as follows: (1) TyG index and NLR were significantly associated with the occurrence of CHD in patients with T2DM, and this association persisted after adjusting for many confounding risk factors; (2) In the T2DM combined CHD population, TyG index was significantly correlated with multivessel CHD, whereas there was no significant difference in NLR; (3) In the T2DM population, TyG index and NLR are a promising set of biomarkers for predicting CHD, and the combination of the two increases diagnostic efficacy.
IR is defined as a decrease in glucose uptake and utilization mediated by insulin and compensatory excess insulin secretion by the body.27 Previous studies have revealed a strong and statistically significant correlation between IR and the risk of cardiovascular disease in different populations, especially among people diagnosed with T2DM and insulin-resistant coronary artery disease.28 Chronic hyperglycemia and dyslipidemia, which result from IR, significantly contribute to the pathogenesis of cardiovascular disease.11 Hyperglycemia substantially elevates the risk of microvascular dysfunction, the no-reflow phenomenon, and mortality following ACS and percutaneous coronary intervention (PCI), by triggering inflammatory responses, atherosclerosis, and oxidative stress.29 Atherosclerosis is the main pathophysiological basis of CHD, and IR tends to cause body inflammation, vascular endothelial dysfunction, oxidative stress, disorders of glucose metabolism, lipid metabolism, and the formation of prethrombotic states, which ultimately accelerate the formation of atherosclerosis.30,31 In recent years, many studies have shown that IR is not only involved in atherosclerosis formation at an early stage, but can also play an important role in late plaque progression by promoting apoptosis of macrophages, vascular endothelial cells, and vascular smooth muscle cells.32,33 This may be a potential mechanism causing the development of CHD in patients with T2DM. The homeostasis model assessment estimated insulin resistance (HOMA-IR) index is a commonly used method for evaluating IR, but is of limited value in patients who have been treated with insulin or have severely impaired pancreatic β-cell function.12,34 The high insulin positive glucose clamp test is considered the gold standard for diagnosing IR, but its clinical use is limited by the high cost of the test, the complexity of the procedure, and the time-consuming nature of the test.13 The TyG index was first proposed as an alternative to the HOMA-IR by Simal-Mendía et al to assess IR.35 Recently, a growing number of studies have shown that the TyG index is a simple and reliable index for estimating IR and is comparable to the HOMA-IR.36 A large retrospective cohort study demonstrated that an elevated TyG index was significantly associated with an increased risk of adverse cardiovascular events, including fatal and nonfatal CHD, in an elderly population.37 This is similar to the results of the present study, where the risk of CHD increased as the TyG index increased. This was a significant difference despite adjusting for risk factors such as age, sex, smoking history, hypertension, and history of taking glucose and lipid-lowering medications (Table 4). Previous studies have shown a correlation between TyG index and the number and severity of coronary stenoses.38 Multivessel CHD has a higher prognosis and incidence of adverse cardiovascular events compared with single-vessel CHD, even with percutaneous coronary intervention.39 The number of coronary artery stenoses maps the severity of CHD, and multivessel CHD increases the difficulty of coronary intervention, bringing it into greater focus in clinical practice. A recent study showed that TyG index was significantly associated with the occurrence of multivessel CHD in the DM population.22 Consistent with the results of previous studies, the present study demonstrated that the larger the TyG index, the greater the number of coronary stenoses and the higher the severity of CHD in the group, and the difference was statistically significant (Table 8 and Figure 2). There is growing epidemiologic evidence that IR constitutes an independent prognostic predictor of CHD, but IR or its surrogate markers have not yet been incorporated into any risk prediction tools such as the global registry of acute coronary events (GRACE) score or the synergy between percutaneous coronary intervention (SYNTAX) score.The study by Wang L et al concluded that the TyG index is independent of currently known cardiovascular risk factors and can be used to predict the future risk of major adverse cardiovascular events (MACE) in patients with DM and CHD.17 Park et al also concluded that the TyG index remains a valid marker for the early detection of subclinical coronary atherosclerosis even in the absence of traditional cardiovascular disease risk factors.40 This study found that the TyG index will hopefully become a very clinically promising biomarker for early identification of high-risk CHD risk groups in T2DM patients, and that it can predict the severity of coronary artery lesions before CAG, enabling more targeted prevention and treatment.
Inflammation plays a central role in the pathogenesis of atherosclerosis, and elevated inflammatory markers indicate activation of vascular damage.41 Neutrophils are important inflammatory cells, and high levels of circulating neutrophils can cause hypercoagulability by increasing blood viscosity and releasing large amounts of pro-oxidants and pro-thrombotic substances, leading to platelet aggregation and vascular endothelial cell injury.42 In contrast, lymphocytes with immunomodulatory functions have anti-atherosclerotic effects.43 As the understanding of the immune response in the pathogenesis of CHD has deepened, researchers have turned their attention to the NLR, which reflects the dynamic balance between inflammatory activation and inflammatory regulation in the body and is more stable compared to absolute counts of neutrophils and lymphocytes.44 In the inflammatory state, the number of CD8+ T-lymphocytes decreases, and with the imbalance in the ratio of lymphocyte subpopulations as well as their function, the body’s immunity appears to be reduced. The persistent chronic inflammatory hold ultimately leads to IR and insulin secretion dysfunction, which promotes T2DM and its complications.45 A large cohort study from China showed that the risk of future CHD in DM patients was 2–4 times higher than in non-DM patients, and about 75% of them died from coronary ischemia.46 Compared to other inflammatory biomarkers such as hsCRP and TNF-α, NLR is more convenient and accessible for daily clinical use.NLR has been suggested as a diagnostic and prognostic marker for CHD.47 In our study, NLR was independently associated with the development of CHD in T2DM patients, but the relationship with CHD severity has not been confirmed. The results remained statistically significant after correction for potential confounders (Tables 5–9). NLR is considered one of the markers of systemic inflammatory response and is valuable in predicting the occurrence and prognosis of CHD. This simple marker can help physicians make better clinical decisions.
The TyG index and NLR, as indicators of IR as well as inflammation, have become important predictors of CHD and MACE. The results of the ROC curves in this study showed that the AUC of TyG index and NLR for predicting the risk of CHD in T2DM patients was 0.717 and 0.692, respectively. The AUC of the two parameters combined for predicting CHD in patients with T2DM was 0.761. A prior study48 identified the optimal cut-off value for TyG index in predicting CHD as 9.22, with the maximum AUC reaching 0.702, a sensitivity of 0.590, and a specificity of 0.784. Similar to our results, the optimal cuto-ff value of TyG is 8.86, the AUC is 0.717, and the sensitivity and specificity are 0.856,0.541, respectively. Consistent with previous findings, a prior prospective study49 determined the optimal cut-off value of NLR for predicting CHD to be 2.15, whereas in our analysis, the optimal cut-off value was found to be 2.54.The predictive value of TyG index combined with NLR was significantly higher than that of either TyG index or NLR. Our interaction analysis, along with NRI and IDI assessments, has substantiated the validity of our conclusions(Table S2-3).
Our findings have significant clinical implications for the management and risk stratification of CHD. By conducting a comprehensive evaluation of TyG index and NLR, healthcare providers can identify high-risk individuals with T2DM and implement more targeted and personalized prevention strategies. The objective of lowering blood glucose and lipid levels can be realized by adopting a healthier lifestyle, which includes dietary modifications and regular physical activity. Furthermore, for individuals at high risk, physicians should actively consider managing cardiovascular risk factors, including hypertension, hyperglycemia, and dyslipidemia, within this demographic. In clinical practice, the integration of the TyG index and NLR with established CHD risk factors enhances the predictive accuracy for unfavorable CHD outcomes. Thus, employing the combination of TyG index and NLR to identify the T2DM population at high cardiovascular risk can facilitate timely prevention and management of CHD onset and progression. This approach can reduce the incidence of multivessel coronary disease, enhance patient survival rates, and improve long-term prognoses for those with CHD, as well as elevate their quality of life.
Strengths and Limitations
The strength of this study lies in the fact that it was conducted in patients with T2DM, which is a chronic disease population with a very large base size. In addition, our study is the first to investigate the value of TyG index combined with NLR in predicting CHD and CHD severity in a T2DM population. There are also some limitations to this study. First, due to the inherent limitations of retrospective studies, we were unable to determine the existence of a causal relationship. Second, the final results of observational studies are always affected by confounding factors and statistical results may be biased. Finally, the study population was single-center and relatively small. Future multi-center, large sample and prospective studies are needed to further explore this.
Conclusion
Our study found that TyG index and NLR were significantly higher in T2DM patients combined with CHD than in patients with T2DM alone, and that TyG index was positively correlated with CHD severity. The combination of TyG index and NLR was superior to TyG index or NLR in predicting CHD. The TyG index and NLR may be complementary to traditional cardiovascular disease risk factors, and their relevance may be higher especially in T2DM, a population at high risk of MACE. It can be widely used in primary and community hospitals due to its simplicity, inexpensiveness and convenience, but this needs to be further confirmed in larger studies.
Abbreviations
TyG Index, triglyceride glucose index; NLR, neutrophil/lymphocyte ratio; T2DM, type 2 diabetes mellitus; CAC, coronary artery calcification; CHD, coronary heart disease; BMI, body mass index; SBP, systolic blood pressure; DBP, diastolic blood pressure; TG, triglyceride; TC, total cholesterol; HDL-C, high-density lipoprotein cholesterol; LDL-C, low-density lipoprotein cholesterol; Scr, serum creatinine; FPG, fasting plasma glucose; HbA1c, glycosylated hemoglobin; IR, Insulin resistance; PSM, propensity score matching; PCI, percutaneous coronary intervention; HOMA-IR, homeostasis model assessment for IR; MACE, major adverse cardiovascular events; GRACE Score, global registry of acute coronary events score; SYNTAX Score, the synergy between percutaneous coronary intervention score; OR, odd ratio; CI, confidence interval; ROC, receiver operating characteristic; AUC, area under the curve; RERI, relative excess risk due to interaction; AP, attributable proportion due to interaction; SI, synergy index. NRI, net reclassification index; IDI, integrated discrimination improvement.
Data Sharing Statement
Due to privacy and ethical constraints, the data generated and analyzed in this study are not publicly available. All data about the patients was anonymized or maintained confidentially.
Consent for Publication
All the authors agree to publish.
Acknowledgments
We thank all participants in this study.
Author Contributions
All authors made a significant contribution to the work reported, whether that is in the conception, study design, execution, acquisition of data, analysis and interpretation, or in all these areas; took part in drafting, revising or critically reviewing the article; gave final approval of the version to be published; have agreed on the journal to which the article has been submitted; and agree to be accountable for all aspects of the work.
Funding
This work was supported by the National Natural Science Foundation of China (No. 81973682); National Social Science Fund of China (No. 21VJXG037); National High-Level Clinical Research and Translational Capacity Enhancement Project for Traditional Chinese Medicine Hospitals, Special Fund for Medical Institution Preparation Development and New Drug Transformation, Druggability evaluation and preclinical study of Fuyang Qiangxin Granule, a traditional Chinese medicine for heart failure (HLCMHPP2023045); Key Research Project of the Capital Health Development Scientific Research Special Fund, Clinical and mechanistic study on the treatment of moderate-to-severe heart failure with Fuyang Strong Heart Tang (2024-1-4151); The 5th Batch of National Talents Cultivation Program for Excellent Clinicians of Traditional Chinese Medicine, administered by the National Administration of Traditional Chinese Medicine (No. SATCM-RE-2022-01).
Disclosure
The authors declare that there is no conflict of interest.
References
1. Karadeniz FZ, Sancaktepe EA, Karadeniz Y. High Triglyceride-Glucose Index is Associated With Poor Prognosis in Patients With Acute Coronary Syndrome in Long-Term Follow-Up[J]. Angiology. 2023;74(2):139–148. doi:10.1177/00033197221124763
2. S VS, Alonso A, J AH, et al. Heart Disease and Stroke Statistics-2021 Update: a Report From the American Heart Association[J]. Circulation. 2021;143(8):e254–e743.
3. Norhammar A, Malmberg K, Diderholm E, et al. Diabetes mellitus: the major risk factor in unstable coronary artery disease even after consideration of the extent of coronary artery disease and benefits of revascularization[J]. J Am Coll Cardiol. 2004;43(4):585–591. doi:10.1016/j.jacc.2003.08.050
4. Yahagi K, D KF, Lutter C, et al. Pathology of Human Coronary and Carotid Artery Atherosclerosis and Vascular Calcification in Diabetes Mellitus[J]. Arterioscler Thromb Vasc Biol. 2017;(2):191–204. doi:10.1161/ATVBAHA.116.306256
5. H JC, J RE, Kim K-J, et al. Relationship of glycated hemoglobin A1c, coronary artery calcification and insulin resistance in males without diabetes[J]. Arch Med Res. 2015;46(1):71–77. doi:10.1016/j.arcmed.2014.11.011
6. R HR, K PS, A BM, et al. 10-year follow-up of intensive glucose control in type 2 diabetes[J]. N Engl J Med. 2008;359(15):1577–1589. doi:10.1056/NEJMoa0806470
7. Dal Canto E, Ceriello A, Ryden L, et al. Diabetes as a cardiovascular risk factor: an overview of global trends of macro and micro vascular complications[J]. Eur J Prev Cardiol. 2019;26:25–32.
8. Defronzo RABL. From the triumvirate to the ominous octet: a new paradigm for the treatment of type 2 diabetes mellitus[J]. Diabetes. 2009;58(4):773–795.
9. A HM, Yang Y, Zhang L, et al. Insulin resistance, cardiovascular stiffening and cardiovascular disease[J]. Metabolism. 2021;119:154766.
10. C B-FA, R SG, O GM, et al. Association between plasma fatty acids and inflammatory markers in patients with and without insulin resistance and in secondary prevention of cardiovascular disease, a cross-sectional study[J]. Nutr J. 2018;1(17):26.
11. Ormazabal V, Nair S, Elfeky O, et al. Association between insulin resistance and the development of cardiovascular disease[J]. Cardiovasc Diabetol. 2018;1(17):122.
12. V MH, A TH, T SC, et al. Assessment of preferred methods to measure insulin resistance in Asian patients with hypertension[J]. J Clin Hypertens. 2021;23(3):529–537. doi:10.1111/jch.14155
13. Guerrero-Romero F, E S-ML, Gonzalez-Ortiz M, et al. The product of triglycerides and glucose, a simple measure of insulin sensitivity. Comparison with the euglycemic-hyperinsulinemic clamp[J]. J Clin Endocrinol Metab. 2010;95(7):3347–3351. doi:10.1210/jc.2010-0288
14. Sanchez-Garcia A, Rodriguez-Gutierrez R, Mancillas-Adame L, et al. Diagnostic Accuracy of the Triglyceride and Glucose Index for Insulin Resistance: a Systematic Review[J]. Int J Endocrinol. 2020. 4678526. doi:10.1155/2020/4678526
15. Z JZ, B ZJ, L SH, et al. A High Triglyceride-Glucose Index Value Is Associated With an Increased Risk of Carotid Plaque Burden in Subjects With Prediabetes and New-Onset Type 2 Diabetes: a Real-World Study[J]. Front Cardiovasc Med. 2022. 832491. doi:10.3389/fcvm.2022.832491
16. Lopez-Jaramillo P, Gomez-Arbelaez D, Martinez-Bello D, et al. Association of the triglyceride glucose index as a measure of insulin resistance with mortality and cardiovascular disease in populations from five continents (PURE study): a prospective cohort study[J]. Lancet Healthy Longev. 2023;4(1):e23–e33. doi:10.1016/S2666-7568(22)00247-1
17. Wang L, X ZJ, Zhang J-X, et al. Triglyceride-glucose index predicts adverse cardiovascular events in patients with diabetes and acute coronary syndrome[J]. Cardiovasc Diabetol. 2020;19(1):80. doi:10.1186/s12933-020-01054-z
18. Yilmaz H, Ucan B, Sayki M, et al. Usefulness of the neutrophil-to-lymphocyte ratio to prediction of type 2 diabetes mellitus in morbid obesity[J]. Diabetes Metab Syndr. 2015;9(4):299–304. doi:10.1016/j.dsx.2014.04.009
19. Agarwal R, G AR, B SB, et al. The prognostic value of neutrophil-to-lymphocyte ratio across all stages of coronary artery disease[J]. Coron Artery Dis. 2022;33(2):137–143. doi:10.1097/MCA.0000000000001040
20. Xu N, F TX, Yao Y, et al. Predictive value of neutrophil to lymphocyte ratio in long-term outcomes of left main and/or three-vessel disease in patients with acute myocardial infarction[J]. Catheter Cardiovasc Interv. 2018;91(S1):551–557. doi:10.1002/ccd.27495
21. Lele RD. Causation, prevention and reversal of vascular endothelial dysfunction[J]. J Assoc Physicians India. 2007;643–651.
22. Su J, Li Z, Huang M, et al. Triglyceride glucose index for the detection of the severity of coronary artery disease in different glucose metabolic states in patients with coronary heart disease: a RCSCD-TCM study in China[J]. Cardiovasc Diabetol. 2022;21(1):96. doi:10.1186/s12933-022-01523-7
23. Wu S, M YY, Zhu J, et al. Impact of Baseline Neutrophil-to-Lymphocyte Ratio on Long-Term Prognosis in Patients With Atrial Fibrillation[J]. Angiology. 2021;72(9):819–828. doi:10.1177/00033197211000495
24. Diagnosis and classification of diabetes mellitus[J]. Diabetes Care. 2014;37 Suppl 1(37 Suppl 1):S81–S90. doi:10.2337/dc14-S081
25. A DR, Inzucchi S, Abdul-Ghani M, et al. Pioglitazone: the forgotten, cost-effective cardioprotective drug for type 2 diabetes[J]. Diab Vasc Dis Res. 2019;16(2):133–143. doi:10.1177/1479164118825376
26. Betteridge DJ. Diabetic dyslipidaemia[J]. Diabetes Obes Metab. 2000;2 Suppl 1(2 Suppl):S31–S36. doi:10.1046/j.1463-1326.2000.00021.x
27. Li M, Chi X, Wang Y, et al. Trends in insulin resistance: insights into mechanisms and therapeutic strategy[J]. Signal Transduct Target Ther. 2022;7(1):216. doi:10.1038/s41392-022-01073-0
28. Reaven GM. Relationships among insulin resistance, type 2 diabetes, essential hypertension, and cardiovascular disease: similarities and differences[J]. J Clin Hypertens. 2011;13(4):238–243. doi:10.1111/j.1751-7176.2011.00439.x
29. Mone P, Lombardi A, Salemme L, et al. Stress Hyperglycemia Drives the Risk of Hospitalization for Chest Pain in Patients With Ischemia and Nonobstructive Coronary Arteries (INOCA)[J]. Diabetes Care. 2023;46(2):450–454. doi:10.2337/dc22-0783
30. Lee SH, Park SY, Choi CS. Insulin Resistance: from Mechanisms to Therapeutic Strategies[J]. Diabetes Metab J. 2022;46(1):15–37. doi:10.4093/dmj.2021.0280
31. A KJ, Montagnani M, K KK, et al. Reciprocal relationships between insulin resistance and endothelial dysfunction: molecular and pathophysiological mechanisms[J]. Circulation. 2006;113(15):1888–1904. doi:10.1161/CIRCULATIONAHA.105.563213
32. Di Pino A, DeFronzo RA. Insulin Resistance and Atherosclerosis: implications for Insulin-Sensitizing Agents[J]. Endocr Rev. 2019;40(6):1447–1467. doi:10.1210/er.2018-00141
33. Bornfeldt KE, Tabas I. Insulin resistance, hyperglycemia, and atherosclerosis[J]. Cell Metab. 2011;14(5):575–585. doi:10.1016/j.cmet.2011.07.015
34. Mone P, De Gennaro S, Moriello D, et al. Insulin resistance drives cognitive impairment in hypertensive pre-diabetic frail elders: the Centennial study[J]. Eur J Prev Cardiol. 2023;30(12):1283–1288. doi:10.1093/eurjpc/zwad173
35. Simental-Mendia LE, Rodriguez-Moran M, Guerrero-Romero F. The product of fasting glucose and triglycerides as surrogate for identifying insulin resistance in apparently healthy subjects[J]. Metab Syndr Relat Disord. 2008;6(4):299–304. doi:10.1089/met.2008.0034
36. Hong S, Han K, Park CY. The triglyceride glucose index is a simple and low-cost marker associated with atherosclerotic cardiovascular disease: a population-based study[J]. BMC Med. 2020;18(1):361. doi:10.1186/s12916-020-01824-2
37. Li S, Guo B, Chen H, et al. The role of the triglyceride (triacylglycerol) glucose index in the development of cardiovascular events: a retrospective cohort analysis[J]. Sci Rep. 2019;9(1):7320. doi:10.1038/s41598-019-43776-5
38. V TP, A TH, Van Minh H, et al. Triglyceride glucose index for the detection of asymptomatic coronary artery stenosis in patients with type 2 diabetes[J]. Cardiovasc Diabetol. 2020;19(1):137. doi:10.1186/s12933-020-01108-2
39. Sorajja P, J GB, A CD, et al. Impact of multivessel disease on reperfusion success and clinical outcomes in patients undergoing primary percutaneous coronary intervention for acute myocardial infarction[J]. Eur Heart J. 2007;28(14):1709–1716. doi:10.1093/eurheartj/ehm184
40. M PG, R CY, B WK, et al. Triglyceride glucose index is a useful marker for predicting subclinical coronary artery disease in the absence of traditional risk factors[J]. Lipids Health Dis. 2020;19(1):7. doi:10.1186/s12944-020-1187-0
41. P WR, Muntner P, Chen J, et al. Relation of inflammation to peripheral arterial disease in the national health and nutrition examination survey, 1999-2002[J]. Am J Cardiol. 2005;96(11):1579–1583. doi:10.1016/j.amjcard.2005.07.067
42. Kawaguchi H, Mori T, Kawano T, et al. Band neutrophil count and the presence and severity of coronary atherosclerosis[J]. Am Heart J. 1996;132(1):9–12. doi:10.1016/S0002-8703(96)90384-1
43. Drechsler M, Doring Y, T MR, et al. Neutrophilic granulocytes - promiscuous accelerators of atherosclerosis[J]. Thromb Haemost. 2011;106(5):839–848. doi:10.1160/TH11-07-0501
44. H GP, L CB, H CB, et al. Preoperative neutrophil-lymphocyte ratio and outcome from coronary artery bypass grafting[J]. Am Heart J. 2007;154(5):995–1002. doi:10.1016/j.ahj.2007.06.043
45. Luo A, T LS, Barres R, et al. The Microbiota and Epigenetic Regulation of T Helper 17/Regulatory T Cells: in Search of a Balanced Immune System[J]. Front Immunol. 2017;8:417. doi:10.3389/fimmu.2017.00417
46. Lyu Y, Luo Y, Li C, et al. Regional Differences in the Prevalence of Coronary Heart Disease and Stroke in Patients With Type 2 Diabetes in China[J]. J Clin Endocrinol Metab. 2018;103(9):3319–3330. doi:10.1210/jc.2018-00422
47. Angkananard T, Anothaisintawee T, McEvoy M, et al. Neutrophil Lymphocyte Ratio and Cardiovascular Disease Risk: a Systematic Review and Meta-Analysis[J]. Biomed Res Int. 2018;2018:2703518. doi:10.1155/2018/2703518
48. Zhao J, Fan H, Wang T, et al. TyG index is positively associated with risk of CHD and coronary atherosclerosis severity among NAFLD patients[J]. Cardiovasc Diabetol. 2022;21(1):123. doi:10.1186/s12933-022-01548-y
49. Kim S, Eliot M, C KD, et al. Association of Neutrophil-to-Lymphocyte Ratio With Mortality and Cardiovascular Disease in the Jackson Heart Study and Modification by the Duffy Antigen Variant[J]. JAMA Cardiol. 2018;3(6):455–462. doi:10.1001/jamacardio.2018.1042
 © 2024 The Author(s). This work is published and licensed by Dove Medical Press Limited. The
full terms of this license are available at https://www.dovepress.com/terms.php
and incorporate the Creative Commons Attribution
- Non Commercial (unported, 3.0) License.
By accessing the work you hereby accept the Terms. Non-commercial uses of the work are permitted
without any further permission from Dove Medical Press Limited, provided the work is properly
attributed. For permission for commercial use of this work, please see paragraphs 4.2 and 5 of our Terms.
© 2024 The Author(s). This work is published and licensed by Dove Medical Press Limited. The
full terms of this license are available at https://www.dovepress.com/terms.php
and incorporate the Creative Commons Attribution
- Non Commercial (unported, 3.0) License.
By accessing the work you hereby accept the Terms. Non-commercial uses of the work are permitted
without any further permission from Dove Medical Press Limited, provided the work is properly
attributed. For permission for commercial use of this work, please see paragraphs 4.2 and 5 of our Terms.