")
Back to Journals » Journal of Multidisciplinary Healthcare » Volume 18
The Relationships of Air Pollution and Meteorological Factors with Acute Aortic Dissection in Urumqi, China: A Distributed Lag Nonlinear Model Analysis
Authors Wang FX, Yuan QR, Cui J, Ke XQ, Wang FF, Dong XY, Wang T, Hahaerman A, Tong YF, Xu ZX, Feng Y, Du YK
Received 28 November 2024
Accepted for publication 19 May 2025
Published 10 June 2025 Volume 2025:18 Pages 3331—3343
DOI https://doi.org/10.2147/JMDH.S509228
Checked for plagiarism Yes
Review by Single anonymous peer review
Peer reviewer comments 2
Editor who approved publication: Dr Scott Fraser
Feng-xia Wang,1,* Qian-ru Yuan,2,* Jun Cui,2 Xiao-qin Ke,1 Fei-fei Wang,3 Xiang-yu Dong,1 Ting Wang,1 Adiya Hahaerman,1 Yong-fu Tong,1 Zhong-xing Xu,1 Yan Feng,1 Yu-kui Du4
1Cardiovascular Medicine Department, Center for Cardiac and Panvascular Medicine Diagnosis and Treatment, People’s Hospital of Xinjiang Uygur Autonomous Region, Urumqi, Xinjiang, People’s Republic of China; 2First Clinical College, Xinjiang Medical University, Urumqi, Xinjiang, People’s Republic of China; 3Emergency Department, People’s Hospital of Xinjiang Uygur Autonomous Region Bainiaohu Hospital, Urumqi, Xinjiang, People’s Republic of China; 4Department of Cardiac Surgery, Center for Cardiac and Panvascular Medicine Diagnosis and Treatment, Urumqi, Xinjiang, People’s Republic of China
*These authors contributed equally to this work
Correspondence: Yu-kui Du, Department of Cardiac Surgery, Center for Cardiac and Panvascular Medicine Diagnosis and Treatment, People’s Hospital of Xinjiang Uygur Autonomous Region, No. 91 of Tianchi Road, Urumqi, Xinjiang Uygur Autonomous Region, 830000, People’s Republic of China, Tel +86-139 9910 1639, Email [email protected]
Objective: While prior studies link individual meteorological and air quality factors to acute aortic dissection (AAD), their combined lagged effects remain poorly understood. This study evaluates how air pollution and weather conditions collectively influence AAD risk in Urumqi, China.
Methods: The results show that the onset of AAD predominantly occurs in the cold season, exhibiting distinct seasonal characteristics. Meanwhile, PM2.5, PM10, SO2, and the average dew point are significantly correlated with an increased risk of AAD. Males are more sensitive to certain pollutants (PM2.5, PM10, SO2) and the average dew point. In contrast, in females, CO surprisingly has a protective effect. Among people aged ≤ 50, O3_8h and the average dew point have a strong cumulative correlation with the incidence of AAD, while CO exposure and the maximum sustained wind speed are negatively correlated with the incidence of AAD. Individuals aged over 50 show little sensitivity to air pollutants and meteorological conditions. Under extreme conditions, the concentrations of PM2.5, SO2, and PM10 can still increase the risk of AAD onset.
Conclusion: Air pollution and meteorological factors significantly impact AAD risk, highlighting the need to consider these factors in prevention and management strategies.
Keywords: acute aortic dissection, air pollution, DLNM, meteorological factors, time series
Background
Acute aortic dissection (AAD) arises from various factors that cause a tear in the inner layer of the aorta, allowing blood to flow from the aortic lumen (true lumen) into the middle layer, creating a false lumen. This condition can result in varying degrees of dissection along the longitudinal axis of the aorta and represents a highly lethal cardiovascular emergency. In patients with AAD, if no treatment is given, the mortality rate is 33% within the first 24 hours after the onset of the disease. It will rise to 50% within 48 hours. If the disease remains undiagnosed after two weeks, the mortality rate will approach 75%. The mortality rate increases by 1% every hour.1
Human physiological activities are closely influenced by natural environmental conditions, and recent research has indicated a potential impact of meteorological factors and air pollutants on AAD incidence.2 From studies that have been conducted, we found a significant correlation between AAD occurrence and changes in maximum temperature one or two days prior, as well as the maximum temperature itself. Cold weather and abrupt temperature drops have been identified as potential triggers for AAD, with variations observed across different subgroups.3 Additionally, seasonal and monthly variations have been linked to AAD occurrence, with lower temperatures being associated with a higher incidence of aortic dissection. However, the relationship between AAD incidence and factors such as meteorological conditions, air quality, and seasonal trends remains a subject of debate.
Urumqi, the most inland city in the world, often referred to as the “Asian capital”, presents a unique setting for examining the influence of climate on health. As depicted in Supplementary Figure 1, Urumqi is situated in the northwest region of China, between 42°45′-44°08′ north latitude and 86°37′-88°58′ east longitude, encompassing a total area of 13,800 square kilometers. Under its temperate continental arid climate, the city endures year-round dryness, with rainfall increasing with altitude. Seasons are unevenly paced; spring and autumn are fleeting, while winter, lasting about five months, brings intense cold, and summer lingers, marked by large day-night temperature swings and stark hot-cold contrasts.4 Understanding the relationship between meteorological factors, air quality, and the occurrence of AAD is crucial for enhancing the prevention and management of this life-threatening condition. Such insights can inform targeted strategies to mitigate risk and enhance patient outcomes.
Methods and Materials
Study Population
Data on patients with AAD were provided by the People’s Hospital of Xinjiang Uygur Autonomous Region (Urumqi, Xinjiang, China), which is recognized as the leading hospital in Xinjiang, serving the highest number of patients and being the preferred medical facility for individuals from Xinjiang and neighboring regions. The data covered the period from November 28, 2013, to June 1, 2021. For this study, AAD patient data were obtained from the electronic medical record system. Inclusion criteria were as follows: 1) Age ≥ 18 years; 2) Definitive diagnosis of AAD confirmed by aortic computed tomography (CT) or magnetic resonance imaging (MRI) at the hospital’s imaging center, with subsequent validation via aortography, transthoracic cardiac Doppler ultrasound, or transesophageal echocardiography; 3) Availability of a clear history of symptom onset. Exclusion criteria were: 1) Age < 18 years; 2) Presence of heart failure or valvular heart disease; 3) Presence of connective tissue disorders; 4) Diagnosis of related genetic conditions, such as Marfan syndrome; 5) Traumatic or iatrogenic aortic dissection; 6) Inability to determine the exact onset time of symptoms; 7) Residence outside of Urumqi.
Meteorological and Air Pollution Data
Python was used to efficiently download air quality data for Urumqi city from the website http://tianqihoubao.com, covering the period from October 28, 2013, to June 1, 2021. The dataset included daily average concentrations of the air quality index (AQI), PM10, PM2.5, NO2, SO2, O3, and CO_8h. Additionally, meteorological data for Urumqi city from October 28, 2013, to June 1, 2021, were obtained from https://rp5.ru/. This dataset encompassed daily maximum and minimum temperatures, daily average dew point, daily maximum sustained wind speed, and daily rainfall. Based on the climatic conditions of Urumqi, two seasons were defined: the warm season, from April to September, and the cold season, spanning October to March.
Statistical Analysis
Descriptive statistical analysis was conducted on the baseline data. Normality tests were conducted on continuous variables. For variables with a normal distribution, the mean and standard deviation were used for representation, while for non-normally distributed variables, the median and interquartile range were used to describe the data related to meteorological factors and atmospheric pollutants. Time series plots were generated to illustrate the seasonal distribution of AAD occurrences and their associated factors. The Spearman correlation method was applied to assess the relationships between various factors and AAD incidence. The correlation between meteorological variables, as determined by the Spearman correlation coefficient, was categorized into five levels: no correlation (0.00–0.30), low correlation (0.30–0.50), moderate correlation (0.50–0.70), high correlation (0.70–0.90), and very high correlation (0.90–1.00). To further assess multicollinearity among variables, the variance inflation factor (VIF) was calculated for all air pollutants and meteorological variables.
Considering that the influence of meteorological factors on disease incidence is often nonlinear and exhibits pronounced lag effects, and recognizing the rarity of AAD cases in Urumqi, a quasi-Poisson generalized linear regression model combined with a distributed lag nonlinear model (DLNM) was applied to assess the effects of meteorological conditions and air quality factors on AAD incidence. The DLNM included a two-dimensional cross-basis function that accounted for both exposure and lag dimensions, allowing for a quantitative assessment of the nonlinear relationships and lagged effects between the studied variables and AAD risk. Seasonal variations, cyclical patterns, weekend effects, and holiday influences were controlled in the model, while other relevant air pollutants and meteorological factors were included as covariates in the time series model. The model was structured as follows:
Yt ~ quasipoisson(μt)
Log(μt)=α+cb(Xt,lag)+ns(Time,df)+ns(Weather,df)+ns(Pollutants,df)+ηDOW + γ Holiday
In this model, t represents the observation date (t=1, 2, 3)., and μ_t denotes the number of daily AAD cases observed over t days. The parameter α serves as the model intercept, while cb (X_t, lag) refers to the cross-basis function incorporating meteorological variables and air pollutants. The term df denotes the degrees of freedom, and ns represents the natural cubic spline function used to control for long-term trends. The term “Weather” captures the influence of meteorological variables, whereas “Pollutants” represents the effects of air contaminants. DOW functions as a categorical variable to account for day-of-week variations, and “Holiday” adjusts for the impact of holidays, with η and γ as their corresponding coefficients.
For this study, df were selected based on the principle of minimizing the sum of absolute values of the partial autocorrelation function derived from model residuals, along with relevant literature. To assess potential lag effects of meteorological factors and air pollutants, the lag days for AAD were set to zero, with a maximum lag period of 30 days. The degrees of freedom for temporal variables were specified as 30 per year, while those for meteorological factors and atmospheric pollutants were set at 3.
A stratified analysis was also performed to examine the effects of air pollution and meteorological factors across various subgroups, including gender (male and female), age ≤ 50 years and > 50 years), hypertension status (present or absent), diabetes status (present or absent), and season (warm and cold). All statistical analyses were conducted using the “DLNM”, “Spline”, and “mgcv” packages in R software (version 4.1.0). P-values were computed as two-tailed, with a threshold of P < 0.05 considered indicative of statistical significance.
Result
Descriptive Statistical Analysis
According to Table 1, 1784 AAD patients were enrolled. Males accounted for 79.6%, females for 20.4%, with an average age of 52.6±11.7 years. Hypertension history was present in 74.7%, and 4.8% (n=85) had diabetes. Seasonally, 61.8% of cases occurred in the cold season and 38.2% (n=681) in the warm season. Supplementary Figure 2 indicates that the air quality and meteorological data from 2013 to 2021 deviated from normal distribution. Table 2 presents the meteorological and air quality data for days with and without AAD. The results show that there are differences in the average dew point, maximum temperature, minimum temperature, PM2.5, PM10, SO2, NO2, CO, O3_8h, and AQI between the groups (P < 0.05). Meanwhile, AAD occurs more frequently in the cold season (P < 0.001).
 |
Table 1 Patient Demographics and Baseline Characteristics |
 |
Table 2 Meteorological Factors and Air Quality of days with and without AAD Occurrence |
Seasonal Distribution
Supplementary Figure 3 and Figure 1 depict the temporal distribution of various meteorological factors—including maximum sustained wind speed, dew point, maximum temperature, minimum temperature, and precipitation—and air pollutants such as CO, NO2, O3, PM2.5, PM10, and SO2, along with the number of AAD cases in Urumqi, Xinjiang, from October 28, 2013, to June 1, 2021. Notably, dew point, minimum temperature, maximum temperature, and PM2.5 display distinct seasonal variations, with AAD cases predominantly occurring during the cold season.
 |
Figure 1 The time series map of AAD for Urumqi City covering the period from October 28, 2013 to June 1, 2021. Abbreviation: AAD, Acute Aortic Dissection. |
Correlation Analysis
Figure 2 depicts the Spearman correlation between meteorological factors, air quality, and AAD incidence. The analysis revealed significant correlations (p < 0.01) among the daily average concentrations of most air pollutants. The strongest correlation was identified between NO2, CO, and PM2.5 (r=0.835). Additionally, the correlation between AQI and the six pollutants partially reflects the contributions of these pollutants to the AQI levels of Urumqi. The highest correlations with AQI were observed for particulate matter pollutants (PM10, PM2.5) (r=0.939, r=0.913), whereas SO2 and O3_8h exhibited weaker correlations with AQI (r < 0.7). Strong correlations were also found between maximum temperature, minimum temperature, and O3_8h (r=0.733, r=0.731), while other factors demonstrated varying levels of correlation. However, the VIF and tolerance values indicated the presence of multicollinearity among the meteorological factors and air quality variables. To address this, maximum temperature, AQI, and NO2 were excluded to mitigate significant collinearity (Supplementary Table 1). Despite the absence of strong correlations for some variables, their potential non-linear relationships and lag effects on AAD incidence warranted further investigation.
 |
Figure 2 Spearman’s rank correlation between daily air pollutant, and meteorological factors. Abbreviations: wind_speed, maximum sustained wind speed; dew_point, average dew point; maximum_temperature, maximum temperature; minimum_temperature, minimum temperature; AQI, air quality index. |
Analysis of Lag Association
Supplementary Table 2 and Figure 3 show the individual effects of pollutants and meteorological factors on AAD incidence at different lag days. PM2.5 was significantly associated with AAD incidence from lag 10–14 days, peaking at lag 12 day (RR=1.061, 95% CI: 1.008, 1.116). PM10 had a significant correlation with AAD incidence at lag 29–30 days, with the highest risk at lag 29 day (RR=1.124, 95% CI: 1.007, 1.255). SO2 was significantly correlated with AAD incidence at lag 29–30 days, with the greatest risk at lag 30 day (RR=1.338, 95% CI: 1.083, 1.653). Each 1°C increase in average dew point was linked to a higher AAD risk, especially at lag 1–2 and 16–20 days, peaking at lag 0 (RR=1.786, 95% CI: 1.184, 2.693). No significant associations were found between AAD incidence and PM10, CO, SO2, O3_8h, minimum temperature, or maximum sustained wind speed. Supplementary Table 3 shows the cumulative effects of relevant factors on AAD incidence over 0–30-day lags. PM2.5 had a significant cumulative effect from lag 0–16 to 0–30 days, with the highest risk at lag 0–30 day(RR=1.872, 95% CI: 1.046, 3.349). Average dew point had significant cumulative effects from lag 0–0 to 0–5 and 0–20 to 0–23 days, peaking at lag 0–3 day (RR=3.158, 95% CI: 1.327, 7.514). Minimum temperature had a protective cumulative effect from lag 0–2 to 0–9 days, strongest at lag 0–8 day (RR=0.459, 95% CI: 0.231, 0.912).
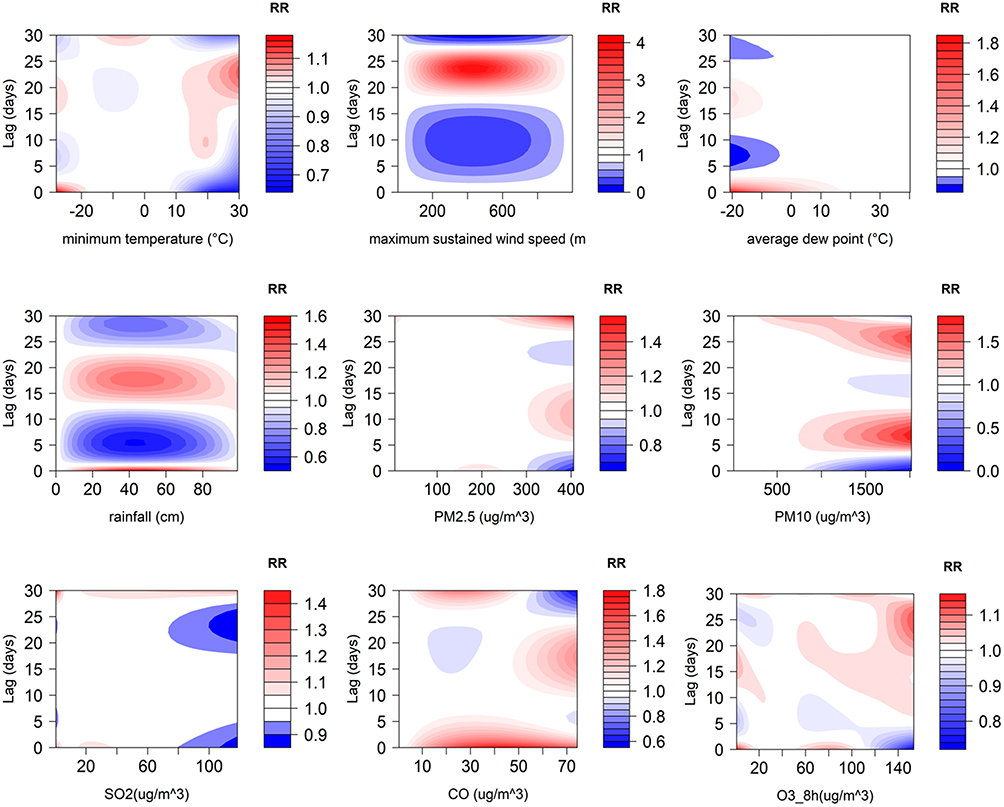 |
Figure 3 Contour plots of the single-day lagged association between air pollution, meteorological factors, and daily AAD occur. The horizontal and vertical axes represent the value ranges of each factor and the lag days, respectively. |
Figure 4 shows dose-response relationships of meteorological factors and air pollutants with daily AAD occurrences, using median values as references. Most variables had non-linear relationships, except for maximum sustained wind speed, rainfall, dew point, PM10, CO, and O3_8h, which had no significant associations. Notably, the dose-response curve between minimum temperature and daily AAD occurrences formed an inverted “V” shape, indicating a protective effect of higher minimum temperatures, with the greatest effect observed at 27°C (RR=0.197, 95% CI: 0.040, 0.972). The relationship between SO2 concentration and AAD incidence followed an approximate “S” shape, with the highest risk occurring at 29.4 µg/m³ (RR=1.389, 95% CI: 1.002, 1.925). Additionally, low PM2.5 concentrations were associated with increased AAD risk, peaking at a concentration of 5 µg/m³ (RR=1.932, 95% CI: 1.046, 3.570).
 |
Figure 4 Impacts of meteorological factors and air pollution concentrations on daily occurs for AAD within 30 days. |
Subgroup Analysis
Supplementary Tables 4 and 5 present single effect estimates stratified by gender. In males, PM2.5, PM10, SO2, and dew point increased AAD risk at specific lag days: PM2.5 at lag 12 day (RR=1.061, 95% CI: 1.001, 1.125), PM10 at lag 30 day (RR=1.252, 95% CI: 1.035, 1.516), SO2 at lag 30 day (RR=1.385, 95% CI: 1.091, 1.757), and average dew point at lag 0 day (RR=1.909, 95% CI: 1.199, 3.041). Maximum sustained wind speed decreased AAD risk in males, with the best protection at lag 25 day (RR=0.885, 95% CI: 0.794, 0.986). In females, rainfall was associated with an increased AAD risk, peaking at lag 30 day (RR=1.225, 95% CI: 1.022, 1.470), and CO had a protective effect, strongest at lag 1 (RR=0.882, 95% CI: 0.802, 0.970). Supplementary Tables 6 and 7 show cumulative effect estimates by gender. In males, PM2.5 and dew point increased AAD risk, peaking at lag 0–30 day (RR=2.352, 95% CI: 1.206, 4.587) and lag 0–3 day (RR=3.534, 95% CI: 1.322, 9.442) respectively. In females, PM2.5 and dew point had no significant cumulative associations. CO had a cumulative protective effect in females, with the highest effect at lag 0–6 day (RR=0.608, 95% CI: 0.432, 0.855).
Supplementary Tables 8 and 9 show single and cumulative effect estimates for hypertensive patients. Dew point significantly raises AAD risk in this group, with the highest single effect at lag days 0 and 16 day (RR=1.835, 95% CI: 1.113, 3.027) and the maximum cumulative effect at lag 0–2 day (RR=2.939, 95% CI: 1.093, 7.906). CO’s single effect varies: it’s protective from lag 2–6 days and harmful from lag 13–19 days. Its cumulative effect is protective from lag 0–4 to 0–15 days, peaking at lag 0–9 (RR=0.732, 95% CI: 0.606, 0.885).
Supplementary Tables 10 and 11 show that in diabetic patients, CO, dew point, and minimum temperature increase AAD risk, with peak single effect estimates at lag 0 day (RR=1.371, 95% CI: 1.018, 1.846), lag 22 day (RR=1.487, 95% CI: 1.005, 2.198), and lag 21 day (RR=1.468, 95% CI: 1.008, 2.138) respectively. O3_8h may reduce AAD risk in them, with the highest protective effect at lag 28 day (RR=0.547, 95% CI: 0.329, 0.908). CO has a cumulative effect of RR=1.371 (95% CI: 1.018, 1.846) at lag 0–0, and O3_8h at lag 0–30 (RR=0.044, 95% CI: 0.002, 0.992).
Supplementary Tables 12–15 present the single and cumulative associations at different age subgroups. In individuals aged ≤ 50, O3_8h and dew point exhibited strong cumulative correlations with AAD incidence, reaching their peak at lag day 0–2 and lag 0–4 day, respectively (O3_8h: RR=2.237, 95% CI: 1.210, 4.136; dew point: RR=5.363, 95% CI: 1.441, 19.953). Notably, no such associations were observed in the > 50 age group. Additionally, in the ≤ 50 age group, CO exposure and maximum sustained wind speed were inversely associated with AAD incidence, with the strongest cumulative protective effects at lag day 0–12 for CO (RR=0.695, 95% CI: 0.552, 0.875) and at lag day 0–28 for wind speed (RR=0.080, 95% CI: 0.014, 0.463). Conversely, individuals over 50 revealed no sensitivity to either air pollutants or meteorological conditions.
Figures 5 and 6 illustrate the relationships among extreme pollutant concentrations, extreme weather conditions, and the incidence of AAD across various lag periods. Throughout the entire lag period, there is a protective association between lower maximum sustained wind speed and AAD incidence. Conversely, lower PM2.5 concentrations are associated with an increased risk of daily AAD incidence, with the peak relative risk observed at a 30-day lag. Lower SO2 and PM10 concentrations also significantly increase the occurrence of AAD, peaking at a 30-day lag as well. Extreme high temperatures have a protective effect on AAD incidence, following an “M”-shaped pattern, with the strongest effect at lag 0 day and a gradual weakening over time. Additionally, while low maximum sustained wind speed reduces the AAD risk, high wind speeds increase the risk during specific lag periods. High PM10 levels are significantly associated with an increased AAD risk, with the strongest correlation at lag day 0. Regardless of humidity levels, no significant association was detected between O3_8h and AAD risk. Both high and low dew point temperatures initially exhibit protective effects, but as the number of lag days increases, they later transform into factors that increase the risk of AAD incidence.
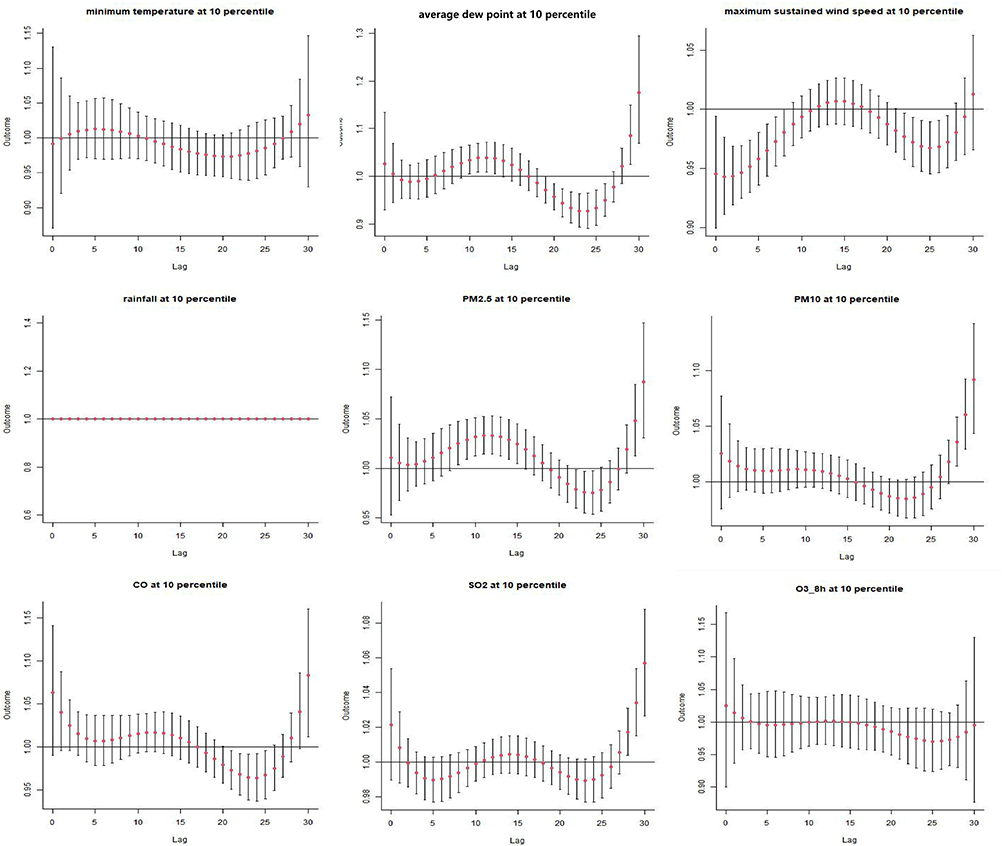 |
Figure 5 Lag association between extreme low air pollutant concentrations, extreme low meteorological factors, and daily occurs for AAD. |
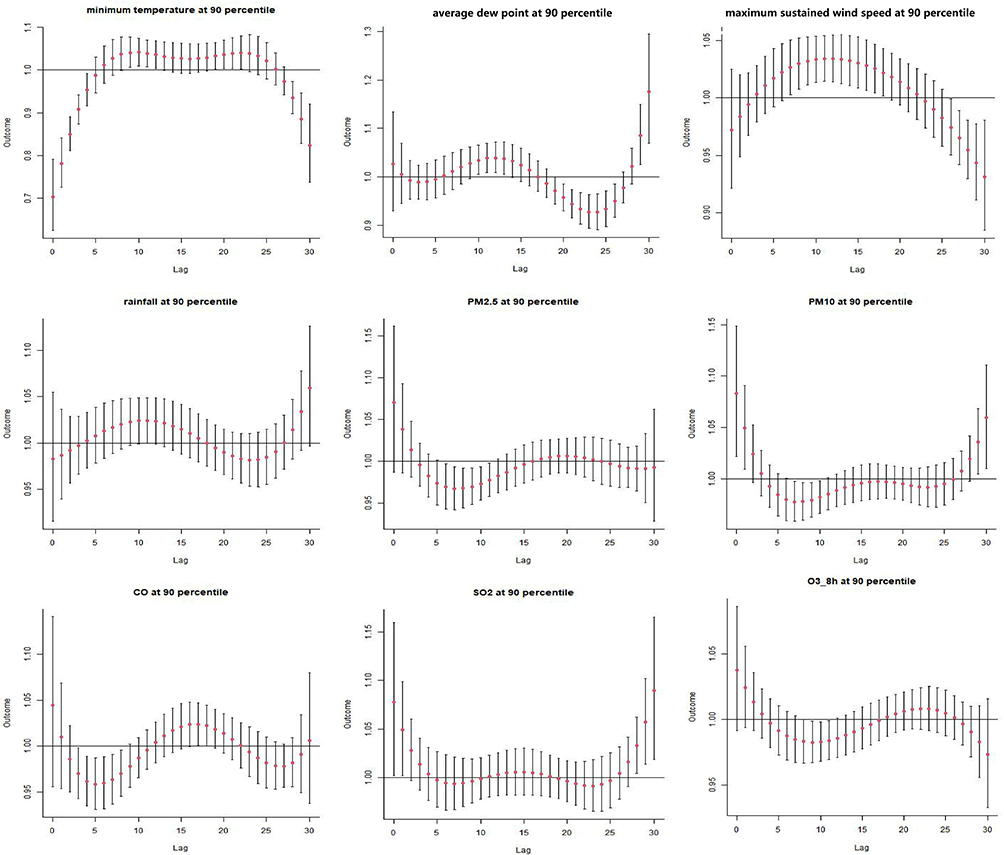 |
Figure 6 Lag association between extreme high air pollutant concentrations, extreme high meteorological factors, and daily occurs for AAD. |
Discussion
The city of Urumqi experiences substantial air pollution and notable climate fluctuations, largely attributed to its unique geographical location and climatic conditions. The objective of the study was to comprehensively analyze recent trends in the incidence of AAD in Urumqi, along with the demographic characteristics of the affected population. GLM and DNLM were used to examine the relationship between environmental factors and AAD occurrences in Urumqi from 2013 to 2021. The findings indicate a nonlinear, lagged association between air pollutants, meteorological conditions, and daily AAD occurrences. Specifically, factors such as dew point, PM2.5, PM10, CO, and SO2 were significantly correlated with an increased risk of AAD. Conversely, lower minimum temperatures were associated with a reduced risk. This pattern indicates that varying risk factors may differentially influence the human cardiovascular system. Consequently, further research is required to examine the complex relationships between air pollutants, meteorological factors, and AAD admissions.
The seasonal analysis revealed that the peak incidence of AAD is concentrated during colder seasons, displaying clear seasonal patterns, which align with findings from previous studies. The incidence is higher in winter and lower during the summer months, indicating a possible seasonal influence on the onset of AAD.5 In winter, exposure to low temperatures activates the sympathetic nervous system, leading to increased secretion of catecholamines. This response results in a higher heart rate, vasoconstriction, elevated peripheral vascular resistance, and increased systemic blood pressure, which collectively elevate the risk of AAD.6
In 2018, a study identified PM2.5 and SO2 as independent predictors of AAD incidence.7 Subsequent research further established a significant association between short-term exposure to PM2.5, PM10, and SO2 and the daily occurrence of AAD. Notably, PM10 and SO2 were strong predictors of AAD incidence in regions with moderate pollution levels.8 These observations are consistent with the results of the current study. The role of PM2.5 in inducing AAD may be related to the activation of the ERK 1/2 MAPK signaling pathway, which contributes to apoptosis in human aortic smooth muscle cells.9 Additionally, this study found that an increase in dew point is associated with a higher risk of AAD, while a decrease in minimum temperature correlates with a reduced risk of AAD. This finding is consistent with previous research, which has demonstrated a significant correlation between low temperatures and AAD onset.10 The increased risk of AAD associated with higher dew points could be explained by several mechanisms: high dew points are often correlated with elevated temperatures and relative humidity, which can inhibit sweat evaporation and lead to increased core body temperature. In response, the body initiates peripheral vasodilation and sweating to reduce core temperature, potentially resulting in dehydration, blood concentration, and electrolyte imbalances. These changes may further activate the sympathetic nervous system, leading to tachycardia. Furthermore, exposure to heat can stimulate the release of endotoxins from the intestines, as well as IL-1 and IL-6 from muscle tissue into the systemic circulation, which triggers the activation of white blood cells and initiates an inflammatory response. This release of pro-inflammatory cytokines contributes to a range of inflammatory and procoagulant processes, which can promote the occurrence of AAD by increasing the expression of tissue factor, thrombomodulin, and von Willebrand factor. It may also inhibit fibrinolysis and decrease the levels of protein C, protein S, and antithrombin III, resulting in a procoagulant state.
Subgroup analysis revealed notable differences in susceptibility to environmental factors between genders. Males demonstrated heightened sensitivity to PM2.5, PM10, SO2, and dew point, whereas females did not reveal significant cumulative relationships with these factors across varying lag days. Interestingly, elevated CO levels were associated with a reduction in AAD occurrences among females. The findings also indicate that males may be more vulnerable to cardiovascular damage linked to air pollution.11
In terms of age-related differences, exposure to O3_8h and higher dew point values was associated with an increased risk of AAD in the ≤ 50 group, while no sensitivity to meteorological factors or air pollutants was observed in those over 50. Prior research has identified the average age of AAD onset as approximately 52.4 years, which aligns with the findings of this study. This could be attributed to the characteristics often seen in younger patients diagnosed with AAD, such as obesity and the presence of intimal flaps extending beyond the aortic branches. These factors can increase the non-true lumen blood supply, reduce perfusion to vital organs and the lower extremities, and increase associated risks.12 However, other studies have indicated that AAD is more frequently observed in older populations, highlighting the need for further investigation into the underlying mechanisms that contribute to these age-related susceptibilities.13 Additionally, among patients with diabetes, factors such as elevated carbon monoxide levels, higher dew point, and lower minimum temperatures were associated with an increased risk of AAD. In patients with hypertension, dew point emerged as a risk factor, whereas CO exposure appeared to have a protective effect. This observation contrasts with traditional understanding, yet recent research has revealed that despite the mitochondrial inhibition being the primary toxic mechanism of CO poisoning, CO exposure can increase mitochondrial production of reactive oxygen species, which may confer anti-apoptotic, anti-inflammatory, and antioxidant benefits. Another study has proposed that low-level inhalation of CO could mitigate hypoxic and ischemic damage in the brain and heart, potentially through the activation of mitochondria-derived vesicles. These findings indicate that further quantification of the vasodilatory effects of CO may have applications in medical interventions aimed at regulating vascular tone.14,15
This study enhances our understanding of the associations between environmental factors and AAD. Based on these findings, a series of preventive and control measures can be developed and implemented across public health, healthcare systems, and policy-making: In public health, real-time monitoring and early warning systems for pollutants (eg, PM2.5, SO2) and meteorological factors (eg, wind speed, dew point temperature) should be established based on lag days, with particular emphasis on strengthening health education for high-risk subgroups such as males and individuals aged≤50 years; healthcare systems can optimize resource allocation based on seasonal incidence patterns, increase emergency and cardiothoracic surgery reserves in winter, and establish rapid identification and treatment protocols for AAD; at the policy level, initiatives should promote clean heating in winter and reduce industrial pollution to lower concentrations of PM2.5 and PM10. These measures integrate the nonlinear lag associations of pollutants/meteorological factors and subgroup differences, providing a scientific basis for “precision prevention” and effectively enhancing regional cardiovascular disease control and prevention capabilities.
This study has certain limitations. First, although the data were collected from a leading hospital in Urumqi, the representativeness of the cases may be limited by patient referral preferences and geographical coverage, and the exclusion of cases from other hospitals may introduce selection bias. Second, while meteorological and air pollution data were obtained from authoritative platforms, the uneven spatial distribution of monitoring stations in Urumqi makes it difficult to fully reflect the heterogeneity of individual exposure. Finally, the study conducted sensitivity analyses only for conditions such as hypertension and diabetes but did not incorporate these factors—including blood pressure levels and antihypertensive treatments—as independent variables into the model, potentially leading to an incomplete model specification. Future research could expand sample coverage, integrate multi-source exposure data, and explore the impacts of long-term exposure and gene-environment interactions.
Conclusions
This study reveals that air pollution and meteorological factors significantly impact the risk of AAD in Urumqi, with higher incidence observed during the cold season. Key factors include PM2.5, PM10, SO2, and wind speed. These results emphasize the importance of incorporating environmental factors into AAD prevention strategies in regions with significant seasonal and pollution variations.
Abbreviation
AAD, Acute aortic dissection; AQI, air quality index; VIF, variance inflation factor; DLNM, Distributed Lag Nonlinear Model; CT, Computed tomography; MRI, Magnetic Resonance Imaging.
Data Sharing Statement
All data generated or analysed during this study are included in this article. Further enquiries can be directed to the corresponding author.
Ethics Approval and Consent to Participate
This study was conducted with approval from the Ethics Committee of People’s Hospital of Xinjiang Uygur Autonomous Region (KY2024092001). This study was conducted in accordance with the declaration of Helsinki. Written informed consent was obtained from all participants.
Acknowledgments
We appreciate the support of the People’s Hospital of Xinjiang Uygur Autonomous Region for our work.
Funding
This study was supported by grants from Department of Human Resources and Social Security of Xinjiang Uygur Autonomous Region - “Tianchi Talent” Introduction Plan: A study on the morphological changes of aorta and related influencing factors after Sun’s Procedure for Stanford Type A aortic dissection, which sponsored by Yu-kui Du; The Program of High-level Medical and Health Talents in the “Tianshan Yingcai” Project of the Third Batch of the “2+5” Key Talent Plan in Xinjiang Uygur Autonomous Region - Young and Middle-aged Backbone Medical Talents (No. TSYC202401B073), sponsored by Feng-xia Wang.
Disclosure
The authors declare that they have no competing interests in this work.
References
1. Xin Y, Lyu S, Wang J, et al. Predictive Value of Inflammatory Indexes in in-Hospital Mortality for Patients with Acute Aortic Dissection. BMC Cardiovasc Disord. 2025;25(1):323. Epub 20250425. doi:10.1186/s12872-025-04775-9
2. Zhang H, Yin L, Zhang Y, et al. Short-Term Effects of Air Pollution and Weather Changes on the Occurrence of Acute Aortic Dissection in a Cold Region. Front Public Health. 2023;11:1172532. Epub 20230802. doi:10.3389/fpubh.2023.1172532
3. Yu X, Xia L, Xiao J, et al. Association of Daily Mean Temperature and Temperature Variability with Onset Risks of Acute Aortic Dissection. J Am Heart Assoc. 2021;10(13):e020190. Epub 20210625. doi:10.1161/jaha.120.020190
4. Gui SY, Wang XC, Qiao JC, et al. Short-Term Exposure to Air Pollution and Outpatient Visits for Conjunctivitis: a Time-Series Analysis in Urumqi, China. Environ Sci Pollut Res Int. 2023;30(24):66400–66416. Epub 20230425. doi:10.1007/s11356-023-26995-2
5. He XN, Zhan JL, Zhang C, et al. Impact of Meteorological Conditions and Pm2.5 on the Onset of Acute Aortic Dissection in Monsoonal Climate. J Geriatr Cardiol. 2018;15(4):315–320. doi:10.11909/j.issn.1671-5411.2018.04.001
6. Siddiqi HK, Bossone E, Pyeritz RE, Eagle KA. Chronobiology of Acute Aortic Syndromes. Heart Fail Clin. 2017;13(4):697–701. Epub 20170711. doi:10.1016/j.hfc.2017.05.006.
7. Xie N, Zou L, Ye L. The Effect of Meteorological Conditions and Air Pollution on the Occurrence of Type a and B Acute Aortic Dissections. Int J Biometeorol. 2018;62(9):1607–1613. Epub 20180519. doi:10.1007/s00484-018-1560-0.
8. Wang Q, Huang W, Kou B. Examining the Relationships between Air Pollutants and the Incidence of Acute Aortic Dissection with Electronic Medical Data in a Moderately Polluted Area of Northwest China. Inquiry. 2021;58:469580211065691. doi:10.1177/00469580211065691
9. Ming Y, Zhou X, Liu G, et al. Pm2.5 Exposure Exacerbates Mice Thoracic Aortic Aneurysm and Dissection by Inducing Smooth Muscle Cell Apoptosis Via the MAPK Pathway. Chemosphere. 2023;313:137500. Epub 20221207. doi:10.1016/j.chemosphere.2022.137500
10. Zhang Q, Peng L, Hu J, et al. Low Temperature and Temperature Decline Increase Acute Aortic Dissection Risk and Burden: a Nationwide Case Crossover Analysis at Hourly Level among 40,270 Patients. Lancet Reg Health West Pac. 2022;28:100562. Epub 20220810. doi:10.1016/j.lanwpc.2022.100562
11. Chang CY, Wu CF, Muo CH, Chang SS, Chen PC. Sex Differences in Temporal Trends and Risk Factors of Aortic Dissection in Taiwan. J Am Heart Assoc. 2023;12(5):e027833. Epub 20230227. doi:10.1161/jaha.122.027833.
12. Wu S, Cao C, Lun Y, et al. Age-Related Differences in Acute Aortic Dissection. J Vasc Surg. 2022;75(2):473–83.e4. Epub 20210922. doi:10.1016/j.jvs.2021.08.086
13. Wu H, Wang Z, Li M, et al. A Systematic Review and Meta-Analysis of Seasonal and Monthly Variability in the Incidence of Acute Aortic Dissection. Ann Vasc Surg. 2022;85:383–394. Epub 20220422. doi:10.1016/j.avsg.2022.04.008
14. Guo Y, Guan T, Jiao X, et al. Carbon Monoxide Preconditioning Is Mediated Via Activation of Mitochondrial-Derived Vesicles. Brain Res Bull. 2023;195:99–108. Epub 20230217. doi:10.1016/j.brainresbull.2023.02.011
15. Knauert M, Vangala S, Haslip M, Lee PJ. Therapeutic Applications of Carbon Monoxide. Oxid Med Cell Longev. 2013;2013:360815. Epub 20131204. doi:10.1155/2013/360815.
 © 2025 The Author(s). This work is published and licensed by Dove Medical Press Limited. The
full terms of this license are available at https://www.dovepress.com/terms.php
and incorporate the Creative Commons Attribution
- Non Commercial (unported, 4.0) License.
By accessing the work you hereby accept the Terms. Non-commercial uses of the work are permitted
without any further permission from Dove Medical Press Limited, provided the work is properly
attributed. For permission for commercial use of this work, please see paragraphs 4.2 and 5 of our Terms.
© 2025 The Author(s). This work is published and licensed by Dove Medical Press Limited. The
full terms of this license are available at https://www.dovepress.com/terms.php
and incorporate the Creative Commons Attribution
- Non Commercial (unported, 4.0) License.
By accessing the work you hereby accept the Terms. Non-commercial uses of the work are permitted
without any further permission from Dove Medical Press Limited, provided the work is properly
attributed. For permission for commercial use of this work, please see paragraphs 4.2 and 5 of our Terms.