")
Back to Journals » Journal of Inflammation Research » Volume 17
The Role of Platelet Distribution Width in the Association Between Blood Glucose and Neurological Impairment Severity in Acute Ischemic Stroke: A Moderated Mediation Model
Authors Rong N , Li ZW, Yuan J, Shao ZM, Deng Y, Zhu DS , Sun ZW
Received 31 May 2024
Accepted for publication 22 August 2024
Published 4 September 2024 Volume 2024:17 Pages 6039—6050
DOI https://doi.org/10.2147/JIR.S471841
Checked for plagiarism Yes
Review by Single anonymous peer review
Peer reviewer comments 2
Editor who approved publication: Dr Tara Strutt
Ning Rong,1 Zhi-Wei Li,1 Jian Yuan,2 Ze-Min Shao,2 Yun Deng,2 De-Sheng Zhu,2,3 Zhong-Wu Sun1
1Department of Neurology, First Affiliated Hospital of Anhui Medical University, Hefei, 230022, People’s Republic of China; 2Department of Neurology, Baoshan Branch, Ren Ji Hospital, Shanghai Jiao Tong University School of Medicine, Shanghai, 200444, People’s Republic of China; 3Department of Neurology, Ren Ji Hospital, Shanghai Jiao Tong University School of Medicine, Shanghai, 200127, People’s Republic of China
Correspondence: Zhong-Wu Sun, Department of Neurology, First Affiliated Hospital of Anhui Medical University, Hefei, 230022, People’s Republic of China, Tel +86-13805515857, Email [email protected] De-Sheng Zhu, Department of Neurology, Ren Ji Hospital, Shanghai Jiao Tong University School of Medicine, No. 160, Pujian Road, Shanghai, 200127, People’s Republic of China, Tel +86-13564719779, Email [email protected]
Objective: Fasting blood glucose (FBG) is a recognized risk factor for Ischemic Stroke, but little research has examined the interaction among FBG, Platelet Distribution Width (PDW) and the severity of neuronal damage. Thus, the present study constructs a moderated mediation model aimed to elucidate the relationships among FBG, PDW, and NIHSS scores in patients with acute ischemic stroke (AIS).
Methods: We conducted a cross-sectional study on 431 AIS patients. Upon hospital admission, we assessed the patients’ NIHSS scores and collected blood samples to measure FBG and PDW levels. The relationship between FBG and NIHSS scores moderated by PDW was analyzed by linear curve fitting analysis, multiple linear regression analysis, and moderated mediation analysis respectively.
Results: In the tertile grouping based on FBG, both PDW and NIHSS scores of AIS patients demonstrated an increase corresponding with rising levels of FBG (p< 0.001 for both). Multiple linear regression analysis revealed that, the β coefficients (95% CI) for the relationship between FBG and NIHSS scores were 1.49 (1.27– 1.71, p< 0.01) post-adjustment for potential confounders. The β coefficients (95% CI) for the relationship between FBG and PDW were 0.02 (0.01– 0.04, p< 0.01) post-adjustment. Likewise, for the relationship between PDW and NIHSS scores, the β coefficients (95% CI) were 4.33 (3.07– 5.59, p< 0.01) after adjustment. These positive association remained consistent in sensitivity analysis and hierarchical analysis. Smoothed plots suggested that there are linear relationships between FBG and PDW and NIHSS scores respectively. Further mediation analysis indicated that increased PDW significantly (p< 0.01) mediated 5.91% of FBG-associated increased NIHSS scores.
Conclusion: This study suggested that FBG levels were associated with NIHSS scores, and the FBG-associated neurological impairment may be partially mediated by PDW. These findings underscore the importance of monitoring FBG and PDW levels in AIS patients, potentially guiding risk intervention strategies.
Keywords: acute ischemic stroke, fasting blood glucose, platelet distribution width, multivariate analysis, mediation analysis
Introduction
Acute Ischemic Stroke (AIS) is characterized by the abrupt cessation of blood supply to specific areas of the brain, leading to the loss of neurological function. It is one of the leading causes of adult death and long-term disability worldwide. Globally, over 13.7 million people suffer from strokes annually, with approximately 70% (9.5 million) of these strokes being ischemic.1 The incidence of AIS is closely associated with cerebral arteriosclerosis and hemodynamic abnormalities and is related to traditional risk factors such as diabetes, hypertension, heart disease, smoking, obesity, and an unhealthy lifestyle.2 Among these, elevated fasting blood glucose (FBG) levels are widely considered an independent risk factor for AIS, increasing the risk irrespective of diabetic status.3 In patients with AIS, an elevated FBG level at admission is a common finding and is associated with poor function, increased mortality, and a higher rate of complications regardless of the stroke subtype or severity.4,5 Recent meta-analyses have shown that FBG levels are positively correlated with stroke risk in a nonlinear dose-response relationship.6 Furthermore, studies have indicated that high FBG levels are associated with a higher mortality risk and poor prognosis in AIS patients, irrespective of stroke severity, diabetes, infarct volume, or age.7 However, despite its recognized importance, current understanding of how FBG may affect the extent of neurological damage and recovery process in AIS patients through different biomarkers is still limited.
Platelet Distribution Width (PDW) is a parameter reflecting the heterogeneity of platelet (PLT) volume in peripheral blood. A higher PDW value indicates greater variability in PLT volume and volume heterogeneity.8 Recent studies have found that PDW is related to the degree of PLT activation, and an increase in PDW levels may be a useful marker for inflammatory responses and prothrombotic states.9 The occurrence of cerebral infarction results from thrombus formation in the cerebral vessels, with typical thrombi composed of varying proportions of fibrin, PLTs, red blood cells (RBCs), and white blood cells (WBCs).10 PLT s are rapidly activated and accumulate at the site of thrombus formation in the initial stages of thrombus formation.10 Arboix et al found that hematological disorders, particularly essential thrombocythemia, are the most common cause of AIS due to unusual etiologies, in this context, coagulation and fibrinolytic dysfunctions, platelet hyperactivity, and erythrocyte abnormalities play a critical and indispensable role in the pathogenesis of AIS.11 Previous studies observed that high PDW is an independent predictor of poor prognosis in patients with heart failure, associated with enhanced PLT activation.12 A recent study suggested that PDW is an important risk factor for stroke because it can reflect a pre-thrombotic state, potentially serving as a novel biomarker for predicting stroke.13
The National Institutes of Health Stroke Scale (NIHSS) is one of the standard methods for assessing the severity of a stroke. In practice, the NIHSS is used for early prediction and serial assessment of neurological deficits, with good reliability and validity. Clinically significant changes in NIHSS scores often occur after the initial onset of a stroke, reflecting secondary neurological damage or improvement in neurological function.14
Previous studies on the relationship between FBG and AIS have mainly focused on prognosis and mortality, while the interaction between FBG, PDW, and the severity of neurological damage remains unclear. Specifically, there is a lack of a systematic research model to elucidate the potential mediating and moderating mechanisms among these variables. Therefore, this study constructs a moderated mediation model aimed at elucidating the relationship between FBG and NIHSS scores, mediated by PDW.
Subjects and Methods
Ethics
In accordance with the Declaration of Helsinki, this study was approved by the ethics committee of Shanghai Jiao Tong University School of Medicine Affiliated Renji Hospital, Shanghai, China (Ethics Approval Number 2022-KSSC-01). All study subjects or their immediate family members (Patients with consciousness disorder or dysarthria after AIS) provided informed consent prior to sample collection.
Design
The study was performed in a cross-sectional design aimed to explore the association between FBG and NIHSS scores and moderated by PDW in the AIS patients. Consecutive AIS patients were enrolled in this study from Renji Hospital Baoshan Branch and the First Affiliated Hospital of Anhui Medical University in China during January 1, 2018, and August 31, 2019. In the hospital’s Stroke Registry Database, patient data were recorded.
Study Subjects
Patients were diagnosed with AIS according to the criteria defined by the World Health Organization criteria.15 The inclusion criteria were (1) acute onset of ischemic stroke within 24 hours, (2) Ischemic stroke symptoms and signs that can be clinically evaluated, (3) confirmation by computed tomography (CT) or magnetic resonance imaging (MRI) of the brain within 24 hours after admission, follow-up CT or MRI was performed within 14 days of admission or in any case of neurological deterioration, and (4) aged ≥40 years.
The following exclusion criteria were employed:16 (1) intracerebral hemorrhage, (2) transient ischemic attack, (3) Cardiogenic cerebral embolism, (4) massive cerebral infarction caused by occlusion of the internal carotid artery trunk, the middle cerebral artery trunk, or complete occlusion of its cortical branches involves at least 2/3 of the middle cerebral artery territory on the affected side within 48 hours of onset, (5) malignancies, (6) leukemia, megaloblastic anemia, post-splenectomy, giant platelet syndrome, primary thrombocytopenia, and aplastic anemia, (7) acute myocardial infarction, cardiac valvulopathy, and (8) clinical and laboratory data were not available for analysis, including unintegrated patient data.
Clinical Characteristics and Laboratory Data
All patients’ medical records and sample data were kept in our hospital described in our previous study.17 The baseline data for demographic characteristics, medical history (ischemic stroke, hypertension, diabetes, atrial fibrillation, cardiac insufficiency, pneumonia), and drugs used before admission (antiplatelet drugs, anticoagulant drugs, lipid lowering drugs, antidiabetic drugs, and antihypertensive drugs) were collected in detail by interviewed with patients and their family members upon admission.
Fasting venous blood samples were obtained within one hour after admission and before administration of therapy, including intravenous recombinant tissue type plasminogen activator (rt-PA) and any angioplasty procedure in the emergency room. Blood sample was collected into an EDTA-containing vacuum tubes to assess levels of FBG, which were measured with a commercially available quantitative test kit (semi-automatic coagulation instrument) purchased from the Biotechnology Co., Ltd (Shanghai, China). The intra-assay and interassay coefficients of variation were 5.0% and 10.0%, respectively, while the normal reference range of FBG levels ranged between 3.9 to 6.1 mmol/L. Additionally, another blood specimen was collected using an EDTA vacuum tube to detect the level of PDW, which was measured by an XFA6100 automatic hematology analyzer. Intra- and interassay coefficients of variation were 4% and 10%, respectively. The normal range of PDW in our laboratory was between 9.8 fL and 16.1 fL. Routine blood examinations including RBC count, WBC count, PLT count, Mean platelet volume (MPV), hemoglobin (HGB). Blood biochemical examinations including alanine aminotransferase (ALT), total bilirubin (TBIL), total protein, uric acid (UA), creatinine, Homocysteine (HCY), total cholesterol (TC), low-density lipoprotein cholesterol (LDL-C), high-density lipoprotein cholesterol (HDL-C), and Glycosylated hemoglobin. Blood clotting examinations including international normalized ratio (INR), prothrombin time (PT). Tumor index including alpha fetoprotein (AFP), and carcinoembryonic antigen (CEA) were also measured using fasting blood samples collected by venipuncture. All determinations were performed by laboratory technicians blinded to all clinical data.
Groups
In this study, all AIS patients were grouped based on two criteria. Firstly, in the baseline characteristics analysis, patients were categorized into tertiles T1 (low), T2 (middle) and T3 (high) according to FBG levels. Additionally, AIS patients were classified based on PDW levels, with values exceeding 16.1 fL indicating high PDW. Patients were also stratified based on a NIHSS scores threshold of 15. In the multiple linear regression analysis, AIS patients were further divided into tertiles T1 (low), T2 (middle) and T3 (high) according to PDW levels. Secondly, hierarchical analysis was conducted based on the clinical normal reference values for various indicators. Abnormal ranges were defined as RBC counts≤4.0×10¹²/L, LDL levels >1.8 mmol/L, TC levels >5.2 mmol/L, TBIL levels >17.1 μmol/L, creatinine levels >71 μmol/L, and UA levels >360 μmol/L, each indicative of respective parameter abnormalities.
Statistical Analysis
The characteristics of study participants at baseline are presented by FBG level. Categorical variables expressed as n (%) were analyzed using x2 and Fisher’s exact tests. Continuous variables were presented as means with standard deviations (Mean ± SD) for normal distribution data, which were analyzed by t tests, and they were expressed as median (interquartile range, IQR) for abnormal distribution data, which were analyzed by Mann–Whitney U-tests. The association among FBG, PDW, and NIHSS scores were assessed by linear curve fitting analyses (generalize additive models) and multivariate linear regression analysis. Age and gender were included in the multivariate models as conventional adjustment factors, and baseline variables considered clinically relevant to FBG and NIHSS scores or that showed a univariate relationship with FBG levels or NIHSS scores were selected into multivariate linear regression model. Both non-adjusted and adjusted models were used, and stratified analyses and interaction testing were performed. This study examined the proportion of mediation through PDW in the associations of FBG levels and NIHSS scores using the Process SPSS macro tool based on the mediation method recommended by Hayes.18 Statistical analyses were performed using the Statistical Package for the Social Sciences Software (SPSS) (version 24.0, Chicago, IL, USA) and R (version 3.6.3). The statistical significance level was set at a two-tailed p-value of <0.05.
Results
Baseline Characteristics
At the time of the final survey in October 2023, a total of 511 consecutive AIS candidates were recruited for the study. Among these AIS candidates, patients who had met any exclusion criteria were excluded (n=29), patients who had missing data related to FBG, PDW, and NIHSS scores were also excluded from the eligible candidates for the study (n=22). Further exclusions involved candidates with implausible FBG values (<3.0 mmol/L) (n=18) and unreliable PDW measurements (<10 fL) (n=11). Following these rigorous selection criteria, a cohort of 431 AIS subjects was finalized for subsequent analyses. The participant selection and screening process is delineated in Figure 1.
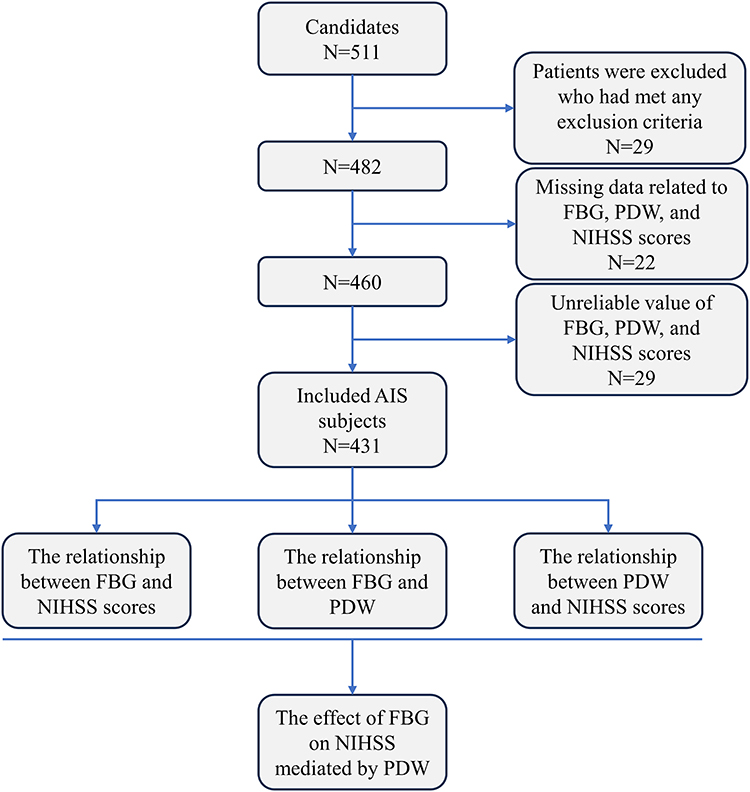 |
Figure 1 A flowchart of the study. |
Among 431 study AIS subjects, women accounted for 46.17% (n=199) and men for 53.83% (n=232). The age of the enrolled subjects ranged from 40–99 yr (women, 49–99 yr; men, 40–91 yr) with a mean age of 73.06±10.84 yr (women, 76.39±10.22 yr; men, 70.20±10.56 yr). The disease duration before admission ranged from 0.5–46 hours with a median and interquartile range of 7.0 (4.0–17.5) hours. The FBG levels ranged from 3.80–14.50 mmol/L, with a mean level of 6.09±1.85 ng/mL. The NIHSS scores ranged from 1–20, with a mean level of 9.14±5.08. The PDW values ranged from 15.2–17.4 fL, with mean values of 16.14±0.36 fL. The baseline characteristics of the included patients are shown in Table 1 and Supplement Table 1.
 |
Table 1 Characteristics and Laboratory Findings of the Participants According to FBG Levels (n = 431) |
The Relationship Between FBG and NIHSS Scores
In the multiple linear regression analyses examining the relationship between FBG and NIHSS scores, baseline variables identified as relevant through difference analysis or previous references or that showed a univariate relationship with NIHSS scores were selected for the multivariate linear regression model (Supplement Table 2). Thus, sex, age, RBC, PLT, HGB, TC, LDL-C, PDW, and the use of antidiabetic drugs were acknowledged as confounders affecting NIHSS scores. The multiple linear regression analysis yielded β coefficients (95% CI) of 1.64 (1.44–1.85, p<0.01) and 1.49 (1.27–1.71, p<0.01) for the FBG-NIHSS relationship, both pre- and post-adjustment for these confounders. Post-adjustment for confounding variables, the β coefficient (95% CI) for the FBG-NIHSS relationship exhibited a graded increase in line with the FBG level tertiles, as indicated by trend analysis (p<0.01) (Table 2), which showed a statistical significance. Hierarchical analyses stratified by sex, age, RBC, PLT, HGB, TC, LDL-C, PDW, and antidiabetic drugs consistently supported the statistically significant link between FBG and NIHSS scores, and interaction analysis also affirmed that these confounders had no significant interaction effect in the FBG-NIHSS scores relationship (Supplement Table 3). Additionally, this study conducted sensitivity analyses among AIS patients with hypertension, diabetes, and non-CHD, with all models demonstrating a significant positive correlation between FBG levels and NIHSS scores (Supplement Table 4). The smooth curve fitting plot, after adjusting for the mentioned confounders, depicted a linear relationship between FBG and NIHSS scores (Figure 2A).
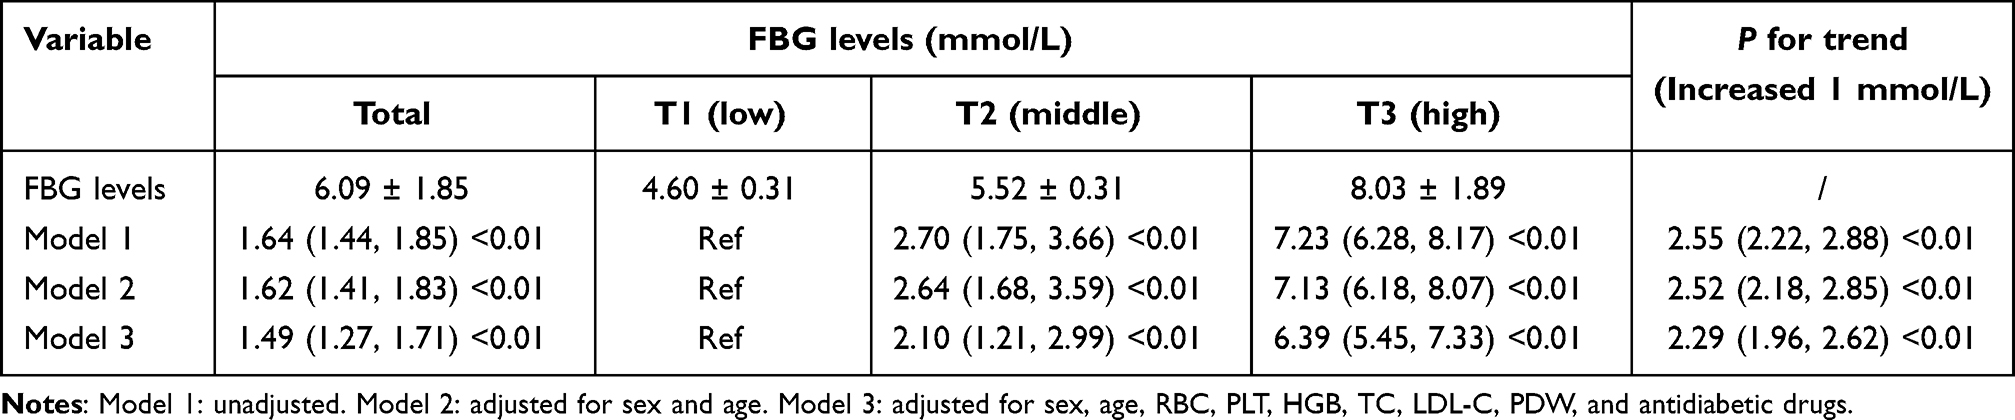 |
Table 2 Adjusted βs and 95% CIs for FBG Levels (Three Equal Parts) and NIHSS Scores (n = 431) |
 |
Figure 2 (A) The smooth curve fitting plot between FBG and NIHSS scores. A curve relationship between FBG and NIHSS scores was detected after adjusting for sex, age, RBC, PLT, HGB, LDL, TC, PDW, and antiplatelet drugs. (B) The smooth curve fitting plot between FBG and PDW. A linear relationship between FBG and NIHSS scores was detected after adjusting for sex, age, disease duration, diabetes, CHD, RBC, PLT, LDL-C, TC, TBIL, Creatinine, UA, lipid lowering drugs, antidiabetic drugs, and antiplatelet drugs. (C) The smooth curve fitting plot between PDW and NIHSS scores. A curve relationship between FBG and NIHSS scores was detected after adjusting for sex, age, RBC, PLT, HGB, TC, LDL-C, FBG, and antidiabetic drugs. Solid lines represent the fitting curve and dotted lines represent the corresponding 95% CI. |
The Relationship Between FBG and PDW
The baseline characteristics of the included patients grouped by PDW level are shown in Supplement Table 5. Comparing the groups with PDW levels ≤16.1 fL and >16.1 fL, the >16.1 fL group exhibited a higher mean FBG level than the ≤16.1 fL group (6.48 ± 2.14 mmol/L vs 5.67 ± 1.38 mmol/L, p<0.001).
In multiple linear regression analyses examining the FBG-PDW relationship, variables deemed relevant through difference analysis or previous references or that showed a univariate relationship with PDW were incorporated into a multivariate model (Supplement Table 6). Consequently, sex, age, disease duration, diabetes, CHD, RBC, PLT, LDL-C, TC, TBIL, Creatinine, UA, lipid lowering drugs, antidiabetic drugs, and antiplatelet drugs were identified as confounders for PDW. The multiple linear regression analysis revealed β coefficients (95% CI) of 0.04 (0.02–0.06, p<0.01) and 0.02 (0.01–0.04, p<0.01) for the FBG-PDW relationship, both before and after adjustment for these confounders. Post-adjustment, the β coefficient (95% CI) for the FBG-PDW relationship showed a graded increase in accordance with FBG level tertiles, as determined by trend analysis (p=0.03) (Table 3), which showed a statistical significance. Hierarchical analyses stratified by sex, age, disease duration, diabetes, CHD, RBC, PLT, LDL-C, TC, TBIL, creatinine, UA, lipid-lowering drugs, antidiabetic drugs, and antiplatelet drugs further corroborated the statistically significant association between FBG and PDW, and interaction analysis confirmed that these confounders did not exhibit a significant interaction effect in the FBG-PDW relationship (Supplement Table 7). Similarly, in sensitivity analyses among AIS patients with hypertension, diabetes, and non-CHD, all models observed consistent findings (Supplement Table 8). After adjusting for the aforementioned confounders, the smooth curve fitting plot demonstrated a linear relationship between FBG and PDW (Figure 2B).
 |
Table 3 Adjusted βs and 95% CIs for FBG Levels (Three Equal Parts) and PDW Levels (n = 431) |
The Relationship Between PDW and NIHSS Scores
In the multiple linear regression analyses exploring the PDW-NIHSS scores relationship, baseline variables identified as relevant through difference analysis or previous references or that showed a univariate association with NIHSS scores were incorporated into a multivariate regression model (Supplement Table 2). Thus, sex, age, RBC, PLT, HGB, TC, LDL-C, PDW, and the use of antidiabetic drugs were acknowledged as confounders influencing NIHSS scores. The multiple linear regression analysis yielded β coefficients (95% CI) of 6.20 (5.01–7.38, p<0.01) and 4.33 (3.07–5.59, p<0.01) for the PDW-NIHSS relationship, both before and after adjustment for these confounders. Following adjustment for these variables, the β coefficient (95% CI) for the PDW-NIHSS relationship demonstrated a graded increase in line with the tertiles of PDW scores, as determined by trend analysis (p<0.01) (Table 4), which showed a statistical significance. Hierarchical analyses stratified by sex, age, RBC, PLT, HGB, TC, LDL-C, PDW, and antidiabetic drugs consistently supported the statistically significant association between PDW and NIHSS scores, with interaction analysis affirmed that these confounders had no significant interaction effect in the PDW-NIHSS scores relationship (Supplement Table 9). In sensitivity analyses for patients with hypertension, diabetes, and non-coronary heart disease, all models produced consistent results (Supplement Table 10). After adjusting for the aforementioned confounders, the smooth curve fitting plot illustrated a linear relationship between PDW and NIHSS scores (Figure 2C).
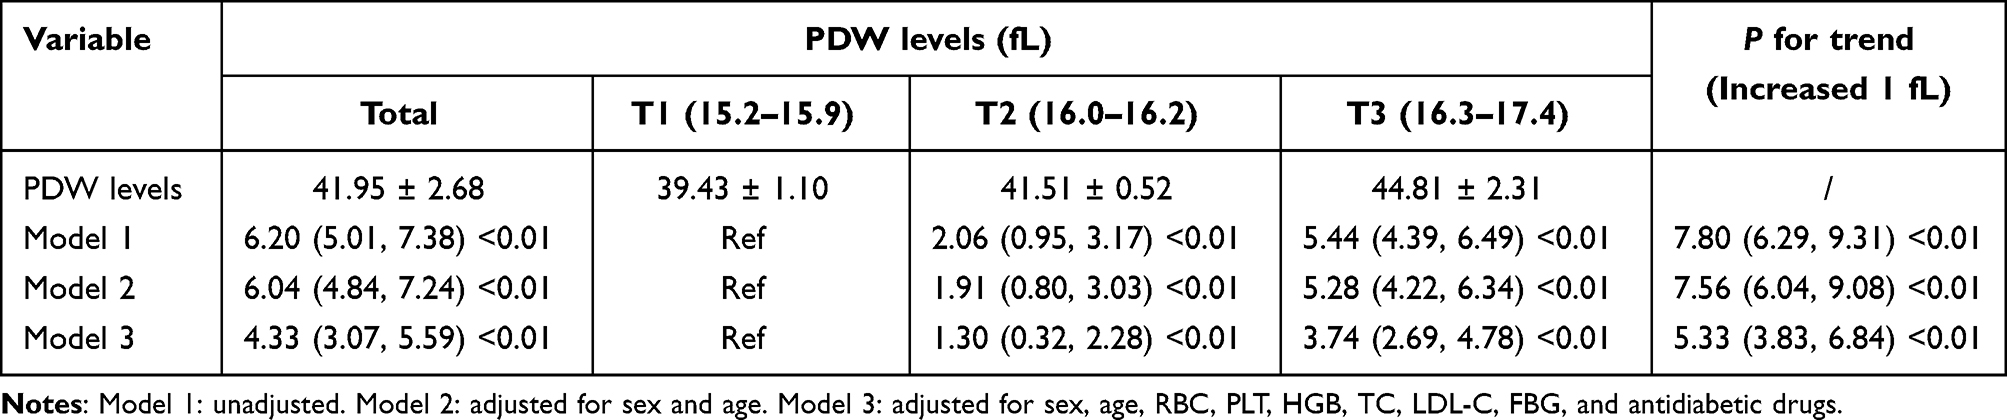 |
Table 4 Adjusted βs and 95% CIs for PDW Levels (Three Equal Parts) and NIHSS Scores (n = 431) |
The Effect of FBG on NIHSS Mediated by PDW
The outcomes of the multiple linear regression analysis established that the associations between FBG, PDW, and NIHSS scores conform to the criteria necessary for testing the moderated mediation model.
Supplement Table 11 and Supplement Table 12 elucidate both the total and direct effects between FBG and NIHSS scores, with a significant partial mediation effect by PDW observed in this relationship (Figure 3A). Specifically, increased levels of PDW were found to mediated 5.91% of the risk increase in NIHSS scores due to elevated FBG (Table 5). However, no significant interaction effect was observed between FBG and PDW in relation to NIHSS scores (p=0.908) (Supplement Table 13). Additionally, a simple slope analysis was conducted for all patients, showing that the level of PDW significantly affects the strength of the relationship between FBG and NIHSS scores (Supplement Table 14) (Figure 3B). Therefore, these findings suggest that the interaction between FBG and NIHSS scores is mediated through PDW.
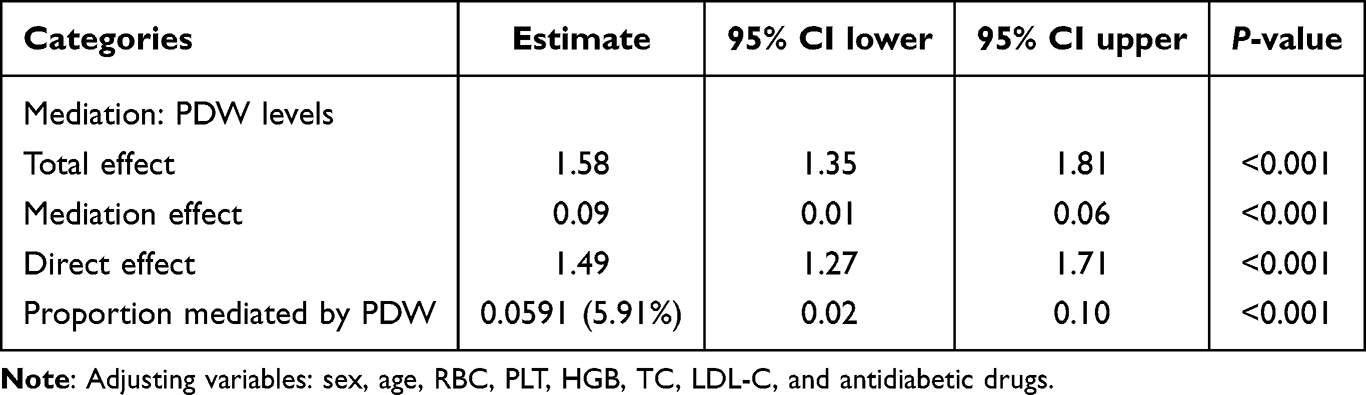 |
Table 5 Mediated Effects by PDW on the Associations of FBG Levels with NIHSS (n = 431) |
 |
Figure 3 The mediation model-The effect of FBG on NIHSS scores is mediated by PDW. (A) Interaction indexes, a refers to the direct effect of FBG on PDW, b refers the direct effect of PDW on NIHSS scores, c refers to the total effect of FBG on NIHSS scores, and c′ refer to the direct effect of FBG on NIHSS scores after controlling the indirect (mediated) effect of PDW. (B) The association between FBG and NIHSS scores was significantly positive by low (β=1.472 p<0.001), mean (β=1.486, p<0.001), and high (β=1.499, p<0.001) PDW groups. |
Discussion
In our study, we observed a significant independent association between FBG levels and NIHSS scores among patients with AIS, a relationship that persisted across all subgroups following adjustment for confounding variables. Further mediation analysis elucidated the role of PDW as a mediator in the relationship between FBG levels and NIHSS scores. Consequently, our findings suggest that FBG levels are correlated with NIHSS scores, and PDW may partially mediate the FBG-associated neurological impairment in AIS patients.
Our findings corroborate a significant correlation between FBG levels and NIHSS scores, aligning with previous research indicating elevated glucose levels as a crucial predictor of adverse outcomes in patients with AIS.19,20 Notably, the FBG levels assessed in this study were derived from a single measurement, which could reflect stress-induced hyperglycemia subsequent to AIS, with glucose fluctuations acting as a trigger for oxidative stress and inflammatory responses. Hyperglycemia, serving as an inflammatory mediator, may exacerbate inflammatory reactions, thereby leading to enhanced neuronal damage.21 Furthermore, as demonstrated by the sensitivity analysis in Supplement Table 4, a significant positive correlation between FBG levels and NIHSS scores was observed among patients with diabetes, suggesting that chronic hyperglycemia, through various mechanisms, exacerbates AIS, with immunity and inflammation recognized as crucial elements in the pathophysiology of stroke. Immune–inflammatory processes are involved in all stages of acute stroke, including initial artery occlusion, brain parenchymal damage, and subsequent tissue repair;22 Glucose and lipid interactions induce endothelial dysfunction, contributing to atherosclerosis and accelerating cerebrovascular events.23 These mechanisms collectively intensify neurological impairment. Therefore, early intervention for AIS patients with hyperglycemia is imperative.
In clinical practice, MPV and PDW are routinely measured parameters reflecting PLT size related to PLT activation. Under physiological conditions, MPV inversely correlates with PLT count; however, this physiological ratio may be disrupted in certain pathological conditions.24 Significant increases in PLT production or abnormalities, along with enhanced turnover, may result in variations in PLT volume, leading to heterogeneous PLT distribution and elevated PDW.25 Previous studies have shown a significantly increased incidence of atrial fibrillation among very elderly individuals aged 85 and older with lacunar infarcts, along with more severe focal neurological deficits.26 Therefore, we conducted stratified and interaction analyses using 85 years as the cutoff. The results showed that age did not have a statistically significant effect on the relationship between PDW and NIHSS scores, but there was a significant trend. This suggests that age is a factor worth considering in the PLT-mediated pathogenesis of AIS. Moreover, we observed that higher FBG levels were associated with increased levels of PDW and MPV in this study. As risk factors for cerebrovascular diseases, elevated glucose levels may activate PLT directly or indirectly, where enhanced adhesion and aggregation deplete a significant number of PLTs, thus elevating PDW values.27 Similar to our findings, Zaccardi F et al reported in a meta-analysis that subjects with type 2 diabetes mellitus tend to have higher MPV and PDW values compared to non-diabetic subjects, with no difference in PLT count.28 Studies suggest that diabetic patients with elevated MPV and PDW are at a higher risk of stroke.29 Izzi B and colleagues found that PDW, as a risk factor for thrombotic inflammatory diseases, has a greater predictive value than MPV.9 This discovery underscores the potential role of PDW in predicting thrombotic and inflammatory diseases, particularly in AIS. An increase in PDW may reflect the activated state of PLT in thrombosis and inflammation, providing an important biomarker for early identification and intervention.
Moreover, our study found a significant correlation between PDW and NIHSS scores, with further mediation analysis revealing that PDW partially mediates the relationship between FBG and NIHSS scores. To our knowledge, this is the first report of PDW mediating FBG-associated neurological impairment. The specific mechanisms remain unclear; however, the most plausible hypothesis, based on current studies, suggests that the inflammatory response induced by hyperglycemia plays a role. Inflammatory cells, by releasing pro-inflammatory cytokines (TNF-α, IL-1β) and superoxide anions, create a pro-inflammatory environment exerting neurotoxic effects;30 concurrently, these cells activate PLTs through the release of platelet-activating factors, thereby promoting thrombosis and exacerbating neurological damage.30,31 The discovery of this mediating effect provides a deeper understanding of the mechanisms by which FBG acts in AIS, offering new insights into the role of PLTs in hyperglycemic conditions.
Despite its significant insights, our study is not without limitations. Firstly, the establishment of causality requires larger-scale, prospective cohort studies due to the cross-sectional design of our research. Secondly, evidence of the interaction between FBG and PDW, derived from correlational studies, necessitates confirmation through animal or human experiments to validate the universality of our findings. Despite these limitations, the exclusion of potential confounding participants and the clinical validation of the methodologies employed in this study lend credibility and impact to our data and conclusions. In future research, we will employ longitudinal study designs to determine the causal relationship between FBG and PDW in the progression of AIS, particularly regarding the dynamic changes in platelet activation under hyperglycemic conditions. Additionally, further exploration of the specific mechanisms of FBG and PDW in AIS through molecular studies, especially those involving different inflammatory pathways and platelet activation, will be instrumental in identifying potential therapeutic targets.
Conclusion
In summary, our results reveal a significant correlation between elevated FBG and NIHSS scores in AIS patients, with PDW partially mediating FBG-associated neurological impairment. Future studies will further explore the specific mechanisms of FBG and PDW in AIS through longitudinal and molecular biology research.
Data Sharing Statement
The datasets generated during the current study are available from the corresponding author (Desheng Zhu) upon reasonable request.
Author Contributions
All authors made a significant contribution to the work reported, whether that is in the conception, study design, execution, acquisition of data, analysis and interpretation, or in all these areas; took part in drafting, revising or critically reviewing the article; gave final approval of the version to be published; have agreed on the journal to which the article has been submitted; and agree to be accountable for all aspects of the work.
Funding
This work was supported by Key Research and Development Projects of Anhui Province (202104j07020031). The China Stroke Association Whole Course Management of Cerebrovascular Disease Sailing Fund, No 202001(SDZ). The Project of Shanghai Baoshan District Science and Technology Commission, 2023-E-09 (SDZ), and 21- E-07(JY).
Disclosure
The authors declared they do not have anything to disclose regarding conflict of interest with respect to this manuscript.
References
1. Phipps MS, Cronin CA. Management of acute ischemic stroke. BMJ. 2020;368:l6983. doi:10.1136/bmj.l6983
2. Feske SK. Ischemic stroke. Am J Med. 2021;134(12):1457–1464. doi:10.1016/j.amjmed.2021.07.027
3. Sarwar N, Gao P, Seshasai SR, et al. Diabetes mellitus, fasting blood glucose concentration, and risk of vascular disease: a collaborative meta-analysis of 102 prospective studies. Lancet. 2010;375(9733):2215–2222. doi:10.1016/S0140-6736(10)60484-9
4. Bruno A, Levine SR, Frankel MR, et al. Admission glucose level and clinical outcomes in the NINDS rt-PA stroke trial. Neurology. 2002;59(5):669–674. doi:10.1212/WNL.59.5.669
5. Cai ZM, Zhang MM, Feng RQ, et al. Fasting blood glucose-to-glycated hemoglobin ratio and all-cause mortality among Chinese in-hospital patients with acute stroke: a 12-month follow-up study. BMC Geriatr. 2022;22(1):508. doi:10.1186/s12877-022-03203-3
6. Shi H, Ge Y, Wang H, et al. Fasting blood glucose and risk of stroke: a dose-response meta-analysis. Clin Nutr. 2021;40(5):3296–3304. doi:10.1016/j.clnu.2020.10.054
7. Fuentes B, Castillo J, San JB, et al. The prognostic value of capillary glucose levels in acute stroke: the GLycemia in acute stroke (GLIAS) study. Stroke. 2009;40(2):562–568. doi:10.1161/STROKEAHA.108.519926
8. Zheng YY, Wang L, Shi Q. Mean platelet volume (MPV) and platelet distribution width (PDW) predict clinical outcome of acute ischemic stroke: a systematic review and meta-analysis. J Clin Neurosci. 2022;101:221–227. doi:10.1016/j.jocn.2022.05.019
9. Izzi B, Gialluisi A, Gianfagna F, et al. Platelet distribution width is associated with P-selectin dependent platelet function: results from the moli-family cohort study. Cells. 2021;10(10):2737. doi:10.3390/cells10102737
10. Jolugbo P, Ariëns R. Thrombus composition and efficacy of thrombolysis and thrombectomy in acute ischemic stroke. Stroke. 2021;52(3):1131–1142. doi:10.1161/STROKEAHA.120.032810
11. Arboix A, Besses C. Cerebrovascular disease as the initial clinical presentation of haematological disorders. Eur Neurol. 1997;37(4):207–211. doi:10.1159/000117444
12. Sato Y, Yoshihisa A, Watanabe K, et al. Association between platelet distribution width and prognosis in patients with heart failure. PLoS One. 2020;15(12):e244608. doi:10.1371/journal.pone.0244608
13. Gao F, Chen C, Lyu J, et al. Association between platelet distribution width and poor outcome of acute ischemic stroke after intravenous thrombolysis. Neuropsychiatr Dis Treat. 2018;14:2233–2239. doi:10.2147/NDT.S170823
14. Du J, Wang Y, Che B, et al. The relationship between neurological function trajectory, assessed by repeated NIHSS measurement, and long-term cardiovascular events, recurrent stroke, and mortality after ischemic stroke. Int J Stroke. 2023;18(8):1005–1014. doi:10.1177/17474930231180446
15. Powers WJ, Rabinstein AA, Ackerson T, et al. Guidelines for the early management of patients with acute ischemic stroke: a guideline for healthcare professionals from the American Heart Association/American Stroke Association. Stroke. 2018;49(3):e46–e110. doi:10.1161/STR.0000000000000158
16. Huang Y, Li F, Chen Z, et al. Predictive value of degranulating factors of neutrophils in massive cerebral infarction. Cell Transplant. 2021;30:83905351. doi:10.1177/09636897211004089
17. Han L, Wang Z, Yuan J, et al. Circulating leukocyte as an inflammatory biomarker: association with fibrinogen and neuronal damage in acute ischemic stroke. J Inflamm Res. 2023;16:1213–1226. doi:10.2147/JIR.S399021
18. Hayes AF. Introduction to Mediation, Moderation, and Conditional Process Analysis: A Regression-Based Approach. Introduction to Mediation, Moderation, and Conditional Process Analysis: A Regression-Based Approach; 2013.
19. Zhang H, Yue K, Jiang Z, et al. Incidence of stress-induced hyperglycemia in acute ischemic stroke: a systematic review and meta-analysis. Brain Sci. 2023;13(4):556.
20. Muscari A, Falcone R, Recinella G, et al. Prognostic significance of diabetes and stress hyperglycemia in acute stroke patients. Diabetol Metab Syndr. 2022;14(1):126. doi:10.1186/s13098-022-00896-9
21. Wang L, Cheng Q, Hu T, et al. Impact of stress hyperglycemia on early neurological deterioration in acute ischemic stroke patients treated with intravenous thrombolysis. Front Neurol. 2022;13:870872. doi:10.3389/fneur.2022.870872
22. Lin SK, Chen PY, Chen GC, et al. Association of a high neutrophil-to-lymphocyte ratio with hyperdense artery sign and unfavorable short-term outcomes in patients with acute ischemic stroke. J Inflamm Res. 2021;14:313–324. doi:10.2147/JIR.S293825
23. La Sala L, Prattichizzo F, Ceriello A. The link between diabetes and atherosclerosis. Eur J Prev Cardiol. 2019;26(2_suppl):15–24. doi:10.1177/2047487319878373
24. Korniluk A, Koper-Lenkiewicz OM, Kamińska J, et al. Mean platelet volume (MPV): new perspectives for an old marker in the course and prognosis of inflammatory conditions. Mediators Inflamm. 2019;2019:9213074. doi:10.1155/2019/9213074
25. Wang Z, Liu C, Fang H. Blood cell parameters and predicting coronary in-stent restenosis. Angiology. 2019;70(8):711–718. doi:10.1177/0003319719830495
26. Arboix A, García-Eroles L, Massons J, et al. Lacunar infarcts in patients aged 85 years and older. Acta Neurol Scand. 2000;101(1):25–29. doi:10.1034/j.1600-0404.2000.00005.x
27. Batista TR, Figueiredo RC, Rios D. Platelets volume indexes and cardiovascular risk factors. Rev Assoc Med Bras. 2018;64(6):554–559. doi:10.1590/1806-9282.64.06.554
28. Zaccardi F, Rocca B, Pitocco D, et al. Platelet mean volume, distribution width, and count in type 2 diabetes, impaired fasting glucose, and metabolic syndrome: a meta-analysis. Diabetes Metab Res Rev. 2015;31(4):402–410. doi:10.1002/dmrr.2625
29. Demirtas L, Degirmenci H, Akbas EM, et al. Association of hematological indicies with diabetes, impaired glucose regulation and microvascular complications of diabetes. Int J Clin Exp Med. 2015;8(7):11420–11427.
30. Bettermann K, Sinha K, Kumari R, et al. The peripheral immune response in hyperglycemic stroke. Clin Neurol Neurosurg. 2020;195:106061. doi:10.1016/j.clineuro.2020.106061
31. Yao Y, Cao X, Zou R, et al. Study on the baseline factors and platelet indices that predict outcome of acute ischemic stroke patients after thrombolytic therapy. Cerebrovasc Dis. 2022;51(3):357–364. doi:10.1159/000519705
 © 2024 The Author(s). This work is published and licensed by Dove Medical Press Limited. The
full terms of this license are available at https://www.dovepress.com/terms.php
and incorporate the Creative Commons Attribution
- Non Commercial (unported, 3.0) License.
By accessing the work you hereby accept the Terms. Non-commercial uses of the work are permitted
without any further permission from Dove Medical Press Limited, provided the work is properly
attributed. For permission for commercial use of this work, please see paragraphs 4.2 and 5 of our Terms.
© 2024 The Author(s). This work is published and licensed by Dove Medical Press Limited. The
full terms of this license are available at https://www.dovepress.com/terms.php
and incorporate the Creative Commons Attribution
- Non Commercial (unported, 3.0) License.
By accessing the work you hereby accept the Terms. Non-commercial uses of the work are permitted
without any further permission from Dove Medical Press Limited, provided the work is properly
attributed. For permission for commercial use of this work, please see paragraphs 4.2 and 5 of our Terms.