")
Back to Journals » Clinical Ophthalmology » Volume 19
Thinning Choroidal Thickness and Flattening Morphology of Higher Myopia Eyes in Chinese Adults with Anisometropic Myopia: A Comparative Study
Authors Zhang Z, Bao Y, Cao J, Ma Y, Yu Y, Wang Z, Hu J, Liu F, Ye Y, Zhou X , Zhao J
Received 19 February 2025
Accepted for publication 19 May 2025
Published 1 June 2025 Volume 2025:19 Pages 1751—1762
DOI https://doi.org/10.2147/OPTH.S523747
Checked for plagiarism Yes
Review by Single anonymous peer review
Peer reviewer comments 3
Editor who approved publication: Dr Scott Fraser
Zhirong Zhang,1– 4,* Yongle Bao,1– 5,* Jian Cao,1– 4,* Yong Ma,1– 4 Yanze Yu,1– 4 Zhanying Wang,1– 4 Jiayi Hu,1– 4 Fang Liu,1– 4 Yuhao Ye,1– 4 Xingtao Zhou,1– 4 Jing Zhao1– 4
1Department of Ophthalmology, Eye and ENT Hospital, Fudan University, Shanghai, 200031, People’s Republic of China; 2Key Laboratory of Myopia and Related Eye Diseases, NHC, Shanghai, People’s Republic of China; 3Shanghai Research Center of Ophthalmology and Optometry, Eye & ENT Hospital, Fudan University, Shanghai, People’s Republic of China; 4Shanghai Engineering Research Center of Laser and Autostereoscopic 3D for Vision Care, Eye & ENT Hospital, Fudan University, Shanghai, People’s Republic of China; 5Department of Ophthalmology, Zhangye People’s Hospital, Hexi University, Zhangye, Gansu, 734000, People’s Republic of China
*These authors contributed equally to this work
Correspondence: Jing Zhao, Department of Ophthalmology, Eye and ENT Hospital of Fudan University; NHC Key Laboratory of Myopia; Laboratory of Myopia, Chinese Academy of Medical Sciences, 83 Fenyang Road, Shanghai, 200031, People’s Republic of China, Tel +86021-64377134, Email [email protected]
Purpose: To investigate variations in choroidal thickness and morphology in the eyes of Chinese adults with anisometropic myopia and their relationship with myopia.
Methods: This study included 107 adults (aged 17– 50 years) with myopia and normal visual acuity. Based on interocular differences in spherical equivalent (SE), participants were categorized into an anisometropia group (≥ 1 diopter, [D], N = 33) and a control group (< 1D, N = 74). Optical coherence tomography was used to measure ocular biometry and choroidal thickness at seven horizontal regions, extending from nasal (N) to temporal (T). These regions included the subfoveal region, 0.5 mm (T/N0.5), 1.5 mm (T/N1.5), and 2.5 mm (T/N2.5) from the subfoveal. A proposed fitting curve equation described the choroidal curvature.
Results: Binocular choroidal thickness exhibited a decreasing trend from temporal to nasal regions, with slight thickening in the subfoveal region compared to choroidal thickness at T0.5 and N0.5 in both groups (P < 0.01). In the anisometropia group, lower myopic eyes had greater choroidal thickness than those with higher myopia (P < 0.05). Fitting curve analysis revealed that eyes with lower myopia exhibited greater choroidal curvature than those with higher refractive power within the anisometropia group (P = 0.021). Additionally, choroidal thickness at parafoveal locations positively correlated with SE and negatively correlated with axial length in all eyes (P < 0.05).
Conclusion: In adults with myopia, choroidal thickness shows a decreasing trend from temporal to nasal region and is negatively correlated with myopia degree. Morphological flattening in anisometropic eyes suggests choroid remodeling for axial adaptation elongation.
Keywords: choroidal thickness, choroidal curvature, anisometropia, refractive error
Introduction
Myopia has emerged as a significant global public health challenge, with epidemiological projections suggesting that over half of the global population will be affected by 2050, accompanied by potentially severe complications, and threatening vision.1 The development of myopia is closely associated with excessive axial elongation, which displaces the retinal behind the focal plane of the eye. Although the mechanisms underlying this process are not fully understood, existing epidemiological research highlights a strong correlation between environmental and genetic factors related to myopia.2,3 However, even with identical environmental exposures and genetic backgrounds, patients may exhibit asymmetric ocular structures and corresponding refractive errors, such as anisometropia.
Previous studies on anisometropia or unilateral myopia have identified significant discrepancies in ocular structures, including crystalline lens morphology,4 corneal biomechanics,5 and choroidal thickness.6 Among these, the choroid, a vascular layer, plays a crucial role in delivering nutrients to the retina and the sclera.7 Evidence suggests that the choroids tend to thin during refractive development and ocular growth.8–10 Recent longitudinal and cross-sectional studies have revealed significant differences in choroidal thickness and morphology, particularly curvature, between anisometropic eyes.10,11 Alongside its role in perfusion and blood flow, the choroid is hypothesized to influence myopia development.12,13 However, these child-based studies primarily involving children may also be associated with or confounded by other ocular diseases, such as inherited retinal disease, amblyopia, and strabismus.6,14,15 The significant discrepancy in choroidal thickness between anisometropic and strabismic amblyopic eyes, their fellow eyes, and age-matched controls warrants further investigation to determine whether this discrepancy arises from amblyopia itself or variations in refractive error.6,16 Furthermore, although prior studies have predominantly concentrated on choroidal thickness, the role of choroidal curvature in asymmetric myopia progression or in stable adult eyes free from genetic and environmental confounders remains inadequately elucidated.
In this study, we aimed to investigate choroidal thickness and curvature in adults with a stable refractive status but myopic anisometropia, free from detectable ocular diseases, to explore potential differences in the choroid associated anisometropia. Additionally, we examined interocular variations in choroidal thickness and morphology, comparing these metrics with those of normal participants to elucidate the relationship between myopia development and choroidal changes.
Methods
Participants
This cross-sectional study was conducted at the Eye & ENT (EENT) Hospital of Fudan University and included 107 adult participants who visited the hospital between July 2024 and November 2024. Exclusion criteria included a history of ocular diseases, such as retinal diseases, amblyopia, or strabismus, and any systemic illnesses. The quality of all images was independently verified by two doctors (Y. B. and Z. Z). This study adhered to the principles of the Declaration of Helsinki and received approval from the Ethics Board of the EENT Hospital of Fudan University.
Data Collection and Group Classification
Participants underwent a comprehensive evaluation, including demographic data such as age, sex, and medical history. Refractive errors were assessed using autorefraction and manifest refraction, with the spherical equivalent (SE) calculated as SE = spherical + 1/2 cylinder. Based on interocular differences in SE, participants were categorized into two groups: the anisometropia group (SE differences ≥ 1D) and the control group (SE differences < 1D). In this classification system, the eye with a higher or lower refractive error is referred to as the higher or lower myopia eye, respectively.
Ocular biometry parameters were measured using an optical coherence tomography (OCT) device (Colombo IOL 2, Motive, Jiangxi, China), including axial length (AL), central corneal thickness (CCT), anterior chamber depth (ACD), lens thickness (LT), mean keratometry (Kmean), white-to-white ratio (WTW), pupil diameter (PD), retinal thickness (RT) and choroidal thickness.
The device demonstrated the ability to identify and measure choroidal thickness at seven specific locations within the macular region. A standardized dissection procedure was illustrated in Figure 1. Measurements were obtained along the horizontal meridian, with the fovea as the central reference point, extending 3 mm temporally and nasally. Measurements were adjusted for axial length using the instrument’s integrated correction algorithm. The instrument automatically generated corresponding choroidal images at these points. Based on these measurements, choroidal thickness was recorded at positions 0 (subfoveal), 0.5 mm, 1.5 mm, and 2.5 mm from the fovea in both temporal (T) and nasal (N) regions. These measurements were labeled as subfoveal choroidal thickness (SFCT), T/N0.5 (fovea), T/N1.5 (parafovea), and T/N2.5 (perifovea), respectively.13,17
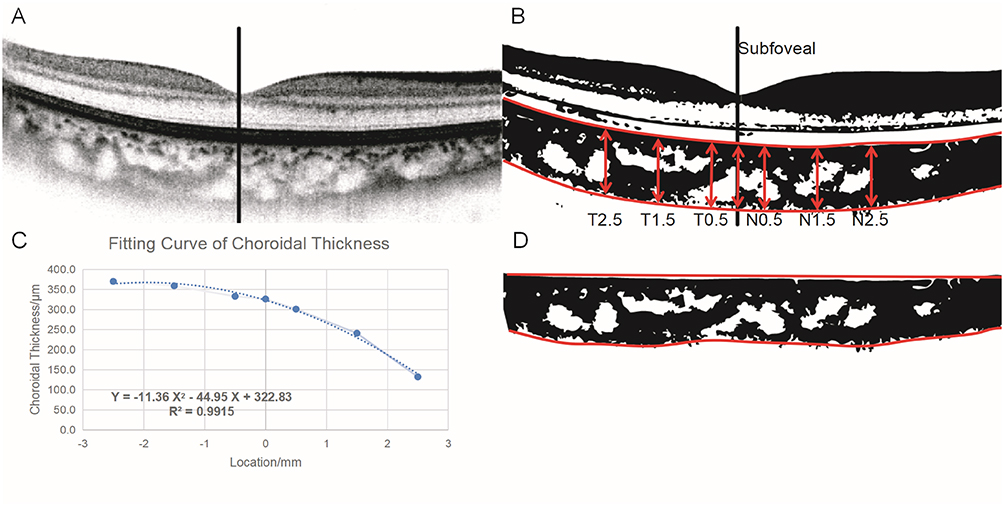 |
Figure 1 Choroidal thickness measurement. (A and B) The standardized dissection of the choroid and measurement of choroidal thickness are performed. (C) The fitting curve depicts choroidal curvature metrics by analyzing the thickness in seven regions. (D) The choroid is flattened to the superior interface. The A, B and D derived from the same participants. |
Fitting Curve for Choroidal Curvature Measurement
The fovea was automatically identified using OCT, and the foveal region was marked with a straight line, which served as the reference point in ImageJ software (NIH, Bethesda, MD, USA). A Cartesian coordinate system was then established, with the X-axis representing the horizontal distance from the fovea at seven points above it, and the Y-axis representing choroidal thickness (Figure 1C). A quadratic function was fitted to the choroidal thickness data at these seven points using Microsoft Excel (Microsoft Corp., Redmond, WA, USA). This analysis produced three parameters (A, B, and C), defined by the following equation:

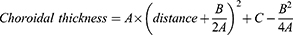
Where parameter A represents the overall morphological steepness of the quadratic function fit to the choroidal profile, parameter B determines the position of the vertex of the parabola. The vertex position, calculated as -B/(2A), corresponds to the theoretical location of the thickest point of the choroid. Parameter C indicates the fitted SFCT. The goodness of fit was evaluated using the coefficient of determination (R²). Additionally, the point-specific gradient of the choroidal thickness profile was calculated as:

which represents the instantaneous gradient of the choroidal thickness profile, given by the quadratic function.
Statistical Analysis
All statistical analyses were conducted using R software (version 4.3.2). Results are expressed as means ± standard deviation [range]. Δ values were calculated by subtracting the refractive error of the higher myopia eye from that of the eye with lower myopia. Paired sample t-tests were performed to compare interocular metrics, while independent sample t-tests were used to compare ocular metrics between the higher and lower myopic eyes in the control and anisometropia groups. Choroidal thickness at each region, Δ values, and curvature parameters (A, B, C, and R2) were analyzed using paired sample t-tests, within the monocular contiguous region and interocular corresponding regions. Pearson’s correlation coefficient was employed to assess relationships between choroidal thickness and ocular metrics. Statistical significance was defined as P<0.05.
Results
General Characteristics
A total of 107 participants were included in the study (Table 1). The anisometropia group consisted of 33 individuals, with a mean age of 25.36 ± 5.93 years, while the control group comprised 74 participants with a mean age of 26.07 ± 5.97 years. No significant difference in age was observed between the two groups (P > 0.05). Binocular biometry for each participant was categorized into higher and lower myopia groups based on interocular differences in SE. Significant differences in SE and AL were observed between the two eyes in both the control and anisometropia groups (P < 0.001). When comparing the two groups, higher myopia eyes in the anisometropia group exhibited slightly higher SE values than those in the control group, but not statistically significant (−6.20 ± 2.14 D vs −5.40 ± 1.97 D, P > 0.05). This result aligned with the categorization of anisometropia, where at least one anisometropic eye was expected to have a higher or lower degree of myopia compared to the control group. However, the differences in SE and AL between the eyes in the anisometropia group were significantly greater than those in the control group (P < 0.001).
 |
Table 1 Characteristics of Anisometropic Subjects |
Interocular Comparisons in Ocular Biometry
Discrepancies in binocular biometry within the anterior and posterior segments were further examined (Supplementary Table 1). A significant reduction in ACD was observed in both groups (P < 0.05). In the anisometropia group, significant interocular differences were found in SFCT, with the eye having lower myopia exhibiting a thicker SFCT compared to the eye with higher myopia (268.24 ± 67.74 μm vs 220.64 ± 67.08 μm, P < 0.001).
Variations in Choroidal Thickness Across Different Regions
In the perifoveal regions (within a 6-mm diameter), Figures 2A and B illustrated the choroidal thickness at seven specific locations ranging from the nasal (N2.5) to the temporal (T2.5) regions, and the differences between the two eyes. Overall, both groups exhibited a decreasing trend in choroidal thickness from the temporal to the nasal side (P < 0.05, for all regions except T2.5 and T1.5 in the anisometropia group). A slight thickening was observed in the foveal region compared to T0.5 and N0.5 (P < 0.01), as illustrated in Figures 2A and B with colored asterisks.
 |
Figure 2 Choroidal thickness and interocular differences values within seven regions. (A and B) Interocular comparisons in choroidal thickness in control and anisometropia groups. (C and D) Interocular differences value of choroidal thickness and comparisons between contiguous regions. Abbreviations: SF, subfoveal region; ChT, choroidal thickness; T0.5/1.5/2.5: temporal region 0.5/1.5/2.5 mm away from the subfoveal region; N0.5/1.5/2.5: nasal region 0.5/1.5/2.5 mm away from the subfoveal region. Notes: Data are expressed as the mean ± standard errors. Asterisk (black *) without line represents an interocular statistically significant difference. Asterisk (colored *) with line represents a comparison between contiguous regions. Paired sample t-test. Statistically significant differences are denoted by asterisks; *P<0.05, **P<0.01, and ***P<0.001. |
The interocular discrepancy in choroidal thickness was compared between the control and anisometropia groups, as illustrated in Figures 2A and B (black asterisks). In the control group, choroidal thickness in the higher myopic eyes was significantly greater than that in the lower myopic eyes within the temporal regions (T2.5 and T1.5; both P < 0.05). Conversely, in the nasal regions (N1.5 and N2.5) the pattern was reversed, with the lower myopic eyes exhibiting greater choroidal thickness (both P < 0.05). Moreover, the least interocular differences between higher and lower myopic eyes in the control group were observed in N0.5 (−0.60 ± 4.20 μm), rather than the foveal region (4.97 ± 4.34 μm). Partial statistically significant discrepancies in Δ values for the contiguous region were depicted in Figure 2C.
In contrast, the anisometropia group showed significant differences in choroidal thickness at all seven locations (all P < 0.05, Figure 2B). These differences increased progressively from T2.5 to N0.5, peaking at N0.5, and then decreased from N0.5 to N2.5. The smallest and largest interocular differences occurred at T2.5, and N0.5, respectively. Within the temporal regions, significant Δ values between the two eyes were identified when comparing T2.5 to T1.5 and T1.5 to T0.5 (both P < 0.05, Figure 2D). These findings suggested that the interocular differences in choroidal thickness followed a generally decreasing trend, with the nasal perifoveal region (fovea to N0.5 region) serving as a turning point.
Table 2 showed the factors associated with choroidal thickness. For all subjects, choroidal thickness at specific locations was positively correlated with SE and negatively correlated with AL in both higher and lower myopic eyes. The Δ values of choroidal thickness were positively correlated with differences in SE but negatively correlated with differences in AL. Moreover, as age increased, Δ values between the higher and lower myopic eyes tended to increase in the perifoveal regions (T0.5, C, and N0.5; all P < 0.05).
 |
Table 2 Effect of Myopia Degree on the Various Regions of the Choroidal Thickness |
Choroidal Morphology Fitting
Choroidal morphology was illustrated by comparing thickness metrics in specific regions. To further clarify overall morphology, a quadratic fitting curve was applied to depict the entire choroidal profile. Table 3 and Figure 3 presented the overall choroidal morphological characteristics derived from quadratic function fitting, revealing a distribution pattern where the choroid was thicker in the central regions and thinner in the periphery (R2 > 0.85). The symmetry axis of the choroidal profile was located in the temporal region, away from the foveal region, representing the thickest value of the choroid as determined by the fitting curve. In the control group, choroidal curvature was similar between lower and higher myopia eyes (−6.38 ± 4.22 vs −5.47 ± 4.70, P = 0.079). Conversely, in the anisometropia group, lower myopia eyes exhibited greater general choroidal curvature than higher ones (−8.1 ± 5.32 vs −5.24 ± 6.14, P = 0.021). When comparing the less myopic eye between the two groups, significant flattening in choroidal curvature was observed in the control group (−5.47±4.70 vs −8.1±5.32, P = 0.012). Regarding gradient metrics, the less myopic eyes in the anisometropia group exhibited a significantly larger gradient in the peripheral region (P = 0.010, 0.019, and 0.042 for T2.5, T1.5, and N2.5, respectively). Additionally, a significant difference in choroidal thickness was observed between lower and higher refractive power eyes in the anisometropia group (261.47 ± 66.24 μm vs 212.38 ± 67.85 μm, P < 0.001).
 |
Table 3 Intraocular Comparisons in Morphological Metrics of the Choroid |
 |
Figure 3 Fitted curve of choroidal thickness. The choroidal thickness is fitted by a simple quadratic function (zero reference locates in the C region), given by the equation: Choroidal thickness = A × distance2 + B × distance + C, where A is correlated with choroidal curvature, B is correlated with the symmetry axis or thickness region location (X distance =-A/(2B), as depicted by the dashed straight line), and C is the subfoveal choroidal thickness given by the fitted function. Abbreviations: SF, subfoveal region; ChT, choroidal thickness; Diff., interocular differences; T0.5/1.5/2.5: temporal region 0.5/1.5/2.5mm away from the subfoveal region; N0.5/1.5/2.5: nasal region 0.5/1.5/2.5mm away from the subfoveal region. |
Choroidal curvature was negatively correlated with SE, but positively associated with AL in both higher and lower myopic eyes in the control group (both P < 0.05), as shown in Table 4 and Supplementary Table 2. Figure 4 further showed the linear trend between fitting parameter A in higher myopia eyes in all participants (both P < 0.05). As the degree of myopia increased, the choroid appeared flatter (an increase value of A, since A is a negative value). These associations were also observed in gradient metrics in nasal directions (Table 4 and Supplementary Table 3).
 |
Table 4 Correlations Between Fitted Curve Metrics and Myopia Degree in All Participants |
 |
Figure 4 Correlations between refractive error and fitting metrics. (A, B and C) Linear regression between fitting metrics (parameter A, B, and C, respectively) and spherical equivalent (SE). (D, E and F) Linear regression between fitting metrics (parameter A, B, and C, respectively) and axial length (AL). The purple line with shadowed region and function indicate the linear regression among all participants. |
Discussion
Anisometropia indicates a significant variation in refractive power between the two eyes, which can result from a combination of genetic factors, environmental influences, and ocular conditions such as amblyopia and strabismus.18–20 Interocular asymmetry in axial elongation can lead to discrepancy in choroidal thickness. Examining choroidal thickness and morphological changes in anisometropic individuals provides a clearer understanding of these relationships while minimizing the confounding effects of environmental and genetic factors and individual variability. Most existing research on anisometropia focuses on children, who frequently present with coexisting ocular conditions like amblyopia21 and strabismus.6 However, studies examining adults with anisometropia who have normal vision and ocular health remain limited. In this study, we analyzed horizontal variations in choroidal morphology and interocular differences in adults with anisometropia, revealing a trend of decreasing choroidal thickness from the temporal to the nasal side. Additionally, longer axial lengths and higher refractive errors were associated with thinner but flatter choroids.
In both the anisometropia and control groups, choroidal thickness generally declined from the temporal to the nasal side, with slight thickening observed in the foveal region (Figures 2A and B). This pattern aligned with previous clinical studies and likely reflected physiological characteristics.22 Tang et al reported that the choroidal vascular layer in mice was thicker on the temporal side than on the nasal side.23
When comparing SFCT between lower and higher myopic eyes, our findings were consistent with previous research on anisometropia in children, which similarly reported a reduction in SFCT in the higher myopic eye.17 Furthermore, interocular differences in choroidal thickness followed a similar decreasing trend in the control group. However, in the anisometropia group, the largest interocular difference occurred at N0.5, while the smallest difference was observed at T2.5 (Figure 2D). This interocular difference in choroidal thickness may result from both passive and active adaptations to surrounding ocular components. During ocular development, the vitreous body expands, inducing passive thinning of the choroid in the more myopic eye.24 Additionally, based on defocus theory, the choroid undergoes asymmetric thinning as an active response to differing optical signals between the two eyes. This adaptation helps position the retina to optimize retinal image quality independently for each eye.24
As noted earlier, interocular differences in choroidal thickness were particularly pronounced in the anisometropia group, with the largest discrepancy observed in the parafoveal region. This phenomenon was interpreted by integrating findings on choroidal morphology and curvature. In this study, we found that eyes with lower refractive power exhibited greater choroidal curvature compared to those with higher refractive power in the anisometropia group. Longitudinal studies had demonstrated that increasing myopia was associated with axial elongation and morphological changes in both the choroid and sclera.10,25 Specifically, as myopia progresses, the choroidal profile tends to flatten, consistent with previous findings.11,26 This flattening may reflect morphological remodeling of the choroid as it adapts to axial elongation, a process that plays a pivotal role in myopia progression and ocular development.10,25 It is noteworthy that changes in choroidal curvature may not solely reflect adjustments in the choroid itself but may also be closely linked to scleral remodeling. Previous research had shown that in high myopia, posterior sclera elongation compressed the choroid, further amplifying changes in choroidal curvature.27 Our gradient analysis further revealed pronounced nasal choroidal thinning in higher myopia (evidenced by more negative gradient values), which may correlate with emerging optic disc tilt.28
We conducted a correlation analysis to validate the relationship between the degree of myopia and choroidal thickness. Our findings indicated a positive correlation between choroidal thickness and SE at specific measurement sites, suggesting that higher myopia is associated with a thinner choroid in adults. While this study focused on Chinese adults, our results aligned with previous clinical studies highlighting the choroid’s crucial role in accelerating ocular growth and maintaining refractive stability during both childhood and adulthood.29–31 Furthermore, animal studies in chicks and rhesus monkeys have demonstrated that under form deprivation and hyperopic defocus conditions, the choroid undergoes significant thinning, which reverses rapidly after lens removal.32–34 Additionally, we observed that longer axial length was associated with thinner choroids, consistent with findings from previous studies.24,35,36 However, Jin et al reported no significant association between changes in AL and choroidal thickness, which may be attributed to differences in the underlying mechanisms of the development.37 Our study also revealed that interocular differences in choroidal thickness correlated with interocular differences in SE and AL. Notably, age was negatively correlated with choroidal thickness, aligning with previous literature.22 Furthermore, we found that with increasing age, interocular differences in choroidal thickness in the parafoveal region (T0.5, SFCT, N0.5) became more pronounced, potentially reflecting the cumulative effects of aging on choroidal morphology.
This study had several limitations. First, we measured the choroidal thickness at only seven sites along the horizontal axis, which may not fully capture the three-dimensional morphological changes of the entire choroid. This limitation may have restricted a comprehensive understanding of choroidal structure. Considering the asymmetric characteristics of the choroid, with the thickest and thinnest areas located in the nasal and temporal regions, respectively, and minimal discrepancies between the superior and inferior regions, we focused on horizontal characteristics to explore potential interocular differences.38 Secondly, the instrument used in this study was limited to measuring choroidal thickness and could not directly assess the blood flow characteristics of the choroid, restricting our ability to explore the relationship between morphological changes and functional aspects. Future research should incorporate multidimensional imaging techniques and functional assessments to better elucidate the mechanisms by which the choroid contributes to the onset and progression of myopia. Lastly, our analysis relied on a quadratic fitting model, which, while providing a clinically interpretable measure of choroidal curvature, may oversimplify the complex topography of choroidal thinning. Future studies could compare multiple functional forms (eg, hyperbolic, exponential, or logarithmic models) to better capture potential asymmetries in choroidal morphology.
In conclusion, this study compared choroidal thickness in adults with anisometropia, revealing a decreasing trend in choroidal thickness along the horizontal axis and a negative relationship between choroidal thickness and the degree of myopia. Furthermore, the findings indicated that the choroid undergoes morphological remodeling and flattening to adapt to axial elongation of the eyeball.
Data Sharing Statement
The datasets generated and/or analyzed during the current study are not publicly available due to funding requirement but are available from the corresponding author on reasonable request.
Ethic Approved and Consent to Participate
The study was approved by the Ethics Committee Office of the Eye and ENT Hospital of Fudan University. All participants provided informed consent to participate in the study (Ethics No.: 20200530).
Consent for Publish
Written informed consent was obtained from the patients for the publication of this paper. Patients’ names are not applicable.
Funding
National Key Research and Development Program of China (2024YFC2510805); National Natural Science Foundation of China (Grant No. 82471116 & No. 82271119); Shanghai Oriental Talent Plan Youth Program (QNKJ2024055); Shanghai Rising-Star Program (23QA1401000); Healthy Young Talents Project of Shanghai Municipal Health Commission (2022YQ015); Project of Shanghai Science and Technology (21Y11909800); Hexi University President Fund youth research project (QN2024027); General topics of the 14th Five-Year Plan of Education Science of Gansu Province in 2024 (GS[2024]GHB1487). The funding agencies had no role in study design, data collection and analysis, interpretation of data, or writing the manuscript.
Disclosure
The authors report no conflicts of interest in this work.
References
1. Dolgin E. The myopia boom. Nature. 2015;519(7543):276. doi:10.1038/519276a
2. Baird PN, Saw SM, Lanca C, et al. Myopia. Nat Rev Dis Primers. 6(1):99. doi:10.1038/s41572-020-00231-4
3. Ohno-Matsui K, Wu PC, Yamashiro K, et al. IMI pathologic myopia. Invest Ophthalmol Vis Sci. 62(5):5. doi:10.1167/iovs.62.5.5
4. Zhang Y, Zhang J, Jin A, et al. Interocular difference in crystalline lens morphology in children and adolescents with unilateral high myopia. Asia Pac J Ophthalmol. 2024;13(1):100001. doi:10.1016/j.apjo.2023.100001
5. Liu Z, Parida S, Prasad R, Pandey R, Sharma D, Barman I. Vibrational spectroscopy for decoding cancer microbiota interactions: current evidence and future perspective. Semi Cancer Biol. 2022;86:743–752. doi:10.1016/j.semcancer.2021.07.004
6. Lempert P. Choroidal thickness of children’s eyes with anisometropic and strabismic amblyopia. J Aapos. 2016;20(2):186. doi:10.1016/j.jaapos.2015.07.289
7. Jeong H, Lee D, Negishi K, Tsubota K, Kurihara T. Establishment of an in vitro choroid complex system for vascular response screening. Sci Rep. 14(1):16129. doi:10.1038/s41598-024-67069-8
8. Prousali E, Dastiridou A, Ziakas N, Androudi S, Mataftsi A. Choroidal thickness and ocular growth in childhood. Surv Ophthalmol. 2021;66(2):261–275. doi:10.1016/j.survophthal.2020.06.008
9. Ablordeppey RK, Lin CR, Song B, Benavente-Perez A. Choroidal morphology and photoreceptor activity are related and affected by myopia development. Invest Ophthalmol Vis Sci. 2024;65(2):3. doi:10.1167/iovs.65.2.3
10. Hansen MH, Li XQ, Larsen M, et al. Five-year change in choroidal thickness in relation to body development and axial eye elongation: the CCC2000 Eye Study. Invest Ophthalmol Vis Sci. 60(12):3930–3936. doi:10.1167/iovs.19-26807
11. Xu S, Hu Y, Cui D, et al. Association between the posterior ocular contour pattern and progression of myopia in children: a prospective study based on OCT imaging. Ophthalmic Physiol Opt. 2021;41(5):1087–1096. doi:10.1111/opo.12850
12. Wu H, Zhang G, Shen M, et al. Assessment of choroidal vascularity and choriocapillaris blood perfusion in anisomyopic adults by SS-OCT/OCTA. Invest Ophthalmol Vis Sci. 62(1):8. doi:10.1167/iovs.62.1.8
13. Liu X, Lin Z, Wang F, et al. Choroidal thickness and choriocapillaris vascular density in myopic anisometropia. Eye Vis. 8(1):48. doi:10.1186/s40662-021-00269-9
14. Poels MMF, de Wit GC, Bijveld MMC, van Genderen MM. Natural course of refractive error in congenital stationary night blindness: implications for myopia treatment. Invest Ophthalmol Vis Sci. 65(14):9. doi:10.1167/iovs.65.14.9
15. Aygit ED, Yilmaz I, Ozkaya A, et al. Choroidal thickness of children’s eyes with anisometropic and strabismic amblyopia. J Aapos. 2015;19(3):237–241. doi:10.1016/j.jaapos.2015.03.013
16. Aslan Bayhan S, Bayhan HA. Effect of amblyopia treatment on choroidal thickness in children with hyperopic anisometropic amblyopia. Curr Eye Res. 2017;42(9):1254–1259. doi:10.1080/02713683.2017.1315141
17. Sun L, Xue M, Tang Y, et al. Association of choroidal thickness and blood flow features with asymmetric axial lengths in children with unilateral myopic anisometropia. BMC Ophthalmol. 24(1):329. doi:10.1186/s12886-024-03616-1
18. Jiang Y, Xiao X, Sun W, et al. Clinical and genetic risk factors underlying severe consequence identified in 75 families with unilateral high myopia. J Transl Med. 22(1):75. doi:10.1186/s12967-024-04886-5
19. Flitcroft I, McCullough S, Saunders K. What can anisometropia tell us about eye growth? Br J Ophthalmol. 2021;105(9):1211–1215. doi:10.1136/bjophthalmol-2020-316406
20. Barrett BT, Bradley A, Candy TR. The relationship between anisometropia and amblyopia. Prog Retin Eye Res. 2013;36:120–158. doi:10.1016/j.preteyeres.2013.05.001
21. Cao Y, Gu X, Zhang Y, Zhao J, Zhu D. Assessment of the effects of myopic and hyperopic anisometropia on choroidal vascular structure in children using SS-OCTA. Ophthalmic Physiol Opt. 2024;44(3):525–536. doi:10.1111/opo.13300
22. Manjunath V, Taha M, Fujimoto JG, Duker JS. Choroidal thickness in normal eyes measured using Cirrus HD optical coherence tomography. Am J Ophthalmol. 2010;150(3):325–329.e1. doi:10.1016/j.ajo.2010.04.018
23. Tang T, Ren C, Cai Y, Li Y, Wang K, Zhao M. Lifelong changes in the choroidal thickness, refractive status. Invest Ophthalmol Vis Sci. 65(12):26. doi:10.1167/iovs.65.12.26
24. Vincent SJ, Collins MJ, Read SA, Carney LG. Retinal and choroidal thickness in myopic anisometropia. Invest Ophthalmol Vis Sci. 54(4):2445–2456. doi:10.1167/iovs.12-11434
25. Jonas JB, Xu L. Histological changes of high axial myopia. Eye. 2014;28(2):113–117. doi:10.1038/eye.2013.223
26. Kuo AN, Verkicharla PK, McNabb RP, et al. Posterior eye shape measurement with retinal OCT compared to MRI. Invest Ophthalmol Vis Sci. 57(9):Oct196–203. doi:10.1167/iovs.15-18886
27. Jonas JB, Wang YX, Dong L, Guo Y, Panda-Jonas S. Advances in myopia research anatomical findings in highly myopic eyes. Eye Vis. 2020;7:45. doi:10.1186/s40662-020-00210-6
28. Zhang YQ, Zhang XJ, Shen RY, et al. Exploring optical coherence tomography parameters in eyes with myopic tilted disc. Eye Vis. 11(1):47. doi:10.1186/s40662-024-00411-3
29. Qi Y, Li L, Zhang F. Choroidal thickness in Chinese children aged 8 to 11 years with mild and moderate myopia. J Ophthalmol. 2018;2018:7270127. doi:10.1155/2018/7270127
30. Read SA, Collins MJ, Vincent SJ, Alonso-Caneiro D. Choroidal thickness in myopic and nonmyopic children assessed with enhanced depth imaging optical coherence tomography. Invest Ophthalmol Vis Sci. 54(12):7578–7586. doi:10.1167/iovs.13-12772
31. Cai W, Guo X, Wang W, et al. Two-year choroidal thickness attenuation and its associations in healthy Chinese adults. Transl Vis Sci Technol. 11(6):21. doi:10.1167/tvst.11.6.21
32. Wallman J, Wildsoet C, Xu A, et al. Moving the retina: choroidal modulation of refractive state. Vision Res. 1995;35(1):37–50. doi:10.1016/0042-6989(94)e0049-q
33. Wildsoet C, Wallman J. Choroidal and scleral mechanisms of compensation for spectacle lenses in chicks. Vision Res. 1995;35(9):1175–1194. doi:10.1016/0042-6989(94)00233-c
34. Hung LF, Wallman J, Smith EL. 3rdVision-dependent changes in the choroidal thickness of macaque monkeys. Invest Ophthalmol Vis Sci. 2000;41(6):1259–1269.
35. Xu M, Yu X, Wan M, et al. Two-year longitudinal change in choroidal and retinal thickness in school-aged myopic children: exploratory analysis of clinical trials for myopia progression. Eye Vis. 2022;9(1):5. doi:10.1186/s40662-022-00276-4
36. Read SA, Alonso-Caneiro D, Vincent SJ, Collins MJ. Longitudinal changes in choroidal thickness and eye growth in childhood. Invest Ophthalmol Vis Sci. 2015;56(5):3103–3112. doi:10.1167/iovs.15-16446
37. Jin P, Zou H, Xu X, et al. Longitudinal changes in choroidal and retinal thicknesses in children with myopic shift. Retina. 2019;39(6):1091–1099. doi:10.1097/iae.0000000000002090
38. Liu Y, Wang L, Xu Y, Pang Z, Mu G. The influence of the choroid on the onset and development of myopia: from perspectives of choroidal thickness and blood flow. Acta Ophthalmol. 2021;99(7):730–738. doi:10.1111/aos.14773
 © 2025 The Author(s). This work is published and licensed by Dove Medical Press Limited. The
full terms of this license are available at https://www.dovepress.com/terms.php
and incorporate the Creative Commons Attribution
- Non Commercial (unported, 4.0) License.
By accessing the work you hereby accept the Terms. Non-commercial uses of the work are permitted
without any further permission from Dove Medical Press Limited, provided the work is properly
attributed. For permission for commercial use of this work, please see paragraphs 4.2 and 5 of our Terms.
© 2025 The Author(s). This work is published and licensed by Dove Medical Press Limited. The
full terms of this license are available at https://www.dovepress.com/terms.php
and incorporate the Creative Commons Attribution
- Non Commercial (unported, 4.0) License.
By accessing the work you hereby accept the Terms. Non-commercial uses of the work are permitted
without any further permission from Dove Medical Press Limited, provided the work is properly
attributed. For permission for commercial use of this work, please see paragraphs 4.2 and 5 of our Terms.