")
Back to Journals » Journal of Inflammation Research » Volume 18
Tigulixostat Alleviates Hyperuricemic Nephropathy by Promoting M2 Macrophage Polarization
Authors Xue L, Tao Q, Chang H, Yan S, Wang L, Zhao Z, Tu C
Received 25 October 2024
Accepted for publication 15 December 2024
Published 3 January 2025 Volume 2025:18 Pages 17—30
DOI https://doi.org/10.2147/JIR.S500101
Checked for plagiarism Yes
Review by Single anonymous peer review
Peer reviewer comments 2
Editor who approved publication: Dr Adam Bachstetter
Lina Xue,1,2,* Qianru Tao,1,2,* Haining Chang,1,* Shu Yan,1 Lei Wang,3 Zefang Zhao,4 Chao Tu1
1Department of Internal Medicine, The Third Affiliated Hospital of Soochow University, Changzhou, Jiangsu, People’s Republic of China; 2Department of Nephrology, The Third Affiliated Hospital of Soochow University, Changzhou, Jiangsu, People’s Republic of China; 3Nanjing jinyu medical examination laboratory, Nanjing, Jiangsu, People’s Republic of China; 4Hongyi Honor College, Wuhan University, Wuhan, Hubei, People’s Republic of China
*These authors contributed equally to this work
Correspondence: Chao Tu, Department of Internal Medicine, The Third Affiliated Hospital of Soochow University, 185 Juqian Road, Changzhou, Jiangsu, 213000, People’s Republic of China, Tel +86 15895073069, Email [email protected]
Purpose: Serum uric acid (SUA) is primarily produced through the hydrolysis of purines in the liver, with its excretion largely handled by the kidneys. Urate transporter 1 (URAT1) inhibitors are known to enhance uric acid elimination via the kidneys, but they also increase the risk of kidney stone formation. Currently, xanthine oxidase (XO) inhibitors are the predominant uric-lowering medications on the market.
Methods: In this study, we utilized single-cell RNA sequencing, spatial metabolomics, plasma metabolomics, flow cytometry to explore the effects of Tigulixostat on uric acid level and hyperuricemic nephropathy (HN) in Uox-KO mouse model.
Results: In this study, we discovered that Tigulixostat (LC350189) more effectively reduced SUA levels and resulted in better renal outcomes compared to allopurinol, without inducing liver injury in urate oxidase knockout (Uox-KO) mice. Mechanistically, we found that Tigulixostat improved HN by promoting M2 macrophage polarization.
Conclusion: These findings suggest Tigulixostat as a promising therapeutic option for managing hyperuricemia and related kidney conditions.
Keywords: hyperuricemic nephropathy, Uox-KO, tigulixostat, Single-cell RNA sequencing, macrophage
Graphical Abstract:

Introduction
Urate is the final metabolite in purine metabolism, with xanthine oxidase (XO) playing a crucial role in the production of uric acid by converting hypoxanthine to xanthine and subsequently to uric acid.1,2 Elevated serum uric acid (SUA) levels can result from various factors, including excessive consumption of seafood, red meat, organ meats, alcohol, or fructose-rich beverages, all of which accelerate nucleotide breakdown and urate production.3,4 Hyperuricemia (HUA) is a significant risk factor for gout, as it leads to the deposition of monosodium urate in the joints.5,6 HUA is also closely associated with chronic kidney disease (CKD)7 and has been linked to an increased risk of mortality from diabetes and cardiovascular disease (CVD).8
Numerous studies suggest that lifelong urate-lowering therapy (ULT) is essential for managing gout and refractory HUA. Allopurinol and febuxostat, both XO inhibitors, are currently the first-line agents in ULT.9 Allopurinol is a hypoxanthine analogue that binds to and inhibits xanthine oxidase.10 Febuxostat, which is metabolized by the liver, is less likely to impair kidney function; however, it has been associated with acute liver injury and an increased risk of death from CVD.11,12 Additionally, lower solubility of febuxostat in water compared to allopurinol,13 makes the later the preferred reference drug in mouse model experiments. Although a study indicated that low-dose benzbromarone has advantages over low-dose febuxostat in ULT,14 benzbromarone has been removed from the FDA’s shelves due to its side effects. The risk of renal stones remains a significant challenge with URAT1 inhibitors.15 Tigulixostat, a novel XO inhibitor, has shown promise, with a 2015 double-blind clinical trial demonstrating that a 200 mg dose of Tigulixostat can reduce SUA levels as effectively as 80 mg of febuxostat.16 Another clinical trial further confirmed the efficacy and safety of utilizing Tigulixostat in ULT.17 HN is a chronic kidney disease characterized by dysfunction of uric acid metabolism, which may progress to renal tubulointerstitial fibrosis and glomerular sclerosis if not effectively alleviated.18 Despite prior research on blocking the TGF-β pathway to mitigate kidney damage, elevated uric acid levels remain unabated.19 Macrophages (Macro) polarization has been found to influence gout and chronic kidney disease by regulating inflammation,20,21 leading us to wonder whether M1 to M2 polarization could alleviate HN. In our study using a Uox-KO mouse model, Tigulixostat not only demonstrated excellent SUA reduction but also showed a notable therapeutic effect on HN.
Materials and Methods
Animals
Male Uox-KO mice (Strain NO. T011801) and male wild-type (WT) C57BL/6J mice were obtained from GemPharmatech (Nanjing, China). To create the Uox-KO model, exons 2–4 of the mouse Uox gene were knocked out in the C57BL/6J background. This model is highly suitable for screening and evaluating hyperuricemia (HUA) treatments due to its propensity for uric acid accumulation.22 Mice were housed two per cage, maintained on a 12-hour light-dark cycle, and given unrestricted access to standard chow and water. Blood biochemical markers, including serum uric acid (SUA) and creatinine, were measured starting from the fifth week to confirm the model’s construction. The WT mice served as the control group (WT group). The Uox-KO mice without any specific treatment were designated as the disease control group (Uox-KO group). Uox-KO mice receiving 10 mg/kg allopurinol daily by oral gavage were categorized as the drug treatment control group (All group).23 Drawing from prior research on dose and the conversion of the surface area of the human and mouse bodies,17 another set of Uox-KO mice were treated with 20 mg/kg Tigulixostat daily by oral gavage during the same period, forming another drug treatment control group (Tig group). All mice were euthanized at 11 weeks of age using carbon dioxide. These experiments were conducted with the approval of the Institutional Animal Care and Use Committee of GemPharmatech (Nanjing, China).
Immunohistochemistry
Kidney tissues from mice across four groups were prepared for histopathological analysis. The tissues were first placed in embedding cassettes and fixed through immersion in 10% neutral-buffered formalin. Following standard processing, the tissues were embedded in paraffin for further histological examination. Sections of approximately 4-μm thickness were sliced and subjected to staining with hematoxylin and eosin (H&E), Masson’s trichrome, and periodic acid Schiff (PAS) to highlight pathological alterations in the kidney. These tissue sections were then assessed using an Olympus optical pathology scanning system.
Transmission Electron Microscope
Initially, either cell pellets or tissue samples were fixed using a 2.5% solution of glutaraldehyde (provided by Wuhan Servicebio Biological Technology Co., China) at 4°C for 2 to 4 hours. After fixation, the samples were encapsulated in 1% agarose gel, followed by a post-fixation in 1% osmium tetroxide (OsO4). The samples were then dehydrated using a series of ethanol concentrations and subsequently embedded in 812 resin (SPI Supplies, USA). Thin sections ranging from 60 to 80 nm were cut and stained with 2% uranyl acetate. The prepared samples were examined and imaged using a transmission electron microscope (TEM) from Hitachi, Japan.
Multicytokine Assay
Plasma was homogenized, and the supernatant from each group was gathered for a multicytokine analysis. The cytokine concentrations were determined using a Luminex 200 system (Luminex), employing a set of 31 mouse cytokines (LX-MultiDTM-31), following the manufacturer’s guidelines.24
Single-Cell RNA Sequencing
Single-cell 3’ gene expression profiles were obtained using a Chromium Next GEM Single Cell 3ʹ Kit v3.1 (10x Genomics, 1000268) and a Chromium Next GEM Chip G Single Cell Kit (10x Genomics, 1000120). Cell suspensions were introduced into the single-cell controller to form single-cell gel beads. Following cell capture, lysis occurred to release RNA, which was then barcoded during reverse transcription. Subsequently, the resulting libraries were sequenced on a NovaSeq6000 system (Illumina, San Diego, CA, USA).25 The quality data of scRNA-seq was showed in Table S1.
scRNA-Seq Clustering and Annotation of Cell Types
The raw reads were mapped to the mouse reference genome (refdata-gex-mm10-2020-A) using CellRanger count (v7.0.0) with default parameters, the digital expression matrix was extracted from the “filtered_feature_bc_matrix” folder outputted by the CellRanger count pipeline. The R package Seurat (v4.1.1) was performed to identify different clusters and signature genes. In brief, after removing genes expressed in fewer than 3 cells, cells with unique feature counts ranging from 300 to 97.5% percentile and less than 25% mitochondrial expression were selected for further analysis. We normalized raw data using NormalizeData function and extracted highly variable genes using FindVariableFeatures function, then data integration was performed by canonical correlation analysis using SelectIntegrationFeatures, FindIntegrationAnchors and IntegrateData functions. The normalized data underwent linear transformation and principal component analysis based on highly variable genes using functions ScaleData and RunPCA. The cell count before and after filtering of scRNA-seq in each group was showed in Figure S1.
scRNA-Seq Clustering and Annotation of Cell Types
For principal component analysis (PCA), the 3000 genes with the highest variability were selected. Cluster analysis was then conducted on the 30 most significant principal components using the FindNeighbors and FindClusters functions, with the parameter set to “resolution=0.3”. Clusters were visualized using both Uniform Manifold Approximation and Projection (UMAP) and t-Distributed Stochastic Neighbor Embedding (t-SNE) by RunTSNE and RunUMAP functions separately. Marker genes for each cluster, cell type and subgroup were identified by the Seurat FindMarkers function that used the Wilcoxon rank-sum test to contrast gene expression of cells from certain cluster, cell type or subgroup to that of others. Cell types were then annotated by their specific patterns of gene expression, and cell clusters were annotated using published information on marker genes.
LC-MS/MS Analysis
The analyses were conducted using a UHPLC system (1290 Infinity LC, Agilent Technologies) connected to a QTRAP MS (6500+, Sciex). Analytes were separated on both HILIC and C18 columns (Waters UPLC BEH Amide and BEH C18, respectively, both 2.1 mm × 100 mm, 1.7µm). For the HILIC separation, the column was maintained at 35°C with an injection volume of 2µL. The mobile phases consisted of Mobile phase A: 90% H2O with 2 mm ammonium formate and 10% acetonitrile, and Mobile phase B: 0.4% formic acid in acetonitrile. A gradient program was set (85% B at 0–1 min, 80% B at 3–4 min, 70% B at 6 min, 50% B at 10–15.5 min, back to 85% B at 15.6–23 min) with a flow rate of 300 μL/min. For RPLC separation, the column temperature was 40°C and the injection volume was 2 μL, using Mobile phase A: 5 mm ammonium acetate in water and Mobile phase B: 99.5% acetonitrile. The gradient (5% B at 0 min, 60% B at 5 min, 100% B at 11–13 min, and 5% B at 13.1–16 min) was implemented at a flow rate of 400 μL/min. Throughout the analysis, samples were kept at 4°C. The 6500+ QTRAP was operated in both positive and negative switch modes. The ESI source conditions in positive mode included: Source temperature at 580°C, Ion Source Gas1 (GS1) at 45, Ion Source Gas2 (GS2) at 60, Curtain Gas (CUR) at 35, and IonSpray Voltage (IS) at +4500 V. In negative mode, the conditions were similar with an IonSpray Voltage (IS) of −4500 V. The MRM method was applied for quantitative data acquisition in mass spectrometry, with MRM ion pairs detailed in the attached file. Pooled quality control (QC) samples were included in the sequence to assess the stability and reproducibility of the system.
Mass Spectrometry Imaging
Metabolites in the samples were visualized using a timsTOF fleX MALDI 2 (Bruker) equipped with a 10 kHz smartbeam 3D laser. The MALDI2 mass spectrometry imaging (MSI) was conducted in positive-ion mode with a full-scan range of m/z 50–1500. The analysis featured a spatial resolution of 50 µm. The laser operated at a frequency of 10,000 hz, utilizing 62% of its energy capacity, and delivered 100 laser shots per 50-µm pixel.
Polychromatic Flow Cytometry
After the cell surface was stained, 1 mL of stain buffer was added to rinse the cells once. Next, 250 µL of Fixation/Permeabilization solution was added, and the cells were incubated at 4°C for 25 minutes. The volume was then brought up to 1 mL with stain buffer working solution, followed by centrifugation and discarding of the supernatant. The cells were washed twice with 1 mL of 1×Perm/Wash Buffer each time, and subsequently resuspended in 200 µL for intracellular staining. The cells were incubated at 4°C for 30 minutes. Afterwards, 1 mL of stain buffer was added to wash the cells, followed by a 5-minute centrifugation. The cells were then resuspended in 400 µL and analyzed by flow cytometry within 3 hours.
Statistical Analysis
Label-free quantification (LFQ) intensities underwent preprocessing before being analyzed. Proteins not detected in any of the samples were excluded. Missing data within the LFQ intensity dataset were imputed. The ggplot2 package (version 3.3.5) in R facilitated both PCA and the creation of volcano plots, whereas the pheatmap package (version 1.0.12) was utilized to examine correlations among samples and to generate heatmaps. Proteins were classified as differentially expressed based on criteria of Log2FC ≥0.5, Log2FC ≤-0.5, and a p-value (Wilcoxon rank-sum test) of 0.05. Gene Ontology (GO) and pathway analyses were conducted using the R package clusterProfiler (version 4.44). Protein-protein interactions were explored using the STRING database and visualized using graph (version 2.0.5), and protein domains were predicted and depicted using ggplot2 (version 3.3.5).
Results
Tigulixostat Effectively Reduced Serum Uric Acid and Relieved HN
Tigulixostat effectively reduced serum uric acid levels and alleviated HN. Initially, we successfully employed CRISPR/Cas9 technology alongside existing research to develop a Uox-KO mouse model by deleting exons 2 to 4 of the Uox gene.22 The mice were divided into four groups: Control, Uox-KO, Uox-KO+Allopurinol, and Uox-KO+Tigulixostat. We assessed the impact of Tigulixostat in urate-lowering therapy (ULT) and HN using various methods including blood and urine tests, immunohistochemistry, electron microscopy, multicytokine assays, single-cell RNA sequencing, plasma metabolomics (PM), and spatial dynamic metabolomics (SDM) (Figure 1A and B). The molecular structures of Allopurinol and Tigulixostat are shown in Figure 1C and D, respectively. Liver and kidney samples collected from the four groups at 11 weeks of age were analyzed for subsequent studies (Figure 1E). The kidney of the Uox-KO group became significantly whiter because of uric acid deposition. Notably, the kidney color in the Tigulixostat group was closer to that of the Control group, suggesting better kidney function compared to the Allopurinol group. Both the allopurinol and tigulixostat groups showed a reduction in SUA by the second week of treatment (Figure 1F and Table S2), with a statistically significant difference observed by the fourth week, highlighting specific uric acid-lowering effects of Tigulixostat. A significant increase in serum creatinine (CREA) levels was observed in the Uox-KO group, while the Tigulixostat group maintained stable levels (Figure 1G). In separate blood urea nitrogen (BUN) tests, which reflect kidney function, there was a notable improvement in the Tigulixostat group, outperforming the Allopurinol group (Figure 1H). There were no significant changes in serum alanine transaminase (ALT) and fasting blood glucose levels in the Tigulixostat group, indicating a low risk of liver damage and blood glucose elevation (Figure 1I and Figure S2A). At nine weeks, the Tigulixostat group had lower urine microalbumin (mALB) levels, an early indicator of kidney injury (Figure 1J). The urine uric acid levels were significantly reduced in both drug groups compared to the Uox-KO group, suggesting that uric acid excretion was not the primary ULT mechanism (Figure 1K). Furthermore, the Tigulixostat group showed a decreased urine albumin-creatinine ratio relative to the Allopurinol group (Figure 1L and Figure S2B), indicating potentially better efficacy in managing HN.
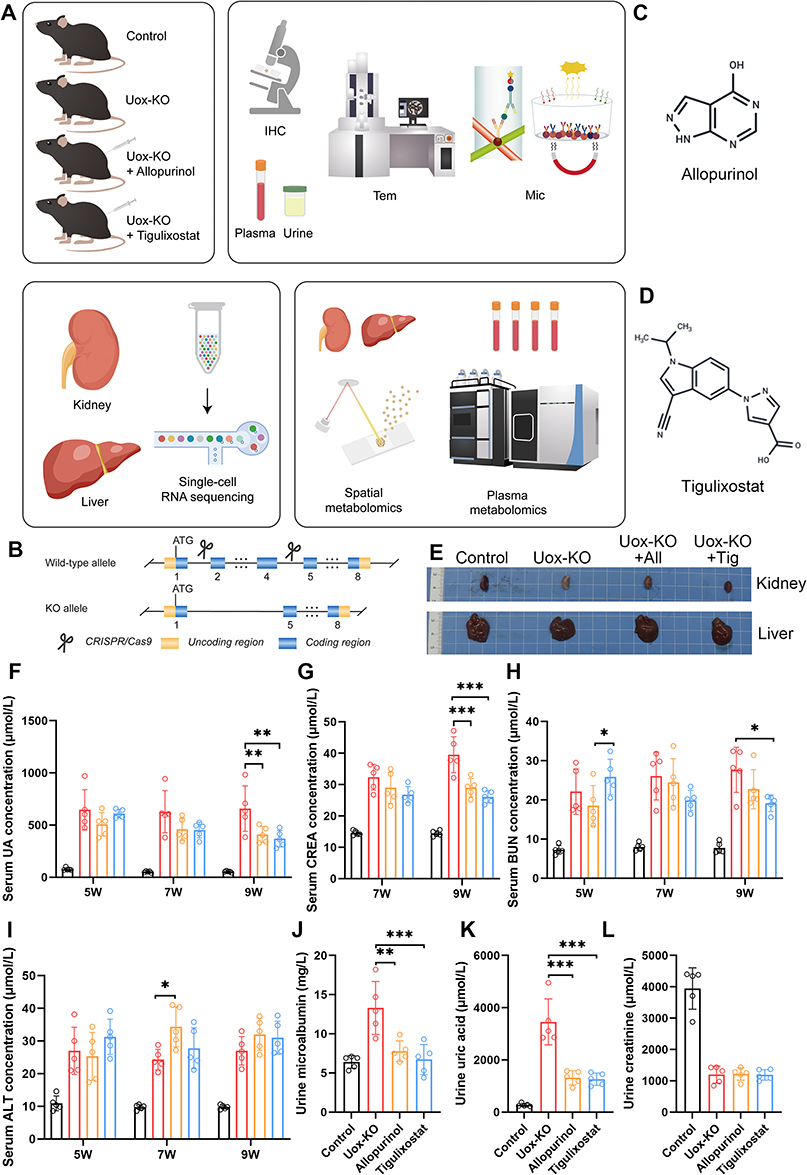 |
Figure 1 Tigulixostat effectively reduced serum uric acid and relieved hyperuricemic nephropathy in Uox-KO mouse model. (A) Overview of the research design. (B) Implementation of CRISPR/Cas9 technology in the Uox-KO mouse model. (C) Chemical structure of Allopurinol. (D) Chemical structure of Tigulixostat. (E) Images of liver and kidney samples from four experimental groups: Control, Uox-KO, Uox-KO + Allopurinol, and Uox-KO + Tigulixostat. (F) Serum Uric Acid (SUA) levels measured in the four groups at ages 5, 7, and 9 weeks. (G) Serum creatinine (CREA) levels in the four groups at ages 7 and 9 weeks. (H) Blood Urea Nitrogen (BUN) levels in the four groups at ages 5, 7, and 9 weeks. (I) Serum Alanine Transaminase (ALT) levels in the four groups at ages 5, 7, and 9 weeks. (J) Urine microalbumin (mALB) levels in the four groups at the age of 9 weeks. (K) Urine uric acid levels in the four groups at the age of 9 weeks. (L) Urine creatinine levels in the four groups at the age of 9 weeks. n=5 in each group. Values are mean ± SEM. *P < 0.05, **P < 0.01, ***P < 0.001. |
Immunohistochemistry provided a more direct observation of Tigulixostat’s effects on HN. H&E staining Epithelial cells of the renal tubules shed and flow into the lumen in Uox-KO group (Figure 2A). In Masson staining we could found renal interstitial edema was accompanied by inflammatory cell infiltration (Figure 2B). PAS staining indicated renal tubules atrophied and the glomerular capsule wall thickened (Figure 2C). These pathological changes were alleviated in the Tigulixostat group. TEM revealed that in the Uox-KO group, glomerular capillary loops were poorly formed, and there was visible vacuolar degeneration of glomerular visceral epithelial cells, diffuse fusion of podocyte foot processes, and proliferation of mesangial cells. These pathological changes were substantially alleviated in the Tigulixostat group (Figure 2D). Plasma multicytokine assays showed that pro-inflammatory factors were significantly elevated in the Uox-KO group compared to the Control group, whereas the Tigulixostat group exhibited a significant reduction (Figure 2E). Furthermore, the regulatory and inhibitory inflammatory factors such as interleukin-10 (IL-10) were increased in the Tigulixostat group (Figure 2F and G), indicating an inhibitory effect on the inflammatory response by Tigulixostat.
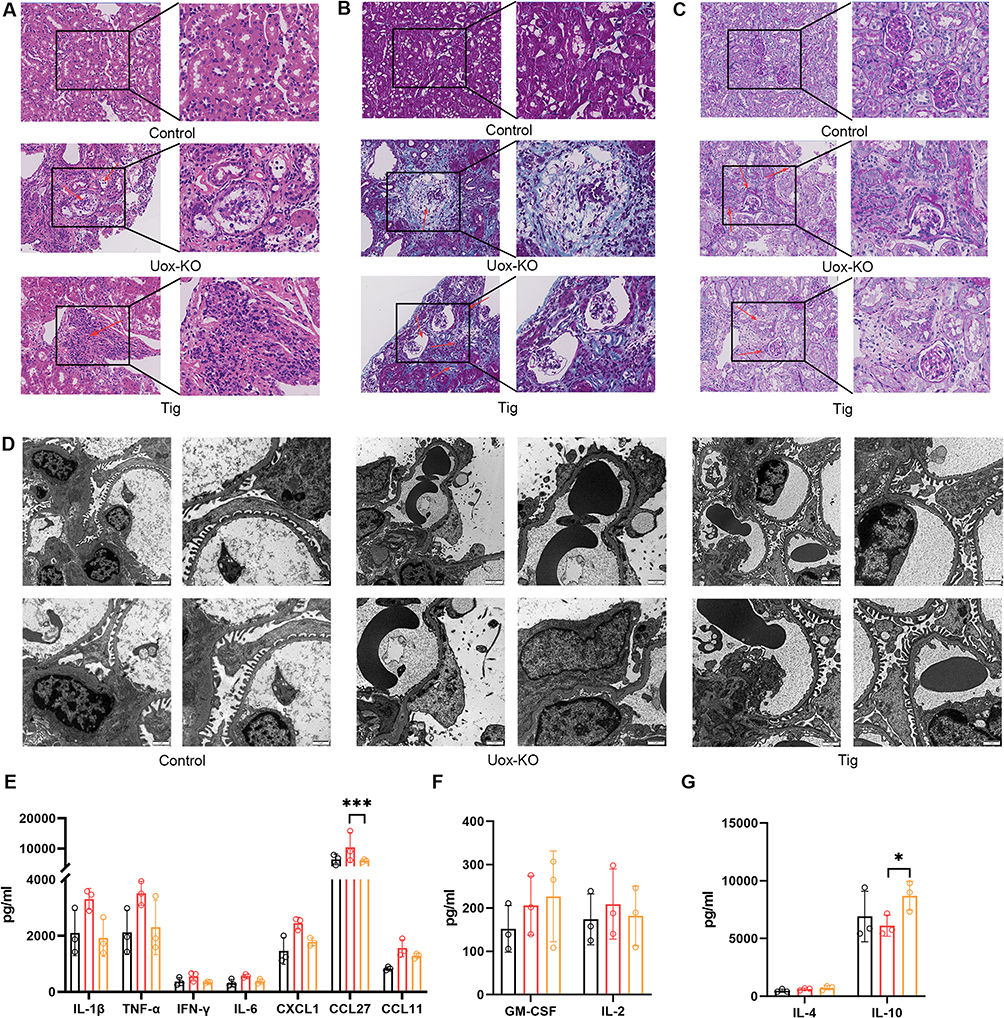 |
Figure 2 Renal pathology and multicytokine changes in Uox-KO mouse model of hyperuricemia induced by Tigulixostat. (A) Hematoxylin and eosin (H&E) stained sections from the Control group, Uox-KO group, and Uox-KO + Tigulixostat group, red arrows showed epithelial cells of the renal tubules shed and flow into the lumen. (B) Masson’s trichrome stained sections from the same three groups, red arrows revealed renal interstitial edema was accompanied by inflammatory cell infiltration. (C) Periodic acid-Schiff (PAS) stained sections from these groups, red arrows indicated renal tubules atrophied and the glomerular capsule wall thickened. (D) Transmission electron microscopy (TEM) images from the three groups. (E) Levels of cytokines that promote inflammation across the three groups. (F) Levels of cytokines that regulate inflammation in the three groups. (G) Levels of cytokines that inhibit inflammation in each of the three groups. n=3 in each group. Values are mean ± SEM. *P < 0.05, **P < 0.01, ***P < 0.001. |
Tigulixostat Promoted Macro M2 Polarization in Uox-KO Mouse
To investigate the effects of Tigulixostat on kidney and liver function in HN, we performed single-cell RNA sequencing (scRNA-seq) on samples from the Control group, Uox-KO group, and Tigulixostat group. After completing data quality control (Figure S3AS3C), we identified 19 distinct clusters within the kidney samples across the three groups (Figure S3D and S2E). These kidney tissues were subsequently categorized into 13 cell types based on marker gene expression (Figure 3A and Figure S3F). We analyzed the proportions of immune and non-immune cells (Figure 3B and C), finding that Macro were prevalent in all three groups, while T lymphocytes (T lymph) were reduced in the Tigulixostat group compared to the Uox-KO group. Among non-immune cells, endothelial cells (Endo) and mesangial cells (Mes) were most prevalent, showing significant changes in the Tigulixostat group, suggesting their potential role in disease remission. A Pearson correlation plot indicated a close relationship between Macro and stromal cells (Strom) (Figure 3D). We documented the genes that increased or decreased in the Tigulixostat group compared to the Uox-KO group for each cell type (Figure 3E and F), and created volcano plots for the top 10 (Figure 3G and H). We found that inflammatory-related genes such as C-X-C motif chemokine ligand 10 (Cxcl10) in T lymphocytes, interleukin 1 beta (Il-1β) in dendritic cells (DC) and Macro, and C-X-C motif chemokine ligand 2 (Cxcl2) in neutrophils showed significant decline. Pathway analysis was performed for elevated and decreased genes (Figure 3I–L). Interestingly, downregulated genes in both immune and non-immune cells were enriched in pathways associated with ribosomes, highlighting the ribosome as a key organelle in disease remission. Additionally, the cytokine-cytokine receptor interaction pathway and the chemokine signaling pathway were highlighted in the bubble diagram for immune cells, indicating the role of inflammatory factors in regulating disease progression.
 |
Figure 3 Single-cell RNA sequencing analysis in kidney of Uox-KO mouse model treated by Tigulixostat. (A) Unsupervised clustering identified 13 distinct cell types visualized in a UMAP from the Control group, Uox-KO group, and Uox-KO + Tigulixostat group. (B) The proportion of immune cell types across the three groups. (C) The proportion of non-immune cell types across the three groups. (D) Pearson correlation plot of 13 cell types in scRNA-seq. (E) Trends in gene expression, showing increases and decreases within each immune cell type. (F) Trends in gene expression, showing increases and decreases within each non-immune cell type. (G) Volcano map in the TOP 10 increasing and decreasing genes in each immune cell. (H) Volcano map in the TOP 10 increasing and decreasing genes in each non-immune cell. (I) Bubble map illustrating pathways associated with downregulated genes in immune cells. (J) Bubble map illustrating pathways associated with upregulated genes in immune cells. (K) Bubble map depicting pathways associated with downregulated genes in non-immune cells. (L) Bubble map depicting pathways associated with upregulated genes in non-immune cells. |
Following this, we categorized Macro into five subclusters (Figure 4A) and identified specific markers for each using UMAP (Figure 4B). The bar chart of proportions (Figure 4C) revealed that subcluster 0 was predominant across all three groups, with its highest representation in the Uox-KO group. Although its proportion decreased in the Tigulixostat group, it remained significantly higher than in the Control group. A Pearson correlation plot (Figure 4D) indicated close relationships between subclusters 2 and 4, and between subclusters 1 and 3. We then visualized the Macro data for the three groups in a pseudo-time analysis (Figure 4E), showing that the Control group’s expression primarily clustered to the right of node 2, while the Uox-KO group’s expression was mostly to the left of node 1. Notably, subclusters 0 and 1 were more prevalent to the right of node 2, suggesting proximity to the state of the Control group. In contrast, subclusters 2 and 4 were more common to the left of node 1, closer to the disease group. In contrast, subclusters 2 and 4 were more common to the left of node 1, closer to the disease group (Figure 4F–G). This analysis will serve as a basis for detailed future examination of each subcluster. We also explored the M1 and M2 polarization trends in Macro using flow cytometry (Figure 4H and I). The CD86 antigen (Cd86) was identified as a marker of M1 polarization, appearing in the Q3 quadrant, whereas the CD206 antigen (Cd206) marked M2 polarization, located in the Q1 quadrant. The Tigulixostat group demonstrated a shift from M1 to M2 polarization compared to the Uox-KO group, typically indicative of an inhibited inflammatory response. Additionally, when integrating Macro data into the immune26 we observed elevated interleukin-10 (Il-10) expression and a notable absence of pro-inflammatory cytokines (Figure 4J). We also We also created a bubble map highlighting the intercellular molecular interactions, where secreted phosphoprotein 1 (Spp1) and syndecan 4 (Sdc4) were identified as key intercellular genes (Figure 4K). Further, preliminary subcluster analysis of T lymphocytes in kidney showed that the control group, Uox-KO group and Tigulixostat group were all divided into 5 subclusters (Figure S4A and S4C). Obviously, the proportion of subcluster 1 decreased significantly in Uox-KO group, and increased in Tigulixostat group (Figure S4B). Pearson correlation analysis showed that subcluster 0 and 3 were closely related, while subcluster 1 and 4 were connected (Figure S4D). This was also verified in the pseudo-time trajectory analysis (Figure S4E–S4G). It revealed an increase in interleukin-4 (Il-4), another anti-inflammatory marker, in the Tigulixostat group (Figure S4H). Bubble plot illustrated molecular interactions between T lymphocytes and other cell types (Figure S4I).
 |
Figure 4 Tigulixostat promoted macrophage M2 polarization in kidney. (A) Five subclusters of Macro identified in UMAP from the Control group, Uox-KO group, and Uox-KO + Tigulixostat group. (B) Identification of marker genes for each Macro subcluster in UMAP. (C) Distribution of Macro subclusters within the three groups. (D) Pearson correlation plot for the five Macro subclusters. (E) Combined pseudo-time trajectory analysis for the three groups. (F) Combined pseudo-time trajectory analysis for the five Macro subclusters. (G) Pseudo-time trajectory analysis for each individual Macro subcluster. (H) Flow cytometry analysis of renal Macro typing in the Uox-KO group. (I) Flow cytometry analysis of renal Macro typing in the Uox-KO + Tigulixostat group. (J) Immune dictionary analysis comparing the Uox-KO + Tigulixostat group with the Uox-KO group. (K) Bubble plot illustrating molecular interactions between Macro and other cell types. |
We extended our scRNA-seq analysis to include Kupffer cells (Kup) in liver tissues, setting the stage for further investigations into inter-organ crosstalk between the liver and kidney, and the interactions between Macro in both organs. Unsupervised clustering showed 18 different clusters in UMAP (Figure S5A). The histogram showed the cell count for each cluster (Figure S5B). The correlation diagram showed the connection of different clusters (Figure S5C). The violin diagram showed the expression of marker genes for each cell type divided (Figure S5D).
The mouse livers in the three experimental groups were divided into nine different cell types (Figure S6A). We compared the proportion of immune and non-immune cells separately (Figure S6B and S6C). We found that the proportion of Kup cells decreased in the Uox-KO group and increased after Tigulixostat application. The Pearson correlation plot showed that Kup and DC were highly correlated Tigulixostat (Figure S6D). According to the molecular ladder diagram of each cell type, the molecular expression of Kup was generally decreased, while that of newly generated T lymph was generally increased (Figure S6E and S6F). The volcano map gives us a potential target molecule for digging into specific cells (Figure S6G and S6H). From the pathway bubble map, it can be seen that immune cells mainly focus on amino acid metabolism, which provided a basis for us to explore the potential mechanism in the future (Figure S6I–S6L). The immune dictionary found that Il-4 in the liver was lower than before, which may suggest that Tigulixostat has an effect on liver inflammation (Figure S6M).
To investigate the impact of Tigulixostat on mouse metabolism, we conducted an LC-MS/MS PM analysis and mapped metabolite pathways related to energy and purine metabolism, based on their expression levels (Figure 5A and Table S3). The data were presented as z-scores and graphical representation of the pathways. Our findings indicated a significant reduction in glycolysis in the Tigulixostat group, suggesting that altered glycolysis could be a mechanism by which Tigulixostat can effectively contribute to ULT and the mitigation of HN. More specifically, we observed a decreasing trend followed by stabilization in the levels of uric acid, xanthine, and adenine in the Tigulixostat group, which indicated that Tigulixostat had a stable decreasing effect on SUA. Additionally, liver SM provided a more direct insight into potential influence of Tigulixostat on purine metabolism within the liver (Figure 5B).
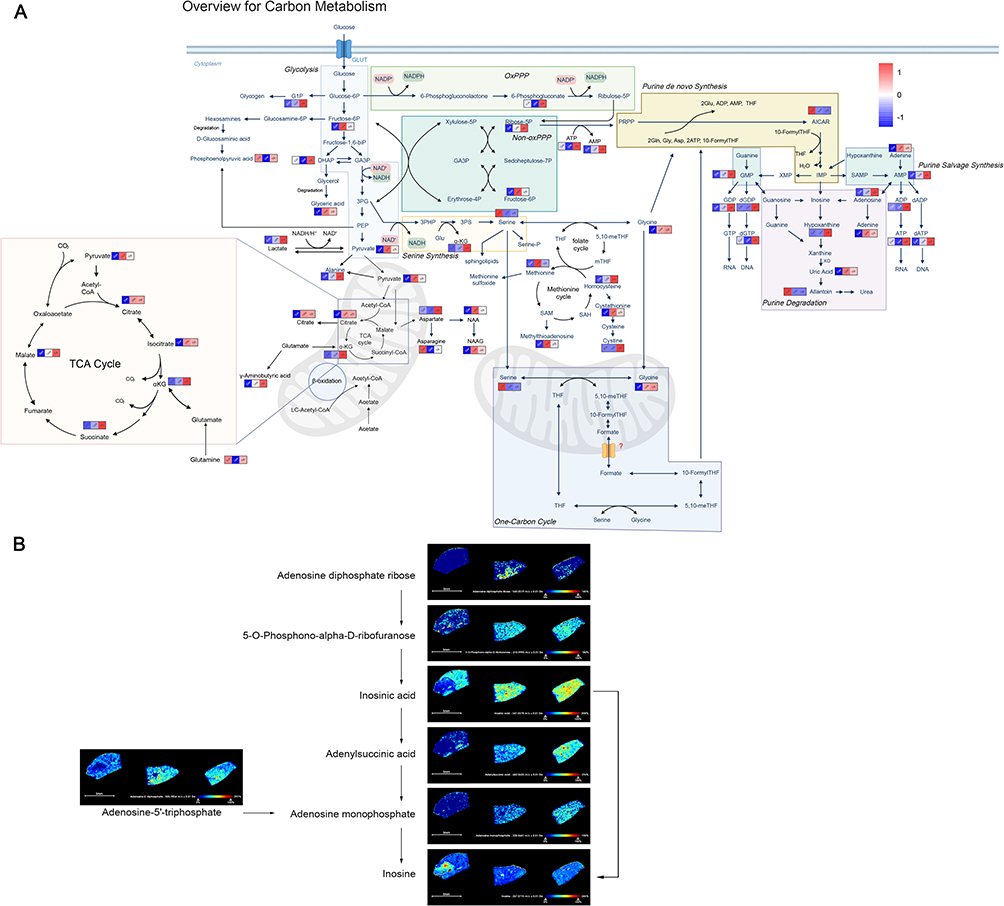 |
Figure 5 Effects of Tigulixostat on plasma metabolomics and liver spatial metabolomics in Uox-KO mouse model. (A) Variations in metabolite levels within the energy and purine metabolism pathways across the Control group, Uox-KO group, and Uox-KO + Tigulixostat group. (B) Spatial metabolomics mapping of the purine metabolism pathway in the liver across the three groups. |
Discussion
Hyperuricemia, a chronic metabolic disorder, negatively impacts various organs, including the brain, cardiovascular system, and lungs.27 Emerging evidence increasingly supports HUA as a danger signal for chronic kidney disease. HUA leads to kidney injury through renal inflammation, endothelial dysfunction, and activation of the renin-angiotensin system.28 XO inhibitors remain the preferred first-line ULT drug in choice. While previous reviews have highlighted the benefits of Tigulixostat over other XO inhibitors, they have primarily focused on its effects on uric acid levels. This study is the first to confirm that Tigulixostat consistently lowers uric acid levels without the common side effects typically observed in the Uox-KO mouse model of hyperuricemia. Through analyses involving blood, urine, immunohistochemistry, and electron microscopy, we observed that Tigulixostat provided superior renal protection and alleviated HN. In terms of mechanism, we found that Tigulixostat can inhibit the inflammatory response by promoting M2 Macro polarization, particularly important given the significant inflammatory responses triggered by high uric acid levels.29,30 Uric acid has been found to induce inflammation by binding to toll-like receptors.31 At the same time, uric acid also activates the NLR family, pyrin domain containing 3(NLRP3), which leads to the division of pro-inflammatory cytokines, especially IL-1β and interleukin-18 (IL-18). These cytokines can recruit additional immune cells, especially neutrophil and Macro, and amplify the pro-inflammatory cascade.32 Additionally, our metabolite pathway mapping indicated that the inhibition of glycolysis process after administering the drug may also be a potential mechanism of action.33 Although previous studies19,34 have focused on reducing fibrosis in HN, they did not demonstrate a direct reduction in uric acid levels. Tigulixostat not only consistently can lower serum uric acid but also ameliorate kidney pathology and reduce urinary microalbumin by inhibiting the inflammatory response, thereby making it an ideal targeted drug worth further promotion.
Due to budget constraints, this study did not perform experiments with multiple drug concentration gradients to further investigate the effects of different dosages on uric acid levels and HN. Additionally, the potential risk of sudden death in mice from oral drug administration limited the duration of the experiment. Due to the limited trial period, several potential side effects of using Tigulixostat such as impacts on heart function have not been thoroughly observed. In order to optimize uric acid metabolism and relieve HN, we will keep investigating the precise mechanism of Tigulixostat and other ULT medications.
Data Sharing Statement
To increase rigor and reproducibility, scRNA-seq data for all samples were deposited in the Gene Expression Omnibus (GSE256431, GSE272217). Original plasma metabolomics data was in supplement material Table S3.
Ethics Statement
Our animal care and use program mainly follows the Guide for the care and use of Laboratory Animals. All animal protocols were approved by the Institutional Animal Care and Use Committee of GemPharmatech (Nanjing, China) in 2024-04-19 with the ethics approval number GJS0420231201133-01.
Author Contributions
All authors made a significant contribution to the work reported, whether that is in the conception, study design, execution, acquisition of data, analysis and interpretation, or in all these areas; took part in drafting, revising or critically reviewing the article; gave final approval of the version to be published; have agreed on the journal to which the article has been submitted; and agree to be accountable for all aspects of the work.
Funding
This research is Supported by the Changzhou Health Commission youth project [grant number QN202206].
Disclosure
The authors report no conflicts of interest in this work.
References
1. Enomoto A, Kimura H, Chairoungdua A, et al. Molecular identification of a renal urate anion exchanger that regulates blood urate levels. Nature. 2002;417(6887):447–452. doi:10.1038/nature742
2. Bortolotti M, Polito L, Battelli MG, Bolognesi A. Xanthine oxidoreductase: one enzyme for multiple physiological tasks. Redox Biol. 2021;41:101882. doi:10.1016/j.redox.2021.101882
3. Wang M, Chen WY, Zhang J, et al. Elevated fructose and uric acid through aldose reductase contribute to experimental and human alcoholic liver disease. Hepatology. 2020;72(5):1617–1637. doi:10.1002/hep.31197
4. Zhang Y, Chen C, Choi H, et al. Purine-rich foods intake and recurrent gout attacks. Ann Rheum Dis. 2012;71(9):1448–1453. doi:10.1136/annrheumdis-2011-201215
5. Dalbeth N, Gosling AL, Gaffo A, Abhishek A. Gout. Lancet. 2021;397(10287):1843–1855. doi:10.1016/s0140-6736(21)00569-9
6. Nakayama A, Nakaoka H, Yamamoto K, et al. GWAS of clinically defined gout and subtypes identifies multiple susceptibility loci that include urate transporter genes. Ann Rheum Dis. 2017;76(5):869–877. doi:10.1136/annrheumdis-2016-209632
7. Tsao HM, Lai TS, Chang YC, et al. Serum urate and risk of chronic kidney disease: a Mendelian randomization study using Taiwan biobank. Mayo Clin Proc Apr. 2023;98(4):513–521. doi:10.1016/j.mayocp.2023.01.004
8. Li B, Chen L, Hu X, et al. Association of serum uric acid with all-cause and cardiovascular mortality in diabetes. Diabetes Care. 2023;46(2):425–433. doi:10.2337/dc22-1339
9. Richette P, Doherty M, Pascual E, et al. 2016 updated EULAR evidence-based recommendations for the management of gout. Ann Rheum Dis. 2017;76(1):29–42. doi:10.1136/annrheumdis-2016-209707
10. Pacher P, Nivorozhkin A, Szabó C. Therapeutic effects of xanthine oxidase inhibitors: renaissance half a century after the discovery of allopurinol. Pharmacol Rev. 2006;58(1):87–114. doi:10.1124/pr.58.1.6
11. Bohm M, Vuppalanchi R, Chalasani N. Febuxostat-induced acute liver injury. Hepatology. 2016;63(3):1047–1049. doi:10.1002/hep.28403
12. White WB, Saag KG, Becker MA, et al. Cardiovascular safety of febuxostat or allopurinol in patients with gout. N Engl J Med. 2018;378(13):1200–1210. doi:10.1056/NEJMoa1710895
13. Sohn JS, Choi JS. Febuxostat solubilization and stabilization approach using solid dispersion method: synergistic effect of dicalcium phosphate dehydrate and chitosan. Int J Biol Macromol. 2023;253(Pt 5):127266. doi:10.1016/j.ijbiomac.2023.127266
14. Yan F, Xue X, Lu J, et al. Superiority of low-dose benzbromarone to low-dose febuxostat in a prospective, randomized comparative effectiveness trial in gout patients with renal uric acid underexcretion. Arthritis Rheumatol. 2022;74(12):2015–2023. doi:10.1002/art.42266
15. Yip K, Braverman G, Yue L, Fields T. Pipeline therapies for gout. Curr Rheumatol Rep. 2024;26(3):69–80. doi:10.1007/s11926-023-01128-3
16. Yoon S, Shin D, Lee H, Jang IJ, Yu KS. Pharmacokinetics, pharmacodynamics, and tolerability of LC350189, a novel xanthine oxidase inhibitor, in healthy subjects. Drug Des Devel Ther. 2015;9:5033–5049. doi:10.2147/dddt.S86884
17. Terkeltaub R, Lee J, Min J, Shin S, Saag KG. Serum urate-lowering efficacy and safety of tigulixostat in gout patients with hyperuricemia: a randomized, double-blind, placebo-controlled, dose-finding trial. Arthritis Rheumatol. 2023;75(7):1275–1284. doi:10.1002/art.42447
18. Hu H, Li W, Hao Y, et al. The SGLT2 inhibitor dapagliflozin ameliorates renal fibrosis in hyperuricemic nephropathy. Cell Rep Med. 2024;5(8):101690. doi:10.1016/j.xcrm.2024.101690
19. Liu N, Wang L, Yang T, et al. EGF receptor inhibition alleviates hyperuricemic nephropathy. J Am Soc Nephrol. 2015;26(11):2716–2729. doi:10.1681/asn.2014080793
20. Tan H, Zhang S, Zhang Z, et al. Neutrophil extracellular traps promote M1 macrophage polarization in gouty inflammation via targeting hexokinase-2. Free Radic Biol Med. 2024;224:540–553. doi:10.1016/j.freeradbiomed.2024.09.009
21. Liu JL, Zhang L, Huang Y, et al. Epsin1-mediated exosomal sorting of Dll4 modulates the tubular-macrophage crosstalk in diabetic nephropathy. Mol Ther. 2023;31(5):1451–1467. doi:10.1016/j.ymthe.2023.03.027
22. Lu J, Hou X, Yuan X, et al. Knockout of the urate oxidase gene provides a stable mouse model of hyperuricemia associated with metabolic disorders. Kidney Int. 2018;93(1):69–80. doi:10.1016/j.kint.2017.04.031
23. Wang R, Halimulati M, Huang X, Ma Y, Li L, Zhang Z. Sulforaphane-driven reprogramming of gut microbiome and metabolome ameliorates the progression of hyperuricemia. J Adv Res. 2023;52:19–28. doi:10.1016/j.jare.2022.11.003
24. Lin W, Chen L, Zhang H, et al. Tumor-intrinsic YTHDF1 drives immune evasion and resistance to immune checkpoint inhibitors via promoting MHC-I degradation. Nat Commun. 2023;14(1):265. doi:10.1038/s41467-022-35710-7
25. Stuart T, Butler A, Hoffman P, et al. Comprehensive integration of single-cell data. Cell. 2019;177(7):1888–1902.e21. doi:10.1016/j.cell.2019.05.031
26. Cui A, Huang T, Li S, et al. Dictionary of immune responses to cytokines at single-cell resolution. Nature. 2024;625:7994):377–384. doi:10.1038/s41586-023-06816-9
27. Huang Z, Xie N, Illes P, et al. From purines to purinergic signalling: molecular functions and human diseases. Signal Transduct Target Ther. 2021;6(1):162. doi:10.1038/s41392-021-00553-z
28. Vargas-Santos AB, Neogi T. Management of gout and hyperuricemia in CKD. Am J Kidney Dis. 2017;70(3):422–439. doi:10.1053/j.ajkd.2017.01.055
29. Du L, Zong Y, Li H, et al. Hyperuricemia and its related diseases: mechanisms and advances in therapy. Signal Transduct Target Ther. 2024;9(1):212. doi:10.1038/s41392-024-01916-y
30. Johnson RJ, Mandell BF, Schlesinger N, et al. Controversies and practical management of patients with gout and chronic kidney disease. Kidney Int. 2024;106(4):573–582. doi:10.1016/j.kint.2024.05.033
31. La Grotta R, de Candia P, Olivieri F, et al. Anti-inflammatory effect of SGLT-2 inhibitors via uric acid and insulin. Cell Mol Life Sci. 2022;79(5):273. doi:10.1007/s00018-022-04289-z
32. Solomon DH, Glynn RJ, MacFadyen JG, et al. Relationship of interleukin-1β blockade with incident gout and serum uric acid levels: exploratory analysis of a randomized controlled trial. Ann Intern Med. 2018;169(8):535–542. doi:10.7326/m18-1167
33. Cui X, Shi E, Li J, et al. GPR87 promotes renal tubulointerstitial fibrosis by accelerating glycolysis and mitochondrial injury. Free Radic Biol Med. 2022;189:58–70. doi:10.1016/j.freeradbiomed.2022.07.004
34. Liu J, Guo F, Chen X, Fu P, Ma L. Integrin αM promotes macrophage alternative M2 polarization in hyperuricemia-related chronic kidney disease. MedComm. 2024;5(7):e580. doi:10.1002/mco2.580
 © 2025 The Author(s). This work is published and licensed by Dove Medical Press Limited. The
full terms of this license are available at https://www.dovepress.com/terms.php
and incorporate the Creative Commons Attribution
- Non Commercial (unported, 3.0) License.
By accessing the work you hereby accept the Terms. Non-commercial uses of the work are permitted
without any further permission from Dove Medical Press Limited, provided the work is properly
attributed. For permission for commercial use of this work, please see paragraphs 4.2 and 5 of our Terms.
© 2025 The Author(s). This work is published and licensed by Dove Medical Press Limited. The
full terms of this license are available at https://www.dovepress.com/terms.php
and incorporate the Creative Commons Attribution
- Non Commercial (unported, 3.0) License.
By accessing the work you hereby accept the Terms. Non-commercial uses of the work are permitted
without any further permission from Dove Medical Press Limited, provided the work is properly
attributed. For permission for commercial use of this work, please see paragraphs 4.2 and 5 of our Terms.