")
Back to Journals » Risk Management and Healthcare Policy » Volume 18
Time Series Analysis of Daily Bed Costs and Consumption Ratio of Inpatients with CHD in a Children’s Hospital in Chengdu
Authors Yang H , Xiang S, Yang Y
Received 11 February 2025
Accepted for publication 26 June 2025
Published 2 July 2025 Volume 2025:18 Pages 2247—2257
DOI https://doi.org/10.2147/RMHP.S522080
Checked for plagiarism Yes
Review by Single anonymous peer review
Peer reviewer comments 2
Editor who approved publication: Dr Jongwha Chang
Honglin Yang, Siyu Xiang, Yuwei Yang
West China Second University Hospital, Sichuan University, Office of Operations Management and Evaluation, Chengdu, Sichuan, 610000, People’s Republic of China
Correspondence: Yuwei Yang, Email [email protected]
Objective: This study aims to examine the evolving trends in daily bed costs and the ratios of consumables costs for inpatients with congenital heart disease (CHD) at a pediatric hospital in Chengdu from 2019 to 2024 and to project these metrics for the year 2025.
Methods: Utilizing SPSS version 23.0, we employed exponential smoothing and ARIMA models to analyze the daily bed cost data of CHD inpatients from 2019 to 2023, constructing predictive models accordingly. The annual data for 2024 were forecasted and subsequently compared with actual values to assess model accuracy. Visualization of Mean Absolute Percentage Error (MAPE) charts was conducted to identify the optimal model, which was then utilized to predict daily bed costs and consumables cost ratios for 2025.
Results: Between 2019 and 2023, both daily bed costs and consumables cost ratios for CHD patients exhibited a consistent annual increase. A decline was noted in 2024, with projections for 2025 suggesting increases to approximately 5,600 CNY and 47%, respectively.
Conclusion: For operational recommendations, it is advised that the hospital prioritizes the management of high-value consumables in CHD care and considers piloting disease-specific cost accounting within cardiovascular departments. From a policy perspective, there is an urgent need to optimize China’s existing medical insurance payment system for pediatric hospitals to address the rising healthcare costs.
Keywords: congenital heart disease, daily bed costs, time series analysis, MAPE
Research Background
Cardiovascular diseases (CVDs) remain a critical public health challenge in China, with epidemiological surveillance data from the 2022 Report on Cardiovascular Health and Diseases in China indicating a persistent upward trajectory in CVD prevalence, currently affecting approximately 330 million individuals. Within this context, congenital heart disease (CHD) emerges as the predominant congenital anomaly among Chinese pediatric populations, consistently ranking as the leading birth defect across multiple provinces. Recent epidemiological studies reveal an annual detection rate increase of 12–15%, driven by advances in prenatal screening technologies and heightened clinical awareness.1,2 The predominant CHD subtypes—atrial septal defect (ASD), ventricular septal defect (VSD), and patent ductus arteriosus (PDA)—collectively constitute 65–72% of cases, with China’s national CHD burden estimated at 2.4 million prevalent cases and 120,000–150,000 new annual births requiring intervention.3 Because the main treatment of CHD is surgery, approximately 38–45% of pediatric CHD patients exhibit reduced exercise tolerance, growth retardation, and heightened susceptibility to perioperative complications.4,5 In addition, there are more difficult and high-risk operations in the field of CHD in children, and more high-value consumables are used, which has brought a great burden to the families and the financing of medical insurance in China.
Chengdu—a regional medical hub in Southwest China—has implemented a hybrid reimbursement model combining basic medical insurance with government subsidies, which has greatly reduced the medical burden of patients. However, hospitals face several systemic pressures. First, the current quota-based DRG system in Chengdu assigns CHD cases a uniform payment rate of CNY 22000–32,000, which cannot cover the whole actual costs. Moreover, the absence of pediatric DRG grouping may lead to distorted evaluation criteria for medical resource consumption in pediatric specialty hospitals. Adult and pediatric CHD cases are pooled, despite pediatric cases requiring longer hospital stays (mean: 8.7 vs 3.8 days) and higher consumable usage. The relatively low cost of adult intervention therapy has also artificially reduced the cost index of CHD’s group, adversely affecting the performance metrics of children hospital in “national examination”.6–8 Therefore, the analysis and forecast of the above indicators has great significance to assist the hospital in operation management, performance policy-making and internal medical behavior monitoring. The time series analysis selected in this study is one of the important statistical methods of Modern Econometrics.9,10 This study employs time series econometric modeling (ARIMA/exponential smoothing) to analyze 2019–2024 data from a Chengdu children’s hospital, forecasting 2025 trends in daily bed costs and consumables proportion. Then comparing and choosing the most suitable method, which can help us to enhance budget precision and optimize hospital operations by identifying cost drivers that can guide procurement strategies.
Data and Methods
Data Source and Preprocessing
The study utilized retrospective data extracted from the Hospital Information System (HIS) of a pediatric cardiology center in Chengdu, focusing on first-page discharge records of congenital heart disease (CHD) patients who underwent interventional procedures in the Department of Cardiology. Cases were classified according to ICD-10 (International Classification of Diseases, 10th Revision) to ensure accuracy in disease categorization and cost attribution. Data inclusion criteria is patients with a primary diagnosis of interventional therapy for CHD (ICD-10: FD39). And patients diagnosed with ASD, PDA, and VSD were grouped separately. The following exclusion criteria were applied: the length of stay is more than 60 days; the lack of information on the first page of the medical record is more than 30%; and the cases lack of main diagnostic description.
The study variables are  and
and  . This study independently grouped and modeled all patients primarily diagnosed with FD39, as well as three major types of congenital heart disease (ASD, PDA, and VSD). Given the relative stability of treatment processes and material choices for these conditions, the study aimed to observe trends in data changes from two perspectives: the entire patient cohort and a representative subset, thereby enhancing the verification of the forecast model’s efficacy.
We use SPSS 23.0 to establish a time series analysis model. We use data from 2019 to 2023 as the modeling group and the data from 2024 as the evaluation group to evaluate the fit and prediction accuracy of the model. To ensure data reliability, a total of 4,307 cases were analyzed, with 125 (2.9%) cases excluded, resulting in 4,182 cases included in the study. Autocorrelation and stability of the data were assessed through residual plots and the Augmented Dickey–Fuller (ADF) test.
Research Methods
Descriptive Statistics
Descriptive statistics were conducted on the data of the aforementioned research subjects from 2019 to 2023, generating frequency distribution tables that included the number of discharges, average costs per case, consumption ratios, and average lengths of stay for each disease group, thereby facilitating preliminary observations of distribution characteristics.
Forecasting Methods
Time series analysis serves as a quantitative forecasting method that employs mathematical techniques to extrapolate the values of a statistical index over time and predict future trends.11 Common time series analysis models include the exponential smoothing (ES) model and the ARIMA model. The ES model optimally utilizes historical data by calculating exponential smoothing values, representing a specialized weighted moving average method suitable for medium- to short-term forecasts.12,13 Conversely, the ARIMA model integrates autoregressive, differencing, and moving average methods for comprehensive data prediction, demonstrating high short-term forecast accuracy but requiring stable data and being sensitive to outliers.14,15 Given that the operational timelines for children are influenced by school age and developmental factors, the relevant data may exhibit seasonality and autocorrelation. Therefore, this study first assessed data stability before employing both the ES method and the ARIMA model for predictions, while also comparing these methods with the Naïve approach commonly used in hospital budgeting (which assumes that the next expected value equals the last observed value) to select the method yielding the best forecasting results.
Model Evaluation Method
For model evaluation, this study selected MAPE, which represents the average absolute percentage error, indicating the average percentage of error between predicted and actual values, and is a widely used evaluation metric in time series analysis. The calculation method is as follows: 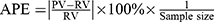 . Generally, a model exhibiting a MAPE between 10% and 20% is considered acceptable, while a MAPE below 10% indicates optimal performance.16,17
Research Results
Distribution of Historical Data
Following the data cleaning, a total of 4,182 patients with FD39 congenital heart disease were admitted to the hospital from 2019 to 2024, including 4,064 patients with the three main types of CHD, accounting for 97.18% of the total, as shown in Table 1. The data distribution indicates that consumables for patients with congenital heart disease constitute the largest proportion of the cost structure, remaining stable at over 45%. The overall average cost per case has shown an upward trend since 2019, with a decline noted in 2024. The average length of stay in 2023 was higher than in 2019, with the exception of VSD cases. However, the proportion of consumables has consistently increased year-on-year, warranting attention.
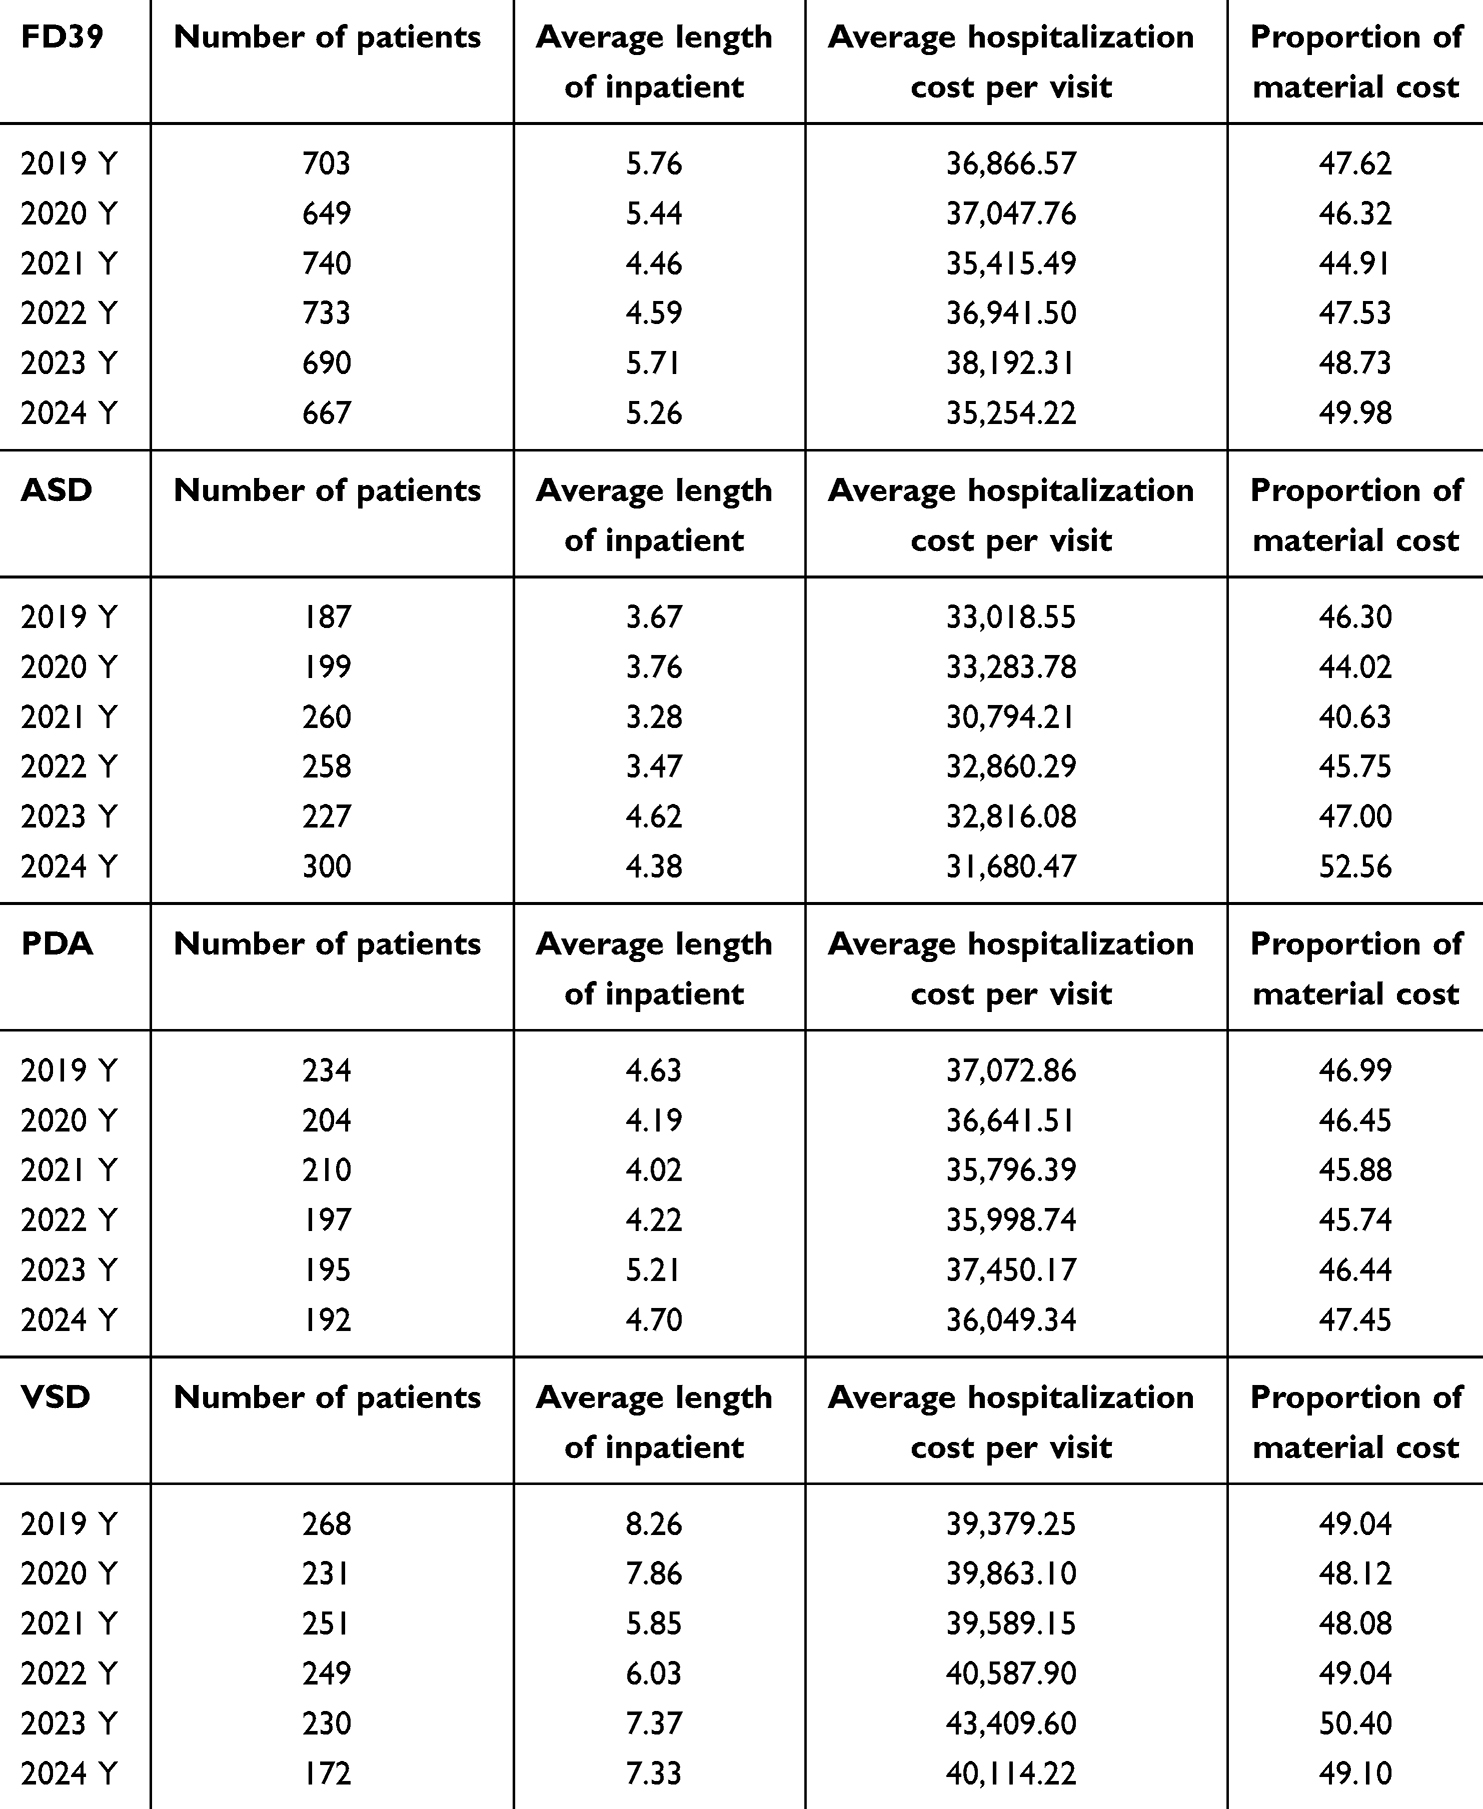 |
Table 1 Basic Information of Hospitalized Patients with Congenital Heart Disease from 2019 to 2024. The Data in the Table are the Average Hospitalization Costs, Consumables, and Average Length of Stay for FD39 Patients and Patients with ASD, PDA, and VSD Congenital Heart Diseases from 2019 to 2024. The Table Shows That in 2024, the Proportion of Consumables Used by Patients in the FD39 Group Who Received Interventional Treatment Reached a New High in Previous years |
Results of Time Series Analysis
Initial autocorrelation analysis and seasonality assessments of the data indicated that all cases of FD39 and the daily bed costs for the three primary diseases passed the Box-Jung test, suggesting they could be regarded as white noise sequences without autocorrelation. ADF test results indicated that the total daily bed cost stabilized after first-order differencing (t = −8.705, p < 0.01); PDA stabilized after first-order differencing (t = −5.879, p < 0.05); while ASD (t = −2.098, p < 0.05) and VSD data were stationary series (t = −4.410, p < 0.05), as shown in Table 2. Consequently, the exponential smoothing (ES) method demonstrated a simple seasonal rule with satisfactory all results (The stable R-squared values are close to 1, and the Ljung–box test P-values are all greater than 0.05) as shown in Table 3. The ARIMA method was subsequently re-evaluated, revealing that, with the exception of all FD39 and VSD, the R-squared values for other diseases were significantly below 1, indicating poor model fitting.
 |
Table 2 ARIMA Model Testing and Fitting Results. The Table Shows the Statistical Test Indicators of the ARIMA Model. Except for the VSD Group, the R-Squared Values of All Other Groups are Too Small Compared to 1, Indicating Poor Model Fit |
 |
Table 3 Results of Model Testing Using ES. The Table Shows the Statistical Test Indicators of the ES Model, and the R-Squared Values of Each Group are Close to 1, Indicating a Good Fit of the Model |
Model Forecast Results
Forecast results of ES method show that in 2024, the daily bed costs of CHD and PDA show an upward trend, while ASD displayed oscillations following an initial rise, and VSD remained relatively stable in the first half of the year, surging since September. The ARIMA model forecast results suggested a more linear trend for overall daily bed costs of CHD, with ASD and PDA costs oscillating within a narrow range, while VSD costs exhibited significant variability and instability. See Figures 1 and 2 for details.
 |
Figure 1 Four sets of ES forecast results. The figure shows the forecast of four different disease data using the exponential smoothing model. |
 |
Figure 2 Four sets of ARIMA model forecast results. The figure shows the ARIMA model’s forecast of data for four different disease types. |
Error Comparison and Real Value Verification
The predicted values from the three models were compared with actual values from 2024 to calculate overall MAPE. Results indicated that the ARIMA model performed better in forecasting overall daily bed costs, while the ES method outperformed the other two models in predicting single disease costs. Overall, the ES model demonstrated good acceptance, as illustrated in Table 4.
 |
Table 4 Comparison of MAPE Values for Three Forecast Methods. The Table Compares the MAPE of Three Models’ Prediction Results. It Is Generally Considered That the Model with Better Prediction Results is One with Less Than 10%, Indicating That the ES Model Performs Better Overall |
Visual comparisons of MAPE for the three models were generated using Tableau, as shown in Figure 3. Figure 3 upper part shows the performance of the three forecast models in four types of disease groups, and the line chart shows the trend of the predicted values of four types of diseases in three different models. It can be seen that the ARIMA model exhibited minimal overall fluctuation, the predictive values for different disease groups varied significantly, with ASD and PDA predictions skewed higher and overall fluctuations being pronounced. The ES model maintained consistent trends across disease groups, albeit with lower predictive values for ASD. The Naïve model demonstrated the poorest forecasting performance, with significant fluctuations in predicted values. Figure 3 lower half represents the forecast errors of different models in each month of 2025. The larger the area of the corresponding color block, the greater the corresponding forecast method error. It can be seen that the ES method is the best among the three forecast methods, and the ARIMA model results in large fluctuations when the forecast time nodes increase. Overall, the ES method is recommended for forecasting bed costs for children with CHD, particularly for single disease predictions.
 |
Figure 3 Visual comparison of three forecast methods MAPE. The upper part of the figure shows the forecast results and MAPE trend charts of different diseases using ARIMA, ES, and Naive forecast methods. The lower part shows the MAPE performance of the three forecast methods mentioned above in different diseases, which determines the degree of deviation between the forecast and actual values based on the size of the area. |
Forecast Results of Annual Indicators in 2025
The ES method was employed to predict daily bed costs and consumption ratios from January to December 2025. The model fitting for both indicator groups was satisfactory (daily bed cost stable R-square = 0.689, BIC = 13.721, MAPE = 9.568%; consumption ratio stable R-square = 0.678, BIC = 1.981, MAPE = 4.314%). According to the forecast results, the total daily bed cost for CHD patients undergoing interventional therapy is anticipated to decrease to approximately 5,600 CNY in 2025, reflecting a 14% year-on-year increase, with the highest monthly cost exceeding 6,100 CNY. The daily bed costs for the three primary congenital heart disease types are also projected to decrease, with VSD costs remaining relatively stable and PDA costs significantly declining compared to the previous year. The share of consumables is expected to rise to over 47%, with ASD experiencing the most pronounced year-on-year increase of approximately 3%, while VSD shows the smallest increase, maintaining a minor fluctuation trend around 48%, as shown in Table 5 and Figure 4.
 |
Table 5 Forecast Daily Cost and Consumption Ratio of CHD Beds from January to December 2025. The Table Shows the Development Trend of Bed Daily Cost and Consumption Proportion of FD39 Group, ASD, PDA, and VSD Patients Predicted by the ES Model in 2025. It Can Be Seen That the Consumption Proportion Has a Continuous Upward Trend |
 |
Figure 4 Forecast sequence chart of CHD daily bed costs and consumables ratio from January to December 2025. The figure shows the trend of the forecast results of the exponential smoothing method for FD39, ASD, PDA, and ASD disease groups in terms of bed daily costs and consumables proportion for the whole year of 2025. |
Conclusion
Applicability of Time Series Forecasting to Hospital Budgeting
The findings of this study suggest that the exponential smoothing (ES) model demonstrates superior comprehensive performance in predicting daily bed cost and consumables proportion for children with CHD. It is recommended that this model replaces the traditional Naïve method in the budget formulation process within the cardiovascular department of the hospital, thereby assisting the financial and operational management departments. However, notable differences exist among the characteristics of ASD, PDA, and VSD. Historical data indicates that medical costs for PDA patients exhibit significant extreme values and fluctuations, which may impose limitations on the forecasting methods employed in this study.
Furthermore, radiofrequency ablation, another significant surgical procedure, also exhibits a high dependency on medical consumables, warranting further investigation. Future research should aim to more precisely subdivide diseases within the department and consider the influence of various factors such as age groups, disease stages, and complications, potentially employing more complex methodologies such as machine learning or combined forecasting techniques to provide more reliable and specific support for clinical department budget formulation.
Emerging Challenges in Disease Cost Management
The National Health Commission mandates that public hospitals nationwide implement comprehensive budget management and strictly regulate high-value consumables.18,19 The demand for consumables in cardiovascular surgery is substantial, with the heart failure device market alone projected to grow from approximately 27.7 billion USD in 2023 to 46.6 billion USD by 2030, alongside an anticipated increase in heart failure patient numbers.20
The historical data and forecast model results for CHD patients in this study indicate that consumables costs represent the most significant component of hospitalization expenses for CHD patients. Although daily bed costs for CHD patients have decreased since 2024, suggesting some success in controlling operational costs, the rising proportion of consumables necessitates careful monitoring. The forecast model predicts further increases in 2025, highlighting the need for vigilance. Interventional surgeries, particularly for children with CHD, require a diverse array of consumables, with substantial price variability among different patients. For instance, the primary occluder has been developed in China over the past 40 years, transitioning from imitation to optimization. The phenomenon of independent innovation is increasingly evident, particularly in the context of high-quality and high-cost consumables, which are expected to undergo more frequent updates and iterations.21,22 Consequently, effective cost control within departments and the management of disease-related budgets, especially in light of the rising utilization of cardiovascular consumables for children and the growing investment in high-value items, should be prioritized in hospital operations.
At the same time, the results of this study suggest that the fluctuation range and structure of the cost of interventional therapy patients are relatively stable, which can be considered as the pilot Department of disease cost measurement, and provide help for further deepening the comprehensive budget management of the hospital.
Optimizing of Medical Insurance Payment Rules
In addition, the existing medical insurance payment regulations warrant optimization. As public health perspectives evolve, there is a growing emphasis on the quality of health that patients seek, which is likely to drive an increased demand for high-quality and high-value consumables.23,24 Given the fluctuations in pricing and other external factors, it is imperative to revise the current quota payment rules. Specifically, it is recommended that the Diagnosis-Related Group (DRG) for interventional therapy related to congenital heart disease (CHD) differentiate between adult and pediatric patients. This distinction could enhance the performance metrics of specialized children’s hospitals in national evaluations.25
The projections derived from this study indicate a year-on-year increase in the proportion of consumables utilized by CHD patients undergoing interventional therapy by 2025. Under the current policy prohibiting markups on medications and consumables, the medical insurance payment standards are insufficient to cover actual medical expenses. Notably, consumables related to the three primary diseases of CHD account for over 46% of total expenditures, with consumables for patients with atrial septal defect (ASD) constituting approximately 54%. This trend suggests an inevitable rise in the proportion of CHD-related consumables within hospitals. Therefore, the medical insurance payment system must accommodate the specific service needs of certain pediatric patients and the inherent growth characteristics of disease-related costs. It is advisable to identify representative surgical disease groups that differentiate between adults and children, utilizing inpatient data from children’s hospitals to establish specialized DRG groups for pediatric disease payment management. This approach aims to reconcile the sustainable development of medical insurance funds with the health requirements of patients.
Ethics
This study does not involve clinical or animal experiments and does not require ethical evaluation. The data used in the research institute comes from the cost data on the patient medical record homepage in our hospital’s HIS system, and there is no content in the manuscript that may involve privacy such as patient name and gender.
Disclosure
The authors report no conflicts of interest in this work.
References
1. National Center for Cardiovascular Diseases. Compilation team of China cardiovascular health and disease report 2022. Interpretation of the key points of China cardiovascular health and disease report 2022. ChinJ Cardiol. 2023;28(04):297–312.
2. Xiuhua Y, Yongling Y, Zhen Z, et al. Epidemiological survey of common congenital heart disease in children in minority areas of Southeast Guizhou and influencing factors of delayed medical treatment. J Pract Med. 2024;40(02):253–260+266.
3. Xuming M. Challenges and thinking of pediatric congenital heart disease surgery in China. J Clin Pediatr Surg. 2016;15(003):209–211.
4. Li J. Epidemic trend and epidemiological analysis of congenital heart disease. J Cardiovas Rehab Med. 2017;26(1):4.
5. Xuan Y, Pin J, Youping T, et al. Discussion on neonatal congenital heart disease screening and achievement transformation. Hospital Manage Forum. 2022;39(10):18–20.
6. Xin X, Xiyue P, Wenlin Y. Taking the performance appraisal of tertiary public hospitals as an opportunity to establish a long-term medical quality and safety management system. Mod Med Health. 2025;41(02):560–563.
7. Wangli DH. Establishment and practice of total quality management system in a hospital in Guangxi. Jiangsu Health Manage. 2024;35(12):1741–1743.
8. Youchang Z. Discussion on calculation and reporting of operational efficiency indicators for performance appraisal of public hospitals. Finance Accounting. 2024;2024(06):73–74.
9. Jiang D, Yang Y, Xiaoying K, et al. Application of time series analysis in hospital management. Preventive Med Forum. 2022;28(02):158–161.
10. Wenjuan C, Jianchao L. Study on the forecast of outpatient volume in a tertiary general hospital based on seasonal ARIMA model. China Hospital Stat. 2024;31(03):185.
11. Jintao Z. Cheng mingyue, Liu zhiting. Multivariate time series forecast model based on decomposition and transpose strategy. J Nanjing Univ. 2025;61(01):58–70.
12. Shengchuan H. Research on time series similarity measurement method based on dynamic time warping [D]. Chongqing Univ Posts Telecommun. 2022;2022:1.
13. Zuhua L, Chunliu P, Junhua W, et al. Change trend and forecast of reported incidence of active pulmonary tuberculosis in Guiyang. Chin J Disease Control. 2025;29(01):42–48.
14. Hongbin Y, FengHao S, Sheng H. Application progress of discontinuous time series analysis in health policy evaluation in China. China Pharmacoeconomics. 2024;19(5):1.
15. Lang WL, Junxiu A. Reversible normalization method for solving the problem of time series distribution migration. Microelectronics Computer. 2025;42(5):18–26.
16. Bo L, Mengjie L, Jian Z. Optimized neural network forecast method based on combined residual correction. Stat Decision Making. 2025;41(4):35–39.
17. Xiang L, Yuanqi J, Qin Z. Forecast of monthly diagnosis and treatment visits in a tertiary hospital based on SVR model. Jiangsu Health Manage. 2025;36(2):244–247.
18. Rui S, Tianshu L. Case analysis of public hospital operation management from the perspective of value chain. China Health Economy. 2023;42(4):75–77.
19. Yaotian L, hong Z, Liai Z, et al. An empirical study on the economic operation monitoring and evaluation index system of public hospitals in Guangzhou. China Health Econ. 2024;43(1):72–76.
20. Frost & Sullivan. Special balloons for vascular interventions industry status and development trends blue book. 2024.
21. Xiaohong Y. Refined management strategy of high-value medical consumables under the reform of DRG payment mode. Financial Circles. 2024;31:81–83.
22. guang L, Cuihai D, Haijun Z. Research progress of interventional surgery delivery system. J Interventional Radiol. 2018;27(7):695–699.
23. Meena S, Alastair G. The Impact of Ageing on Expenditures in the National Health Service. J Health Econom. 2025;15(1):45–60.
24. Sijia Y, Lili M. Ji mengting. Visualization analysis of research hotspots and trends of patients’ needs at home and abroad based on CiteSpace. Health Develop Policy Res. 2024;27(3):238–248.
25. Shengqiang W, yao X, Kuanchen Z, et al. Exploration and practice of refined management of energy consumption in tertiary children’s Hospital under the background of national examination. Jiangsu Health Manage. 2024;35(10):1459–1462.
 © 2025 The Author(s). This work is published and licensed by Dove Medical Press Limited. The
full terms of this license are available at https://www.dovepress.com/terms.php
and incorporate the Creative Commons Attribution
- Non Commercial (unported, 4.0) License.
By accessing the work you hereby accept the Terms. Non-commercial uses of the work are permitted
without any further permission from Dove Medical Press Limited, provided the work is properly
attributed. For permission for commercial use of this work, please see paragraphs 4.2 and 5 of our Terms.
© 2025 The Author(s). This work is published and licensed by Dove Medical Press Limited. The
full terms of this license are available at https://www.dovepress.com/terms.php
and incorporate the Creative Commons Attribution
- Non Commercial (unported, 4.0) License.
By accessing the work you hereby accept the Terms. Non-commercial uses of the work are permitted
without any further permission from Dove Medical Press Limited, provided the work is properly
attributed. For permission for commercial use of this work, please see paragraphs 4.2 and 5 of our Terms.