")
Back to Journals » Journal of Inflammation Research » Volume 17
Transcriptome Profiles Characteristics of the Peripheral Immune in Patients with Severe Fever with Thrombocytopenia Syndrome
Authors Zhang Y , Sun Q, Liu T, Chang C, Chen X, Duan Q, Wen Z, Zhang X, Pang B, Jiang X
Received 1 July 2024
Accepted for publication 15 October 2024
Published 7 November 2024 Volume 2024:17 Pages 8357—8374
DOI https://doi.org/10.2147/JIR.S485118
Checked for plagiarism Yes
Review by Single anonymous peer review
Peer reviewer comments 2
Editor who approved publication: Professor Ning Quan
Yuwei Zhang,1,* Qingshuai Sun,2,* Tao Liu,3,* Caiyun Chang,4,* Xiangjuan Chen,2 Qing Duan,1 Zixuan Wen,5 Xiaomei Zhang,1 Bo Pang,1 Xiaolin Jiang2,5,6
1Infectious Disease Prevention and Control Section, Shandong Center for Disease Control and Prevention, Jinan, Shandong Province, People’s Republic of China; 2School of Public Health and Health Management, Shandong First Medical University & Shandong Academy of Medical Sciences, Jinan, Shandong Province, People’s Republic of China; 3Department of Infectious Disease Control, Yantai Center for Disease Control and Prevention, Yantai, Shandong Province, People’s Republic of China; 4Institute for Infectious Disease Control, Jinan Center for Disease Control and Prevention, Jinan, Shandong Province, People’s Republic of China; 5School of Public Health, Weifang Medical University, Weifang, Shandong Province, People’s Republic of China; 6Shandong Provincial Key Laboratory of Infectious Disease Control and Prevention, Shandong Center for Disease Control and Prevention, Jinan, Shandong Province, People’s Republic of China
*These authors contributed equally to this work
Correspondence: Xiaolin Jiang, Shandong Provincial Key Laboratory of Infectious Disease Control and Prevention, Shandong Center for Disease Control and Prevention, Jinan, Shandong Province, People’s Republic of China, Tel +0531-82679767, Email [email protected]
Purpose: Severe fever with thrombocytopenia syndrome (SFTS) is an acute viral infection disease with a high mortality, but there are no specific effective drugs or vaccines available for use. To develop effective treatment methods, more basic researches are urgently needed to elucidate the response mechanisms of patients.
Patients and Methods: Here, we conducted the transcriptomic analysis of peripheral immunity in 14 SFTS patients, ranging from moderate infection to severe and fatal disease.
Results: The results showed orderly cytokine signaling pathway modulation in moderate patients, cellular immunosuppression in severe patients, and significant dysregulation of the inflammatory response and coagulation dysfunction characteristic of deceased patients. In addition, WGCNA further showed a significant positive correlation between fatal outcomes and B cell and immunoglobulin mediated immune function modules, as well as a significant negative correlation with coagulation function modules.
Conclusion: Overall, our research findings systematically observed potential immune mechanisms underlying clinical symptom heterogeneity and noteworthily revealed multiple signaling pathways leading to coagulation dysfunction in fatal outcomes, not just related to decreased platelet count, which can further elucidate the interaction between viruses and hosts and contribute to clinical treatment.
Keywords: SFTS, heterogeneous, fatal case, RNA-seq, peripheral immunity
Introduction
Severe fever with thrombocytopenia syndrome (SFTS), a new hemorrhagic fever first reported in China in 2009,1 is an acute infectious disease caused by infection with the Dabie bandavirus (formerly known as severe fever with thrombocytopenia syndrome virus [SFTSV]), with a mortality rate that can be as high as 12–50%.2,3 The main transmission vectors of SFTSV are ticks, especially H. longicornis,4 and the blood and secretions of the patients can also cause human-to-human transmission and even trigger cluster outbreaks.5,6 In 2018, the World Health Organization listed SFTS as one of the diseases that pose major public health risks. In recent years, the geographic distribution of SFTS has been expanding, and the incidence of SFTSV has been reported in several Asian countries,7–9 but there is still no approved vaccine or specific antiviral treatment.
The clinical symptoms of SFTS mainly include influenza-like symptoms such as acute fever, weakness, and headache, as well as gastrointestinal symptoms such as anorexia and diarrhea, accompanied by typical symptoms of leukopenia and thrombocytopenia. As the disease progresses, some patients may experience shock, hemorrhage, disseminated intravascular coagulation (DIC), and even multiple organ failure (MOF).10 According to the patient’s symptoms and the severity of organ damage, it can be categorized into mild, moderate, severe, and critical types. Among them, patients with mild and moderate types usually have a platelet drop (higher than 75×109/L) and have a good prognosis. On the other hand, the severe and critical types show progressive platelet decline (less than 50×109/L or 25×109/L), multiple organ damage, and are very likely to have a poor prognosis. However, the underlying mechanisms of the different clinical manifestations and treatment outcomes are largely unknown.
In general, the ability of viruses to survive, replicate, and spread in the host is not only dependent on the adaptive changes caused by virus evolution but also on the response and alteration of the host immune system and other complex internal environments. Therefore, exploring the molecular interactions that occur between SFTSV and the host and tapping into the mechanisms by which SFTSV evades the host immune response may help in the development of vaccines or therapeutics against viral infection. Previous studies have shown that some degree of immune dysfunction, such as monocyte abnormalities,11 cytokine storms,12 cellular immune dysregulation,13 and humoral immune deficiency,14 exists in severe and critical types or deceased patients. These observations have increased our understanding of the pathogenic of SFTS, but the exact mechanisms underlying the differential clinical manifestations remain elusive, and the transcriptional landscapes and gene expression profiles of SFTS patients in different disease states are not yet completely clear.
In recent years, transcriptomics has been widely applied to identify the immune response dynamics and gene regulatory networks mediated by viral infection.15–18 In this study, we recruited SFTS patients and grouped them according to their clinical symptoms and prognostic outcomes, systematically scanned the transcriptomic profiles of the patients, and parsed the underlying mechanisms of clinical heterogeneity, which provided a theoretical basis for clinical treatment and regression warning.
Materials and Methods
Study Population and Sample Isolation
From July to September 2023, we invited patients hospitalized with SFTSV infection confirmed by RT-PCR results and healthy individuals in Jinan and Yantai City of Shandong Province. The inclusion criteria for SFTS patients included two requirements: (1) patients with SFTSV infection confirmed by RT-PCR results; (2) The patient has no other immune related underlying diseases. The inclusion criteria for healthy individuals are gender and age comparable to the patient, had no immune-related underlying disease, and were not receiving immunotherapy. The anticoagulant venous blood samples were collected from healthy individuals and the patients within 7 days of onset, and peripheral blood mononuclear cells (PBMCs) were isolated by density-gradient sedimentation for further study.
Transcriptome Sequencing
The high-throughput transcriptome sequencing of participants was performed according to our previous research methods.19 The RNeasy Mini Kit (Qiagen, Germany) and Stranded Total RNA Prep Ligation with Ribo-Zero Plus Kit (Illumina, USA) were used to extract total RNA from PBMCs and prepare the rRNA-depleted cDNA library. The sequencing was carried out to generate 150 bp paired-end reads on the Illumina NextSeq 2000 platform. The quality control, trimming, and mapping of the RNA-seq raw FASTQ data to the human reference genome hg38 were performed using CLC Genomics Workbench (version 21.0). The gene expression level was measured based on the transcripts per million (TPM).
Differentially Expressed Genes (DEGs) Identification
To identify transcriptional features in peripheral immunity that correlate with clinical features of SFTS patients, we compared DEGs in PBMC between the patient groups and the healthy group. The normalization factors were calculated using edgeR20 and limma21 packages, and the standardization and filtering of gene expression were accomplished by the voom and eBayes functions. The p-value <0.05 and 2^logFC_cutoff criteria were used to filter out DEGs. The fold change and expression profile of DEGs were visualized as volcanoes and heatmaps in R (version 4.1.0). The transcriptional profile of cytokine-related genes were also visualized by heatmap.
Prioritization of DEGs by Protein–Protein Interaction (PPI) Network Analysis
The initial PPI networks for the protein products of up-regulated and down-regulated DEGs were constructed from the STRING database (version 11.5),22 and visualized by Cytoscape software (version 3.9.1).23 The MCODE plugin in Cytoscape software was used to identify the characteristic DEGs from the initial PPI networks.
Functional and Pathway Enrichment Analysis
The prospective gene ontology (GO) terms of DEGs from different groups were identified using clusterProfiler packages (v.4.8.3).24 The Bonferroni-adjusted p-value <0.05 was used as the cut-off criterion.
Weighted Gene Co-Expression Network Analysis (WGCNA)
The weighted gene co-expression network analysis based on transcriptional profiles and sample characteristics was executed through the WGCNA package.25 The specific details were consistent with our previous research. First of all, the best β value was confirmed with a scale-free fit index larger than 0.80 as well as the highest mean connectivity. Subsequently, the topological overlap matrix (TOM) transformed by the adjacency matrix was then clustered by dissimilarity between genes, and then we performed hierarchical clustering to identify modules, each containing at least 30 genes (minModuleSize = 30). Finally, the co-expressed genes were determined by calculating the module membership (MM) and gene significance (GS) of the genes in the target modules. The functional enrichment of remarkable modules was carried out by the ClueGO plugin26 in Cytoscape software (version 3.9.1). The Bonferroni-adjusted p-value <0.05 was also used as the cut-off criterion.
Results
Characteristics of Participants
To better understand the underlying mechanisms of clinical heterogeneity in SFTS patients, we performed transcriptome sequencing and analysis of PBMCs from 14 patients with SFTS confirmed by RT-PCR and 6 age-matched healthy controls. Based on clinical manifestations, all patients were further divided into moderate (n=5), severe (n=6), and fatal (n = 3) groups. The platelet counts of patients in the moderate group were all higher than 75×109/L, while those in the severe group were all lower than 50×109/L. The gender and age characteristics of all participants and study design are shown in Figure 1.
 |
Figure 1 The details of this study design. (A) The subgroups and sample size in our study. (B) Gender and age characteristics of participants. (C) The experimental and analytical process of this study. |
Transcriptional Profile of SFTS Patients
We summarized the DEGs of SFTS patients with different clinical symptoms relative to healthy control. The volcano plot showed that 459 genes were up-regulated (eg, IFI27, IGLL5, BOLA2, TNFRSF17, and MZB1) and 154 genes were down-regulated (eg, ADRA2B, FCER1A, PF4V1, CXCL5, and RASD1) in the moderate patients (Figure 2A). In total, 717 DEGs were identified in the severe group, including 464 up-regulated and 253 down-regulated DEGs (Figure 2B), and 447 up-regulated and 332 down-regulated DEGs were identified in the fatal group compared with the uninfected individuals (Figure 2C). The expression profile of the top 50 up-regulated and down-regulated DEGs of each sample were shown by heatmap (Figure 3A–C).
 |
Figure 2 Volcano plot of global gene expression changes in the moderate (A), severe (B), and fatal (C) groups relative to healthy control. Red: up-regulated DEGs in the patients group compared with the healthy group; Blue: down-regulated DEGs in the patients group compared with the healthy group; Grey: non-DEGs. Criteria: |Fold Change|= 2^logFC_cutoff is marked out by two black dotted lines. P-value = 0.05 is marked out by a horizontal black line y = − Log10(0.05). |
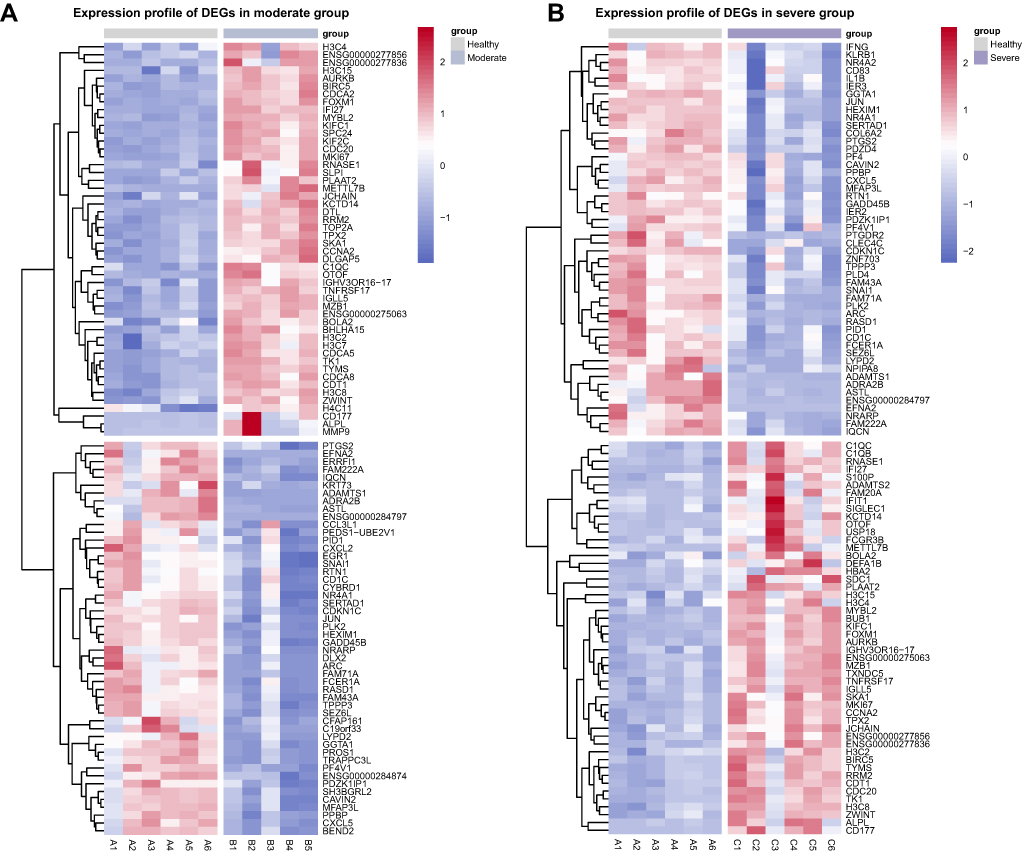 |
Figure 3 Continued. |
 |
Figure 3 Hierarchical cluster analysis of DEGs. The expression profile of the top 50 up-regulated and down-regulated DEGs in moderate (A), severe (B), and fatal (C) groups relative to healthy control. Each row represents mRNA and each column represents a sample. Red indicates higher expression and blue indicates low expression in the SFTS patients group as compared with that in the healthy group. |
Orderly Antiviral Responses in the Moderate Group
To analyze the interaction relationships between up-regulated and down-regulated DEGs identified from the moderate group, the characteristic gene subnetworks contained 95 and 52 DEGs, respectively (Figure 4A and B). In order to clarify the functional pathways of the characteristic DEGs, the top 15 GO-terms enriched by SFTSV were shown in the GO dot plot and bar plot. The up-regulated DEGs performed some virus defense functions, including “cytokine-mediated signaling pathway”, “defense response to virus”, “humoral immune response”, “negative regulation of virtual process”, and “negative regulation of virus genome replication”, which are classic antiviral pathways (Figure 4C). The down-regulated DEGs are involved in numerous immunomodulatory pathways, such as “chemokine-mediated signaling pathway”, “response to chemokine”, “neutrophil migration”. The inhibition of cytokine-related signaling pathways may help avoid excessive inflammatory response and reduce the risk of inducing cytokine storms (Figure 4D). The reasonable combination of these activated and inhibited immune functional pathways may be a potential mechanism for the mildness of symptoms in some SFTS patients.
Figure 4 Continued. Figure 4 The PPI network extracted from initial PPI networks for the protein products of up and down-regulated DEGs induced by the moderate group, consisting of 95 nodes (A) and 52 nodes (B). The color and size of points demonstrate hubness of the node in the PPI network. PPI, protein–protein interaction; DEGs, differentially expressed genes. (C) The dot plot of the top 15 up-regulated enriched terms in the biological process identified in the moderate group. (D) The bar plot of the top 15 down-regulated BP-enriched terms identified in the moderate group. Criteria: p-value < 0.05.

SFTSV Triggers Cellular Immune Suppression in the Severe Group
A similar characteristic DEG extraction was performed on transcriptome data in the severe group, 102 up-regulated and 67 down-regulated DEGs were retained, respectively (Figure 5A and B). Gene ontology (GO) analysis showed that up-regulated DEGs in the severe group were mainly involved in the “defense response to virus”, “negative regulation of viral genome replication”, “humoral immune response”, “cytokine-mediated signaling pathway”, and “negative regulation of viral process”, playing a positive role in the antiviral process (Figure 5C). It is noteworthy that down-regulated DEGs are not only in the “chemokine mediated signaling pathway” but also in the “regulation of CD4-positive, alpha-beta T cell activation and differentiation” (Figure 5D). The suppression of cellular immune function is likely to be one of the immune escape mechanisms for the virus, which in turn leads to exacerbation of clinical symptoms in patients.
Figure 5 Continued. Figure 5 The PPI network extracted from initial PPI networks for the protein products of up and down-regulated DEGs induced by the severe group, consisting of 102 nodes (A) and 67 nodes (B). The color and size of points demonstrate hubness of the node in the PPI network. PPI, protein–protein interaction; DEGs, differentially expressed genes. (C) The connection of the top 15 up-regulated enriched terms in the biological process with specific DEGs identified in the severe group. (D) The dot plot of the top 15 down-regulated BP-enriched terms in the severe group. Criteria: p-value < 0.05.

Absent Immune Regulation and Impaired Coagulation Function in the Fatal Group
To investigate the possible biological interactions of DEGs and identify important functional networks, we identified 80 up-regulated and 76 down-regulated characteristic DEGs in the fatal group (Figure 6A and B). Peripheral immunity showed that the most strongly regulated biological groups are related to extensive induction of antiviral signaling pathways, activation of the cytokine-mediated signaling pathway, and humoral immune response (Figure 6C). But what is completely different from the moderate and severe groups is that down-regulated DEGs are no longer widely involved in immune regulation, especially in the inhibition of cytokine responses, but are strongly enriched in “blood coagulation”, “homeostasis”, “platelet activation”, and “regulation of cell-cell adhesion” (Figure 6D). This likely explains the dysregulated excessive inflammatory response in SFTS fatality. It is also emphasized that the hemorrhagic manifestations of the patients may be importantly linked not only to the apparent decrease in platelet counts but also to the underlying dysfunctions of coagulation and hemostasis.
Figure 6 Continued. Figure 6 The PPI network extracted from initial PPI networks for the protein products of up and down-regulated DEGs induced by the fatal group, consisting of 80 nodes (A) and 76 nodes (B). The color and size of points demonstrate hubness of the node in the PPI network. PPI, protein–protein interaction; DEGs, differentially expressed genes. (C) The bar plot of the top 15 up-regulated BP-enriched terms in the fatal group. (D) The connection of the top 15 down-regulated enriched terms in the biological process with specific DEGs identified in the fatal group. Criteria: p-value < 0.05.

The Biological Functions of Fatal Outcome-Related Gene Modules
The most suitable β value (β = 10) was determined as a soft threshold parameter to construct a scale-free network using the WGCNA package (Figure 7A and B). In the transcriptome data, 31 co-expression gene modules were identified by hierarchical clustering, and the dendrogram was clustered based on the dissimilarity measure (1-TOM) (Figure 7C and D). These modules based on differences in topological overlap were displayed in the 3D clustering map (Figure 7E and F). The correlations between the sample characteristics and the co-expression module were shown in Figure 7G, where the yellow module (eigengene value = 0.78) was significantly positively correlated with fatal SFTS. The brown module (eigengene value = −0.83) was significantly negatively correlated with the severity of SFTS. The immunity enrichment analysis showed that the yellow module was mainly involved in “positive regulation of B cell mediated immunity”, “positive regulation of immunoglobulin mediated immune response”, and “immunoglobulin production involved in immunoglobulin-mediated immune response” (Figure 8A and C). The significantly negatively correlated brown module tended to execute functions, including “response to interferon-alpha”, “interleukin-27-mediated signaling pathway”, “response to virus”, and “platelet activation” (Figure 8B and D).
Figure 7 Continued. Figure 7 WGCNA of the PBMC transcriptome. (A and B) Analysis of network topology for various soft-thresholding powers. The left panel shows the scale-free fit index (y-axis) as a function of the soft-thresholding power (x-axis). The right panel displays the mean connectivity (degree, y-axis) as a function of the soft-thresholding power (x-axis). (C) Clustering dendrogram of genes, with dissimilarity based on topological overlap, together with assigned module colors. (D) The heatmap depicts the Topological Overlap Matrix (TOM) of genes selected for weighted co-expression network analysis. Light color represents lower overlap and red represents higher overlap. (E and F) 3D cluster map of genes, based on differences in topological overlap, and assigned module colors. (G) Module-trait associations: Each row corresponds to a module eigengene and each column to a trait. Each cell contains the corresponding correlation and p-value.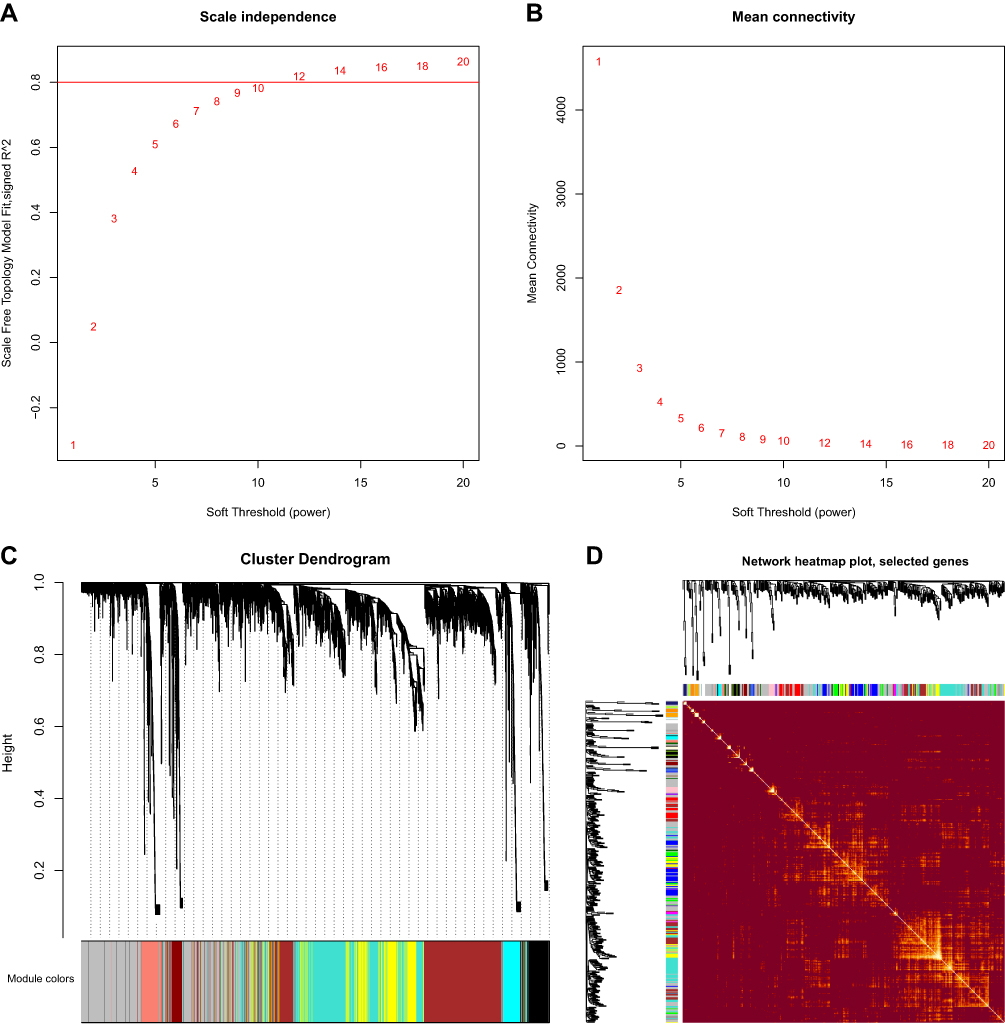

 |
Figure 8 (A and B) Scatter diagram for MM vs GS in the yellow and brown module. (C) The immunity functional enrichment analysis of the yellow gene module. (D) The GO functional enrichment analysis of the brown gene module. Criteria: p-value < 0.05. |
The Cytokines Transcriptional Profile of SFTS Patients
Given the lethal role of cytokine storm in SFTS patients, we have mapped the transcription profiles of 67 cytokine-related genes. The clustering analysis results indicate that 23 cytokine-related genes, including IL6, IL10, IL13, IL18, and IL19, are highly expressed in the SFTS patient group, especially in the fatal group. Forty-four cytokine-related genes, including IL1A, IL1B, IL2, IL4, CXCL8 (encoding IL-8), TGFB1 (encoding TGF‐β), etc., showed low expression in the fatal group (Figure 9).
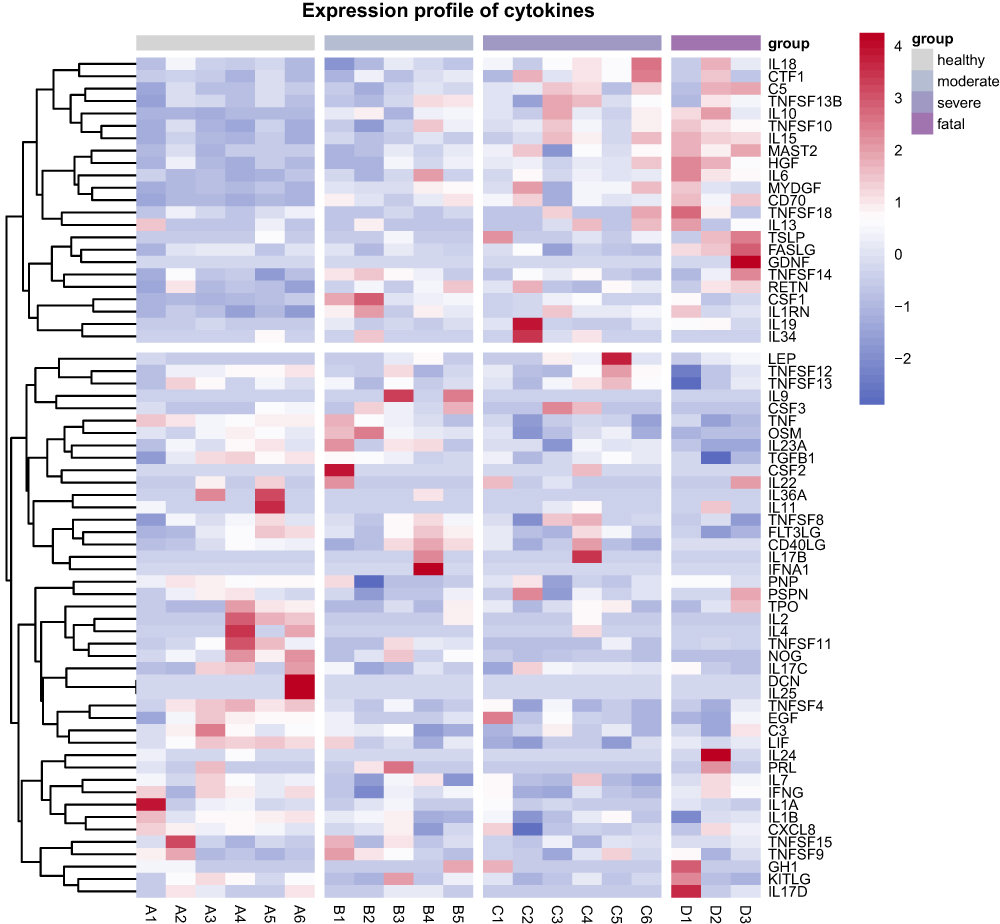 |
Figure 9 Hierarchical cluster analysis of 67 cytokine related genes in healthy control, moderate, severe, and fatal groups. Each row represents mRNA and each column represents a sample. Red indicates higher expression and blue indicates low expression. |
Discussion
With the expansion of geographical distribution, SFTS with high lethality poses an imminent threat to human and public health, but our understanding of its clinical heterogeneity remains limited. Studying the transcriptional response of patients to the virus and discussing the impact of host regulation on clinical manifestations and outcomes is crucial for unraveling viral pathogenesis. In this study, the integrating bioinformatics method was applied to assess the transcriptional response profiles of SFTS patients and portray the transcriptional characteristics of the patients. Our data reveal the complex molecular response mechanisms of the host, and in particular summarize key molecular features associated with lethal outcomes, providing a valid basis for the development of therapeutic approaches against this viral infection.
The cytokine-mediated inflammatory responses play crucial roles in disease progression during SFTSV infection.27,28 Appropriate cytokines can enhance immune responses, while dysregulated cytokines can lead to an imbalance between pro-inflammatory and anti–inflammatory effects, causing immune damage.10 Recent theoretical developments have revealed that the severity of SFTS is associated with uncontrolled inflammatory response,29 and have identified that cytokine storms are the main pathological feature of fatal SFTS patients.30 However, the molecular mechanisms underlying the relationship between cytokines or chemokines and disease severity in SFTSV infection have not been well resolved. We found that the up-regulated and down-regulated DEGs in both moderate and severe patients jointly regulate the cytokine-mediated signaling pathway, which may play a key role in maintaining a balance between pro-inflammatory and anti-inflammatory effects and contributing to patient recovery. In contrast, the significant absence of anti-inflammatory effects in deceased patients may be an important factor leading to the hyperinflammatory features and pathologic damage. In addition, consistent with the previous two studies, there was significant overexpression of IL6 and IL10 and low expression of TGFB1 in the fatal group, which is likely associated with cytokine storm and lethal outcomes.31,32 These results suggest that appropriate immunosuppressive therapy may help to improve inflammation and pathological damage in SFTS patients and deserve further investigation.
There are growing appeals for the crucial role of T cell dysregulation in SFTS. Specifically, patients in the poor prognosis group have lower numbers of CD3+, CD3+ CD4+, and CD3+ CD8+ T cell clusters than healthy controls.33 Compared with those in surviving patients, CD4+ T-cell depletion, Th1, Th2, and Treg numbers decreased were observed in deceased patients.34 The above research results reveal the cellular immune dysregulation in SFTS patients from the perspective of cell subpopulation counting. In our study, we further discovered the inhibition of T cell activation and differentiation function in severe patients, which are mainly executed by SMAD7, CD83, JUNB, SOCS1, IFNG, TNFSF4, NFKBIZ, and CD160, revealing the potential mechanism of cellular immune damage from a molecular perspective.
In our study, all patients showed activation of humoral immunity compared to healthy controls. Strikingly, WGCNA showed that gene modules significantly positively associated with lethal outcomes were also extensively involved in B cell and immunoglobulin mediated immune response. Before this, several studies have also explored the role of humoral immunity in SFTS. For example, the percentage of B cells in the poor prognosis group was significantly higher than that in the recovery group,33 and the proliferation of peripheral plasmablasts in lethal SFTS was higher than that in self-limiting SFTS but showed dysfunctional features.35 Autopsies following fatal human studies have identified B-cell lineage plasmablasts as one of the major target cells for SFTSV infection in fatal SFTS,36 and a scRNA-seq study also found that IFN-I-inducible plasmablast expansion characteristics are associated with fatal outcome in SFTS.37 Thus, it can be seen that adaptive B cell immunity is of great significance for the successful clearance of viruses, but dysregulated humoral immunity and the ensuing immunopathologic impairment are likely to lead to fatal outcomes. The monitoring and functional regulation of B cell clusters were expected to become key signals for predicting patient severity and important means of improving treatment outcomes.
Earlier studies have identified clinical manifestations during the progression of SFTS, such as bleeding manifestations, neurologic symptoms, persistent thrombocytopenia, and the occurrence of DIC and MOF, are the main risk factors associated with mortality.38 In addition to the immune landscape, the most distinctive feature observed in deceased patients in this study was coagulation dysfunction, specifically manifested as inhibition of platelet activation and coagulation, as well as a significant negative correlation between the gene modules that perform the relevant functions and mortality outcomes. Consistent with our results, previous studies have also found that the expression levels of platelet activation signaling pathway components were down-regulated during SFTSV infection with prolonged duration of infection, suggesting that SFTSV could induce thrombocytopenia by inhibiting platelet activation.39 These research findings suggest that the inhibition of platelet activation function and the decrease in platelet count may synergistically induce coagulation dysfunction, increase the propensity for bleeding and DIC in SFTS patients, and lead to adverse outcomes. Therefore, in clinical treatment, especially for patients with bleeding manifestations, corresponding measures should be fully considered to improve the coagulation function of patients.
Conclusion
Taken together, our data revealed complex molecular response mechanisms underlying the clinical heterogeneity of SFTS patients and identified immunoregulatory phenomena and coagulation dysfunction features associated with lethal outcomes. These results extend our understanding of the pathogenesis of lethal SFTSV infection and contribute to the development of countermeasures against SFTSV. Nevertheless, the limitation of our study is that the sample size included in the study is small and limited to transcriptomic analysis, lacking further clinical and experimental data to validate potential mechanisms. In follow-up studies, larger clinical studies and more in-depth validation experiments need to be further carried out.
Data Sharing Statement
The transcriptomic data presented in the study was uploaded to the GEO database (https://www.ncbi.nlm.nih.gov/geo/) under accession number GSE264635.
Ethics Approval and Consent to Participate
All authors confirmed that this study complied with the Declaration of Helsinki. All participants signed written informed consent, and this study was approved by the Ethical Approval Committee of the Shandong Center for Disease Control and Prevention (Ethical approval number: SDJK-2021-25).
Funding
This work was supported by the Youth Innovation Foundation of Shandong Center for Disease Control and Prevention(QC-2022-03); Medical and Health Technology Development Plan in Shandong Province(202201061043).
Disclosure
The authors report no conflicts of interest in this work.
References
1. Yu XJ, Liang MF, Zhang SY, et al. Fever with thrombocytopenia associated with a novel bunyavirus in China. New Engl J Med. 2011;364(16):1523–1532. doi:10.1056/NEJMoa1010095
2. Li S, Li H, Zhang YL, et al. SFTSV infection induces BAK/BAX-dependent mitochondrial DNA release to trigger NLRP3 inflammasome activation. Cell Rep. 2020;30(13):4370–4385e4377. doi:10.1016/j.celrep.2020.02.105
3. Jiang XM, Xin QL, Liu K, et al. Regulation of the WNT-CTNNB1 signaling pathway by severe fever with thrombocytopenia syndrome virus in a cap-snatching manner. mBio. 2023;14(6):e0168823. doi:10.1128/mbio.01688-23
4. Hu YY, Zhuang L, Liu K, et al. Role of three tick species in the maintenance and transmission of severe fever with thrombocytopenia syndrome virus. PLoS Negl Trop Dis. 2020;14(6):e0008368. doi:10.1371/journal.pntd.0008368
5. Jiang XL, Zhang S, Jiang M, et al. A cluster of person-to-person transmission cases caused by SFTS virus in Penglai, China. Clin Microbiol Infect. 2015;21(3):274–279. doi:10.1016/j.cmi.2014.10.006
6. Jung IY, Choi W, Kim J, et al. Nosocomial person-to-person transmission of severe fever with thrombocytopenia syndrome. Clin Microbiol Infect. 2019;25(5):633e631–633e634. doi:10.1016/j.cmi.2019.01.006
7. Tran XC, Yun Y, Van An L, et al. Endemic severe fever with thrombocytopenia syndrome, Vietnam. Emerg Infect Dis. 2019;25(5):1029–1031. doi:10.3201/eid2505.181463
8. Win AM, Nguyen YTH, Kim Y, et al. Genotypic heterogeneity of orientia tsutsugamushi in scrub typhus patients and thrombocytopenia syndrome co-infection, Myanmar. Emerg Infect Dis. 2020;26(8):1878–1881. doi:10.3201/eid2608.200135
9. Rattanakomol P, Khongwichit S, Linsuwanon P, Lee KH, Vongpunsawad S, Poovorawan Y. Severe Fever with Thrombocytopenia Syndrome Virus Infection, Thailand, 2019–2020. Emerg Infect Dis. 2022;28(12):2572–2574. doi:10.3201/eid2812.221183
10. Wang M, Tan W, Li J, Fang L, Yue M. The endless wars: severe fever with thrombocytopenia syndrome virus, host immune and genetic factors. Front Cell Infect Microbiol. 2022;12:808098. doi:10.3389/fcimb.2022.808098
11. Peng C, Wang H, Zhang W, et al. Decreased monocyte subsets and TLR4-mediated functions in patients with acute severe fever with thrombocytopenia syndrome (SFTS). Internat J Infect Dis. 2016;43:37–42. doi:10.1016/j.ijid.2015.12.009
12. Sun Y, Jin C, Zhan F, et al. Host cytokine storm is associated with disease severity of severe fever with thrombocytopenia syndrome. J Infect Dis. 2012;206(7):1085–1094. doi:10.1093/infdis/jis452
13. Li MM, Zhang WJ, Liu J, et al. Dynamic changes in the immunological characteristics of T lymphocytes in surviving patients with severe fever with thrombocytopenia syndrome (SFTS). Internat J Infect Dis. 2018;70:72–80. doi:10.1016/j.ijid.2018.03.010
14. Wang G, Chang H, Jia B, et al. Nucleocapsid protein-specific IgM antibody responses in the disease progression of severe fever with thrombocytopenia syndrome. Ticks Tick Borne Dis. 2019;10(3):639–646. doi:10.1016/j.ttbdis.2019.02.003
15. Blanco-Melo D, Nilsson-Payant BE, Liu WC, et al. Imbalanced Host Response to SARS-CoV-2 Drives Development of COVID-19. Cell. 2020;181(5):1036–1045e1039. doi:10.1016/j.cell.2020.04.026
16. Lu S, Zhu N, Guo W, et al. RNA-Seq revealed a circular RNA-microRNA-mRNA regulatory network in hantaan virus infection. Front Cell Infect Microbiol. 2020;10:97. doi:10.3389/fcimb.2020.00097
17. Bermudez-Mendez E, Angelino P, van Keulen L, et al. Transcriptomic profiling reveals intense host-pathogen dispute compromising homeostasis during acute rift valley fever virus infection. J Virol. 2023;97(6):e0041523. doi:10.1128/jvi.00415-23
18. Zhang L, Peng W, Wu J, et al. Pathogenicity and landscape of differential gene expression in mice orally infected with clinical coxsackievirus A6 (CA6). J Virol. 2024;98(2):e0135823. doi:10.1128/jvi.01358-23
19. Zhang Y, Zhao L, Zhang J, et al. Antibody and transcription landscape in peripheral blood mononuclear cells of elderly adults over 70 years of age with third dose of COVID-19 BBIBP-CorV and ZF2001 booster vaccine. Immu Age. 2024;21(1):11. doi:10.1186/s12979-023-00408-x
20. Robinson MD, McCarthy DJ, Smyth GK. edgeR: a Bioconductor package for differential expression analysis of digital gene expression data. Bioinformatics. 2010;26(1):139–140. doi:10.1093/bioinformatics/btp616
21. Ritchie ME, Phipson B, Wu D, et al. limma powers differential expression analyses for RNA-sequencing and microarray studies. Nucleic Acids Res. 2015;43(7):e47. doi:10.1093/nar/gkv007
22. Szklarczyk D, Gable AL, Lyon D, et al. STRING v11: protein-protein association networks with increased coverage, supporting functional discovery in genome-wide experimental datasets. Nucleic Acids Res. 2019;47(D1):D607–D613. doi:10.1093/nar/gky1131
23. Doncheva NT, Morris JH, Gorodkin J, Jensen LJ. Cytoscape StringApp: network analysis and visualization of proteomics data. J Prot Res. 2019;18(2):623–632. doi:10.1021/acs.jproteome.8b00702
24. Wu T, Hu E, Xu S, et al. clusterProfiler 4.0: a universal enrichment tool for interpreting omics data. Innovation. 2021;2(3):100141. doi:10.1016/j.xinn.2021.100141
25. Langfelder P, Horvath S. WGCNA: an R package for weighted correlation network analysis. BMC Bioinf. 2008;9:559. doi:10.1186/1471-2105-9-559
26. Bindea G, Mlecnik B, Hackl H, et al. ClueGO: a Cytoscape plug-in to decipher functionally grouped gene ontology and pathway annotation networks. Bioinformatics. 2009;25(8):1091–1093. doi:10.1093/bioinformatics/btp101
27. Ding YP, Liang MF, Ye JB, et al. Prognostic value of clinical and immunological markers in acute phase of SFTS virus infection. Clin Microbiol Infect. 2014;20(11):O870–878. doi:10.1111/1469-0691.12636
28. Kwon JS, Kim MC, Kim JY, et al. Kinetics of viral load and cytokines in severe fever with thrombocytopenia syndrome. J Clin Virol. 2018;101:57–62. doi:10.1016/j.jcv.2018.01.017
29. Casel MA, Park SJ, Choi YK. Severe fever with thrombocytopenia syndrome virus: emerging novel phlebovirus and their control strategy. Exp Mol Med. 2021;53(5):713–722. doi:10.1038/s12276-021-00610-1
30. Hu LF, Wu T, Wang B, et al. The regulation of seventeen inflammatory mediators are associated with patient outcomes in severe fever with thrombocytopenia syndrome. Sci Rep. 2018;8(1):159. doi:10.1038/s41598-017-18616-z
31. Kang SY, Yoo JR, Park Y, et al. Fatal outcome of severe fever with thrombocytopenia syndrome (SFTS) and severe and critical COVID-19 is associated with the hyperproduction of IL-10 and IL-6 and the low production of TGF-β. J Med Virol. 2023;95(7):e28894. doi:10.1002/jmv.28894
32. Yoo JR, Kim TJ, Heo ST, et al. IL-6 and IL-10 levels, rather than viral load and neutralizing antibody titers, determine the fate of patients with severe fever with thrombocytopenia syndrome virus infection in South Korea. Front Immunol. 2021;12:711847. doi:10.3389/fimmu.2021.711847
33. Liu J, Wang L, Feng Z, et al. Dynamic changes of laboratory parameters and peripheral blood lymphocyte subsets in severe fever with thrombocytopenia syndrome patients. Internat J Infect Dis. 2017;58:45–51. doi:10.1016/j.ijid.2017.02.017
34. Li MM, Zhang WJ, Weng XF, et al. CD4 T cell loss and Th2 and Th17 bias are associated with the severity of severe fever with thrombocytopenia syndrome (SFTS). Clin Immunol. 2018;195:8–17. doi:10.1016/j.clim.2018.07.009
35. Song P, Zheng N, Liu Y, et al. Deficient humoral responses and disrupted B-cell immunity are associated with fatal SFTSV infection. Nat Commun. 2018;9(1):3328. doi:10.1038/s41467-018-05746-9
36. Yamaoka S, Weisend C, Ebihara H. Identifying target cells for a tick-borne virus that causes fatal hemorrhagic fever. J Clin Invest. 2020;130(2):598–600. doi:10.1172/JCI134512
37. Li H, Li X, Lv S, et al. Single-cell landscape of peripheral immune responses to fatal SFTS. Cell Rep. 2021;37(8):110039. doi:10.1016/j.celrep.2021.110039
38. Gai ZT, Zhang Y, Liang MF, et al. Clinical progress and risk factors for death in severe fever with thrombocytopenia syndrome patients. J Infect Dis. 2012;206(7):1095–1102. doi:10.1093/infdis/jis472
39. Fu H, Wang Y, Yuan C, et al. Screening core genes and signaling pathways after SFTSV infection by integrated transcriptome profiling analysis. Virus Res. 2023;332:199138. doi:10.1016/j.virusres.2023.199138
 © 2024 The Author(s). This work is published and licensed by Dove Medical Press Limited. The
full terms of this license are available at https://www.dovepress.com/terms.php
and incorporate the Creative Commons Attribution
- Non Commercial (unported, 3.0) License.
By accessing the work you hereby accept the Terms. Non-commercial uses of the work are permitted
without any further permission from Dove Medical Press Limited, provided the work is properly
attributed. For permission for commercial use of this work, please see paragraphs 4.2 and 5 of our Terms.
© 2024 The Author(s). This work is published and licensed by Dove Medical Press Limited. The
full terms of this license are available at https://www.dovepress.com/terms.php
and incorporate the Creative Commons Attribution
- Non Commercial (unported, 3.0) License.
By accessing the work you hereby accept the Terms. Non-commercial uses of the work are permitted
without any further permission from Dove Medical Press Limited, provided the work is properly
attributed. For permission for commercial use of this work, please see paragraphs 4.2 and 5 of our Terms.