")
Back to Journals » Journal of Inflammation Research » Volume 17
Transcriptomic Insights into Hub Genes, Immune Infiltration, and Candidate Drugs in Erosive Esophagitis
Authors Zhao Y, Chen X, Huang Y, Zhang Z, Wang K, Zou D, Ma T
Received 25 May 2024
Accepted for publication 17 September 2024
Published 28 October 2024 Volume 2024:17 Pages 7745—7760
DOI https://doi.org/10.2147/JIR.S479032
Checked for plagiarism Yes
Review by Single anonymous peer review
Peer reviewer comments 2
Editor who approved publication: Professor Ning Quan
Ye Zhao,1,* Xi Chen,1,* Yuhan Huang,2,* Zhihan Zhang,3 Kui Wang,1 Duowu Zou,1 Teng Ma2
1Department of Gastroenterology, Ruijin Hospital, Shanghai Jiao Tong University School of Medicine, Shanghai, People’s Republic of China; 2Department of Thoracic Surgery, Zhongshan Hospital, Fudan University, Shanghai, People’s Republic of China; 3Department of Pathology, Ruijin Hospital, Shanghai Jiao Tong University School of Medicine, Shanghai, People’s Republic of China
*These authors contributed equally to this work
Correspondence: Teng Ma, Department of Thoracic Surgery, Zhongshan Hospital, Fudan University, 180 Fenglin Road, Shanghai, 200032, People’s Republic of China, Email [email protected] Duowu Zou, Department of Gastroenterology, Ruijin Hospital, Shanghai Jiao Tong University School of Medicine, 197 Ruijin Er Road, Shanghai, 200025, People’s Republic of China, Email [email protected]
Purpose: This study aimed to investigate gene expression profiles, identify potential hub genes, and predict drugs for patients with erosive esophagitis (EE). Despite its clinical significance, molecular-level exploration of this condition has been limited.
Patients and Methods: RNA sequencing was performed on clinical biopsy samples from eight EE patients and eight healthy controls. Integrated bioinformatic tools were then utilized to analyze the data, including functional enrichment analysis, protein-protein interaction network analysis, weighted gene co-expression network analysis, immune infiltration analysis, and identification of small-molecule compounds. Additionally, the expressions of the identified hub genes were assessed in clinical samples.
Results: A total of 2801 genes with differential expression were identified, including four potential hub genes: SOX9, SPP1, TIMP1, and TLR4. Moreover, the overexpression of these hub genes was verified in clinical samples. Analysis of Immune infiltration indicated an imbalance in the distribution of immune cell types in patients with EE. Correlation analysis between immune cells and hub genes unveiled noteworthy relationships. Specifically, SOX9 exhibited a negative correlation with CD8 T cells but a positive correlation with resting memory CD4 T cells. SPP1 displayed a positive correlation with naïve B cells, while TIMP1 exhibited a negative correlation with resting dendritic cells. Furthermore, the study identified ten small-molecule drugs with potential therapeutic effects for EE, including loreclezole and mercaptopurine.
Conclusion: This study provides valuable insights into the molecular understanding of EE, offering new perspectives on disease mechanisms. The findings may inspire further research leading to the development of novel treatment strategies for EE.
Keywords: erosive esophagitis, RNA sequencing, bioinformatics analysis, immune infiltration, drug prediction
Introduction
Gastroesophageal reflux disease (GERD) is widely considered the most prevalent digestive disorder among adults, posing a significant public health issue.1,2 Patients with GERD commonly manifest symptoms such as distressing heartburn, effortless regurgitation, and additional complications, causing challenges in clinical management.3 A recent systematic review of nearly one hundred studies revealed its worldwide average prevalence of 13.3%.4 GERD has two primary subtypes, non-erosive reflux disease (NERD) and erosive esophagitis (EE), mainly based on the presence or absence of macroscopic erosions.5 By performing endoscopy, clinicians can diagnose GERD patients with esophageal mucosal breaks or ulcerations as having EE and grade its severity from A (mild) to D (severe) according to the Los Angeles (LA) classification system.6,7
The understanding of the pathogenesis of GERD has undergone a significant transformation from a conventional “top-down” model to the later “bottom-up” concept, commonly referred to as the “cytokine sizzle”.8,9 The theory of cytokine-driven mucosal injury suggests that cytokine secretion triggered by reflux sets in motion the development of esophagitis.9 The esophageal mucosa acts as the first defense against the noxious refluxate, playing a pivotal role in the pathogenesis of GERD. Recent advances in exploring how the aggressive components of the refluxate lead to mucosal inflammation have contributed to the current integrated view of pathogenesis of GERD mucosa, which includes changes in the permeability of the esophageal epithelial barrier, activation of nociceptive nerves, and inflammation mediated by cytokines.9
Heterogeneity of reflux components and causal factors can affect symptom perception and treatment efficacy of EE.9 Molecular analysis at the mucosal level may provide a better explanation for the differences in disease symptoms and treatment response.9 Pathophysiological mechanisms underlying GERD are still poorly understood. Although our recent study identified the transcriptomic signature of NERD,10 gene expression signatures of EE remain elusive.
This study involved RNA sequencing and comprehensive transcriptional analysis performed on treatment-naïve individuals with EE. The primary objectives of this study were to identify and validate hub genes, investigate immune cell infiltration, and predict potential drug candidates for the treatment of EE. Hub genes were determined using weighted gene co-expression network analysis (WGCNA) and protein-protein interaction (PPI) network analysis. Subsequent validation was performed using samples from EE patients and rat experimental models. Additionally, an extensive analysis of immune cell infiltration in EE was conducted, and for the first time, Connectivity Map (CMap) analysis was applied to predict small-molecule compounds for EE treatment. The findings of this study offer valuable insights into the pathogenesis of EE and present potential therapeutic approaches.
Materials and Methods
Biopsy Specimens
Eight consecutive patients with EE and eight healthy controls (HCs) were recruited for this study. All participants, including both healthy volunteers and those with symptoms suggestive of GERD, agreed to undergo 24-hour (24-h) multiple intraluminal impedance-pH (MII-pH) monitoring and endoscopy consecutively. EE was defined as having abnormal 24-h MII-pH parameters and the presence of EE. Patients with lower grades of esophagitis (LA grades A or B) were excluded, while those with LA grades C or D were included. HCs were defined as individuals with negative pH-impedance investigations and no esophageal mucosal lesions. Tissue samples from EE patients and HCs were obtained from Ruijin Hospital, affiliated with Shanghai Jiao Tong University. All participants enrolled, both HCs and EE patients, had not received any antisecretory or prokinetic therapy prior to the study. The samples were taken from macroscopically intact esophageal mucosa near the mucosal breaks, approximately 5 cm away from the squamocolumnar junction. Informed consent was obtained from all participants, and the study protocol was approved by Ruijin Hospital ethics committee in accordance with the Declaration of Helsinki.
Transcriptome Sequencing
Biopsies from eight patients with EE and eight HC volunteers were collected and then immersed in RNAlater solution (Ambion, TX, USA). The RNA extraction, library creation, and sequencing analysis were performed by Novogene (Beijing, China). RNA integrity and library quality were assessed using a Bioanalyzer 2100 machine (Agilent Technologies, CA, USA). For sequencing, an illumine NovaSeq6000 platform (Illumina, CA, USA) was utilized.
Differential Analysis and WGCNA
We conducted differential analysis and WGCNA by following the methodologies outlined in our previously published article.10 The read counts normalization and analysis of differentially expressed genes (DEGs) was performed using DESeq2. The principal component analysis (PCA) was conducted to elucidate the comparability between samples. The thresholds for significant differential expression were defined as adjusted P- value < 0.05 and absolute fold change (FC) > 2. The WGCNA was recruited to determine the relative significance and module membership of mRNAs.11 The minimal number of module genes was determined to be 30. The H-clust tool in R was used to construct the network heatmap graphic of co-expression modules.
Gene Ontology (GO) and Pathway Enrichment Analysis
ClueGO (version 2.5.7), a plugin of Cytoscape, was employed to visualize the results of GO analysis for the biological process (BP), cellular component (CC), and molecular function (MF).12 The web tool Metascape (http://metascape.org) was used to perform the pathway enrichment analysis of the Kyoto Encyclopedia of Genes and Genomes (KEGG).13
PPI Network Construction and Hub Gene Extraction
The STRING database (http://string-db.org/) was utilized to construct the PPI network for the DEGs.14 To identify the hub genes within the DEGs PPI network, the CytoHubba plugin from Cytoscape software (version 3.8.2) was employed.15 Hub genes that were present in both the PPI network and the WGCNA network were extracted using a Venn diagram.
Gene Set Enrichment Analysis (GSEA)
We utilized GSEA (www.broadinstitute.org/gsea) to identify enriched functions and pathways from the curated gene sets (C2: canonical pathways) in the Molecular Signature Database, consistent with our prior research.
Establishment of Rat Models of Reflux Esophagitis
Six-week-old Sprague-Dawley male rats were procured from the Shanghai branch of Beijing Vital River Laboratory Animal Technology Co., Ltd. The breeding and surgical procedures for the experimental animals were carried out within the barrier environment of the Animal Experiment Center, located at Ruijin Hospital. All animal studies were approved by Animal Ethic Committee of Ruijin Hospital. The rats underwent solid food restriction one day prior to and following the surgery. The surgical procedure of esophagoduodenostomy anastomosis was performed on ten rats through an upper midline incision, as described in previously published studies.16 Additionally, a control group consisting of ten rats underwent a sham surgery. Esophageal tissue samples from both groups were stained with hematoxylin and eosin (H&E) for histological examination to assess the effectiveness of the model.
Validation Analysis of RNA Sequencing in Clinical Samples and Rat Models
Total RNA was extracted from biopsy samples and established rat models for quantitative reverse transcription polymerase chain reaction (qRT-PCR) analysis using TRIzol reagent (Invitrogen, CA, USA). The mRNA levels were then analyzed using SYBR Green Master Mix (Yeasen, Shanghai, China), with β-Actin serving as the internal control. The primer sequences utilized in this study are listed in Table S1. To evaluate the discriminative ability of putative hub genes in distinguishing between patients with EE and healthy controls (HCs), receiver operating characteristic (ROC) curves were generated using the R program (pROC). qPCR detection and ROC analysis were performed on biopsy tissue samples from twenty cases in the EE group and twenty cases in the HC group. Additionally, qPCR validation was conducted on rat model tissues using ten cases from the modeling group and ten cases from the sham operation group. Furthermore, the expressions of hub genes in clinical samples were assayed by immunohistochemistry (IHC). The antibody information used in IHC is as follow: Anti-SOX9 antibody (ab185966, Abcam, USA), Anti-SPP1 antibody (22952-1-AP, Proteintech, China), Anti-TIMP1 antibody (ab216432, Abcam, USA) and Anti-TLR4 antibody (ab22048, Abcam, USA).
Immune Infiltration Analysis
To evaluate the expression of immune genes in EE, we initially obtained a set of 2483 immune-related genes from the IMMPORT database (http://www.immport.org/home).17 Subsequently, by intersecting these genes with our DEGs data, we identified a total of 305 up-regulated immune-related genes. From these, we selected the top 20 genes with the highest log2 FC for further analysis. The expression data was then normalized using the “Limma” R package. Next, we utilized the CIBERSORT algorithm to assess the infiltration profile of immune cells between EE and HC samples.18 For this analysis, we obtained the reference signature matrix “LM22” from the CIBERSORT website (http://CIBERSORT.stanford.edu/), which contains genetic information for 22 major immune cell subtypes. Finally, we conducted correlation analysis between our 4 hub genes and the relevant immune characteristics, based on the results of immune cell infiltration analysis. All the aforementioned results were visualized using the R packages “corrplot”, “pheatmap”, and “ggplot2”.
Drug Prediction
To identify potential drugs effective against EE, we utilized the Broad Institute’s CMap, an innovative online tool capable of identifying chemical compounds that target specific gene expression signatures.19 By comparing the selected genes with the integrated data in the tool, potential drug candidates could be predicted based on their ability to modify gene expression. The genes in the WGCNA turquoise module were sorted in descending order by log2 FC, and 100 genes containing the four hub genes were selected for CMap analysis. Compounds with a negative connectivity score were considered effective for EE. The SwissTargetPrediction web tool (http://www.swisstargetprediction.ch/) was used to determine the macromolecular targets of the compounds. 3D molecular models of potential drugs were retrieved from PubChem (https://pubchem.ncbi.nlm.nih.gov/), while the 2D structural information was obtained from PDB (https://www.rcsb.org/) and transformed into 3D profiles using Chem3D (version 21.0). For further molecular docking analysis and visualization of results, we utilized AutoDock (version 4.2.6), AutoDock Vina (version 1.1.2), and PyMol (version 2.5). Furthermore, the ADMET descriptors algorithm protocol was employed to measure the ADMET properties (absorption, distribution, metabolism, excretion, and toxicity) of the drugs. This assessment plays a crucial role in evaluating the drugs’ overall suitability for further development and their potential for clinical utilization (https://biosig.lab.uq.edu.au/pkcsm/).20
Statistical Analyses
The qRT-PCR data were reported as the mean±standard deviation. The statistical significance of differences was assessed using the non-parametric Mann Whitney U-test and the Student’s t-test (for normal distribution). In addition, other statistical analyses in this study were conducted using R studio software and the mentioned bioinformatical tools.
Results
RNA-Seq Data Processing
Biopsy samples were obtained from a total of eight patients with EE and eight HC volunteers for the purpose of RNA sequencing. The demographic and clinical characteristics of these patients are provided in Table S2. The resulting sequencing data set has been deposited into the Gene Expression Omnibus (GEO) under the accession number GSE190027. A visual representation of the study’s design can be found in Figure S1.
Differential Expressed Genes
The gene profiles of the two groups exhibited significant differences as revealed by the PCA analysis of the RNA-seq data (Figure 1a). The EE and HC groups exhibited a total of 2801 DEGs, with 2102 genes upregulated and 699 genes downregulated. Figure 1b depicts a volcano plot illustrating the distribution of gene expression based on the log2 FC and – log10 adjusted P-value for all genes. The heatmap in Figure 1c displays all the DEGs.
 |
Figure 1 Analysis of RNA sequencing data. (a) Principal component analysis (PCA) of sequencing data generated from biopsies of eight patients with erosive esophagitis (EE) and eight healthy controls (HCs). (b) The distribution of differentially expressed genes (DEGs) is presented in a volcano plot, which provides an overview of their expression patterns. Upregulated genes are shown as red dots, while downregulated genes are represented as blue dots. (c) DEGs retrieved from sequencing data are illustrated in the clustered heatmap. Red in the heatmap denotes upregulation, while green denotes downregulation. |
Functional Enrichment Analysis and GSEA
GO analysis was conducted to investigate the biological functions of the DEGs, and the top terms of BP, CC, and MF are depicted in Figure 2a–c. The BP analysis revealed significant associations of the DEGs with complement activation, morphogenesis of branching structures, and appendage morphogenesis. The major CC terms were immunoglobulin complexes, extracellular matrix, and blood microparticles. Regarding MF, the DEGs were enriched in integrin binding, glycosaminoglycan binding, and peptide receptor activity. Notably, immune-related BP terms such as adaptive immune response, regulation of leukocyte activation, and leukocyte-mediated immunity were prominently identified. KEGG pathway analysis indicated that the DEGs were mainly enriched in protein digestion and absorption, neuroactive ligand-receptor interaction, and complement and coagulation cascades (Figure 2d).
 |
Figure 2 Enrichment analyses of DEGs. (a) Biological process. (b) Cellular component. (c) Molecular function. (d) Heatmap of the Kyoto Encyclopedia of Genes and Genomes enriched terms colored by p-values. (e) Gene Set Enrichment Analysis (GSEA) on the genes demonstrating high expression in the EE group. (f) GSEA on the genes demonstrating low expression in the EE group. |
The results of GSEA revealed distinct gene enrichment patterns between the EE and HC groups. Specifically, we found that genes that were highly expressed in EE group were enriched in several pathways, including the IL-18 signaling pathway, chemokine signaling pathway, leukocyte transendothelial migration, and cytokine-cytokine receptor interaction (Figure 2e). These pathways are known to play crucial roles in immune responses and inflammatory processes. On the other hand, the genes that were found to be lowly expressed in the EE group were specifically enriched in mitochondria-related pathways. This suggests the presence of oxidative stress damage and mitochondrial dysfunction in the EE group. This finding aligns with a previous report that demonstrated the importance of oxidoreductase activity, mitochondrial biogenesis, and adenosine triphosphate biogenesis in maintaining barrier function through the regulation of energy-dependent tight junctions (Figure 2f).16
Overall, these results shed light on the molecular mechanisms underlying the effects of EE on gene expression and cellular pathways. The enrichment of genes in specific signaling pathways suggests the involvement of immune and inflammatory processes in the response to EE, while the mitochondrial dysfunction provides insights into the potential impact on cellular energy metabolism and barrier function.
Modules of WGCNA
A total of 31377 genes obtained from the sequencing analysis results were analyzed using WGCNA. Hierarchical clustering analysis did not identify any outlier samples (Figure 3a). The correlation coefficient was 0.82, and we set β = 2 as the optimal soft-thresholding power (Figure 3b). The hierarchical clustering tree displayed 25 distinct modules (Figure 3c). The module-trait relationships indicated that the turquoise (r = - 0.95, p = 2e-08), brown (r = - 0.77, p = 5e-04), and royal blue (r = - 0.77, p = 5e-04) modules exhibited the strongest correlations with the histological results (Figure 3d). A heatmap plot displays the clustering dendrogram of all selected genes (Figure 3e). Figure 3f depicts the hierarchical clustering dendrogram and eigengene adjacency heatmap, illustrating the connections between coexpression modules and the trait weight. The Median Rank statistics and the Preservation Zsummary statistics of each module are displayed in Figure 4a and b. Among the three most correlated modules (turquoise, brown, and royal blue), the turquoise module, which had a medium statistic median rank (Figure 4a) and maximum Zsummary preservation (Figure 4b), was identified as the key module.
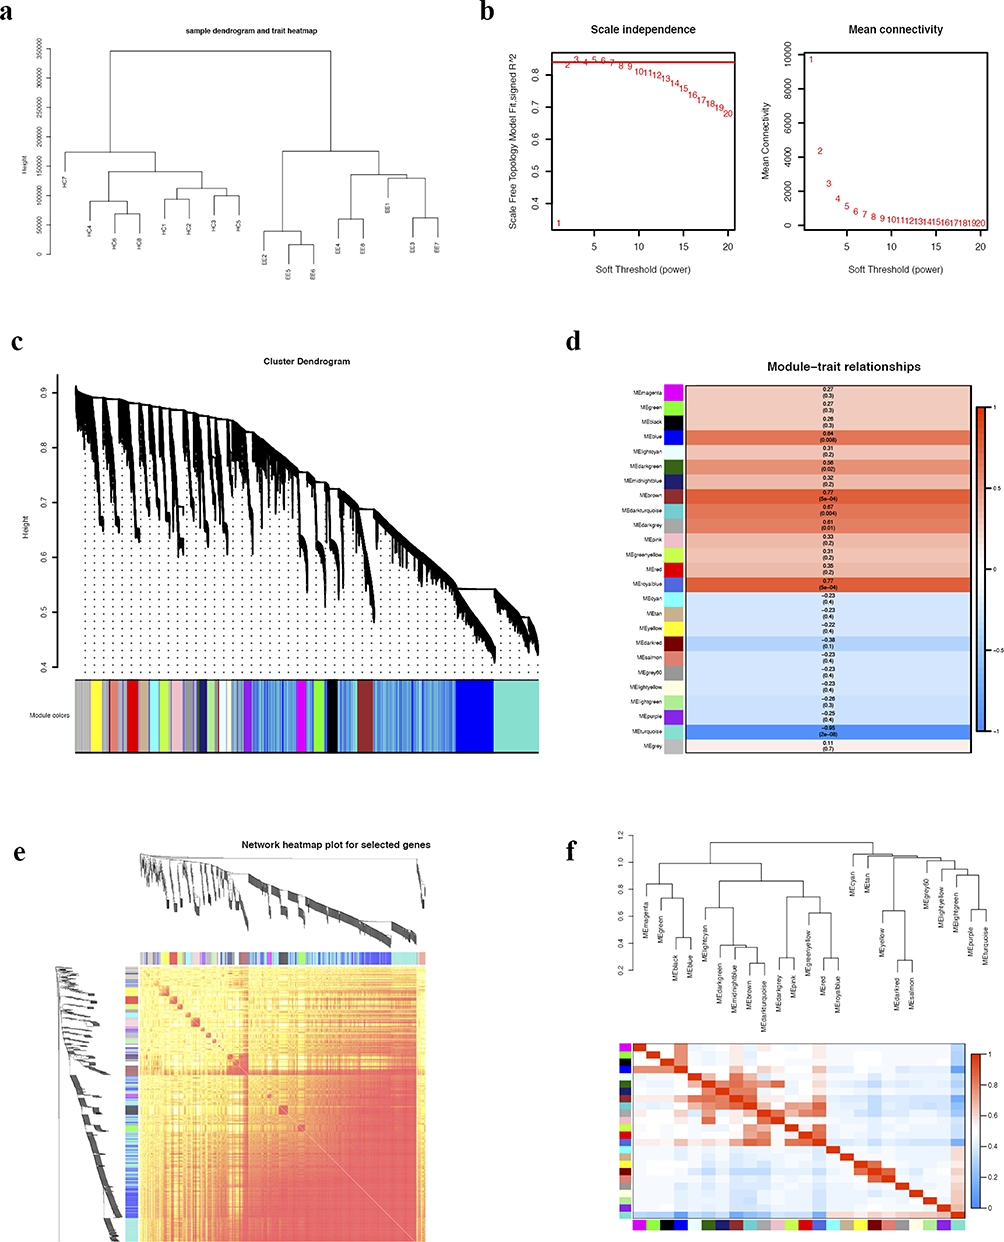 |
Figure 3 Weighted gene co-expression network analysis (WGCNA). (a) Sample dendrogram and trait heatmap. (b) Analysis of scale-free fit index (left) and mean connectivity (right) for various soft-thresholding powers. (c) Clustering dendrogram of genes for GSE190027 with assigned module colors. (d) The module–trait association analysis reveals the relationship between modules and EE. (e) Heatmap plot of clustering dendrogram for selected genes. (f) Visualization of connectivity between coexpression modules and clinical trait weights using hierarchical clustering dendrogram and eigengene adjacency heatmap. |
 |
Figure 4 Identification of hub genes. (a) The median rank statistics of each module indicate that a module with a lower median rank demonstrates higher observed preservation statistics compared to a module with a higher median rank. (b) The preservation Zsummary statistics of each module reveal that the module with the relatively higher preservation statistics Zsummary and the relatively lower preservation statistics medianRank was identified as the key module. (c) The top 18 hub genes using Cytoscape based on the protein-protein interaction (PPI) network. The color indicates the score calculated by Degree algorithm of CytoHubba plugin, with higher scores appearing more red and lower scores appearing more yellow. (d) Venn diagram depicting overlapping genes in the DEG-PPI Network and WGCNA. (e) Hub genes are illustrated in the clustered heatmap. Red in the heatmap denotes upregulation, while blue denotes downregulation. |
PPI Network Analysis and Hub Gene Identification
We constructed a PPI network using 1824 nodes and 13591 edges that were derived from the protein-coding DEGs to identify the key genes associated with EE (Figure S2). Subsequently, the interactive relationships were incorporated into Cytoscape plugins. By utilizing the Degree algorithm of CytoHubba plugin, we identified the top 18 genes, which included TNF, MMP9, IL10, BMP4, CXCL8, COL1A1, TLR4, IGF1, MMP2, PPAGR, SOX9, SPP1, SHH, BMP2, NCAM1, TIMP1, ITGB3, and APP (Figure 4c). Using a Venn plot, we determined that four hub genes (SOX9, SPP1, TIMP1, and TLR4) were shared by the turquoise module and analyzed the results obtained from CytoHubba (Figure 4d). We visualized the expression levels of these four genes in the initial RNA sequencing analysis using a heatmap (Figure 4e).
Validation of Hub Genes in Clinical Samples and Rat Models
The qRT-PCR results using RNA extracted from clinical samples provided evidence of significant expression of all four hub genes in the EE group, which aligned with the findings from RNA sequencing analysis (Figure 4e and 5a). Furthermore, ROC analysis based on the qRT-PCR results demonstrated that the mRNA levels of these hub genes held significant diagnostic value for EE (Figure 5b). IHC experiments further validated the differences in protein expression levels of the hub genes in the clinical specimens (Figure 5c).
 |
Figure 5 Validation of hub genes in clinical samples. (a) Quantitative reverse transcription polymerase chain reaction assessment of hub genes. n = 20 per group. Data were presented as mean ± standard deviation. The statistical significance of differences was assessed using the Mann Whitney test (*p < 0.05). (b) Receiver operating characteristic (ROC) curve analyses of hub genes. Abbreviations: AUC, area under the ROC curve. An AUC of 0.9–1.0 is considered to indicate excellent discrimination. (c) Immunohistochemistry staining of hub genes. Scale bar, 50 μm. |
To induce mixed reflux, surgical rat models were created following the methodology outlined in the previous study [20]. Figure 6a displays tissue pictures of esophagus, stomach, and proximal duodenum, as well as H&E staining from the different groups of rats. Histological staining of the reflux groups revealed characteristic manifestations of esophagitis, such as thickening of the basal layer of the mucosa and elongation of papillae. After successfully establishing the reflux rat model, total RNA was extracted from the esophageal mucosa. All the four hub genes showed significantly increased expression in the reflux group (Figure 6b).
 |
Figure 6 Validation of hub genes in experimental rats. (a) Representative macrographic and micrographic images of rat models of reflux. The black arrows show the anastomosis site. Scale bar, 50 μm. (b) Quantitative reverse transcription polymerase chain reaction assessment of hub genes. n = 10 per group. Data were presented as mean ± standard deviation. The statistical significance of differences was assessed using the two-tailed Student’s t-test (*p < 0.05). |
Immune Infiltration Analysis in EE
To explore the immune aspects of EE and facilitate the development of targeted treatment approaches, we conducted an investigation into the immune features of this disease. We collected a total of 2483 immune-related genes from the IMMPORT database and identified 305 of them that exhibited up-regulation in EE after intersecting with our DEGs data (Figure 7a). Furthermore, we ranked these 305 genes in descending order based on their log2 FC and selected the top 20 genes for further analysis. Notably, significant differences in the expression of immune-related genes were observed between the EE and HC groups (Figure 7b).
 |
Figure 7 Immune infiltration analysis. (a) Venn diagram illustrating the overlap between immune-related genes and DEGs. (b) Heatmap presenting the expression levels of the top 20 genes identified in (A). (c) A comparison of 20 different immune cell subsets in different samples using the CIBERSORT algorithm. (d) A histogram illustrating the proportions of 20 different immune cell types in various samples. (e) PCA of immune cell composition in the EE and HC groups. (f) The correlation analysis between the selected hub genes and immune-related genes. (g) The correlation analysis between the selected hub genes and 20 immune cell subsets. *p < 0.05; **p < 0.01; ***p < 0.001. (h–k) Significant associations between hub genes and immune cells were identified. |
Among the 22 immune cell subtypes obtained from the CIBERSORT website, we retained 20 for the subsequent analysis, as none of the 16 samples showed a significant association with the other two subtypes. Using the CIBERSORT algorithm, we further elucidated and compared the infiltration of these 20 immune cell subsets between the two groups. As shown in Figure 7c, substantial variations in the infiltration proportions could be observed. Specifically, the EE group exhibited higher levels of infiltration in B cells, Plasma cells, resting memory CD4 T cells, macrophage M0, and resting mast cells. On the other hand, the HC group demonstrated greater abundance of CD8 T cells, macrophage M2, and resting dendritic cells. The stacked bar graph (Figure 7d) depicted the percentage of each of the 20 immune cell subtypes in every sample, providing a clear visualization of the deviations in immune infiltration features between the two groups. This was further supported by the PCA plot (Figure 7e), which confirmed the distinctions in immune cell composition between the EE and HC groups. The immune infiltration analysis reveals an imbalance in immune cells, suggesting that immune dysregulation plays a crucial role in the development and progression of EE. The analysis of the correlation between the selected hub genes (SOX9, SPP1, TIMP1, TLR4) and immune-related information were displayed in Figure 7f and g. In Figure 7f, multiple synergistic relationships were observed between the hub genes and immune-related genes. Figure 7g presented the correlation results among the hub genes and the 20 immune cell subsets, with significance thresholds set at |R| > 0.4 and p < 0.01. Upon examination of the results, it was found that SOX9 exhibited a negative correlation with CD8 T cells (R = −0.66, p = 0.0056), while showing a positive correlation with resting memory CD4 T cells (R = 0.86, p = 1.6e-05) (Figure 7h and i). SPP1 displayed a positive correlation with naïve B cells (R = 0.71, p = 0.002) (Figure 7j). TIMP1 demonstrated a negative correlation with resting dendritic cells (R = −0.86, p = 1.6e-05) (Figure 7k). These correlations were statistically significant and met the predetermined thresholds.
Drug Prediction for EE
The top ten chemical compounds displaying the most negative connectivity scores were selected as potential medications for EE based on the analysis using the CMap (Table S3). It was predicted that small-molecule compounds, such as aldose reductase inhibitors, immunosuppressants, and GABA receptor agonists, may possess potential therapeutic effects on EE. The 3D structural models illustrating these ten chemical compounds were visualized in Figure 8a. To forecast the binding affinity and interaction of the potential drugs with their respective targets, molecular docking analysis was conducted relying on the evaluation of the lowest calculated binding energy using AutoDock Vina (Figure 8b–e). Additionally, pharmacokinetic properties of the drugs were obtained using the ADMET descriptors algorithm protocol (Table S4). All four compounds demonstrated extensive absorption within the human intestine. Notably, Ponalrestat exhibited relatively limited capability to penetrate the blood-brain barrier compared to the other three compounds, and all drugs displayed suboptimal distribution properties in the central nervous system. With the exception of BRD-K88742110, the remaining compounds revealed potential hepatotoxicity, while only AC-55649 indicated the potential for skin sensitization.
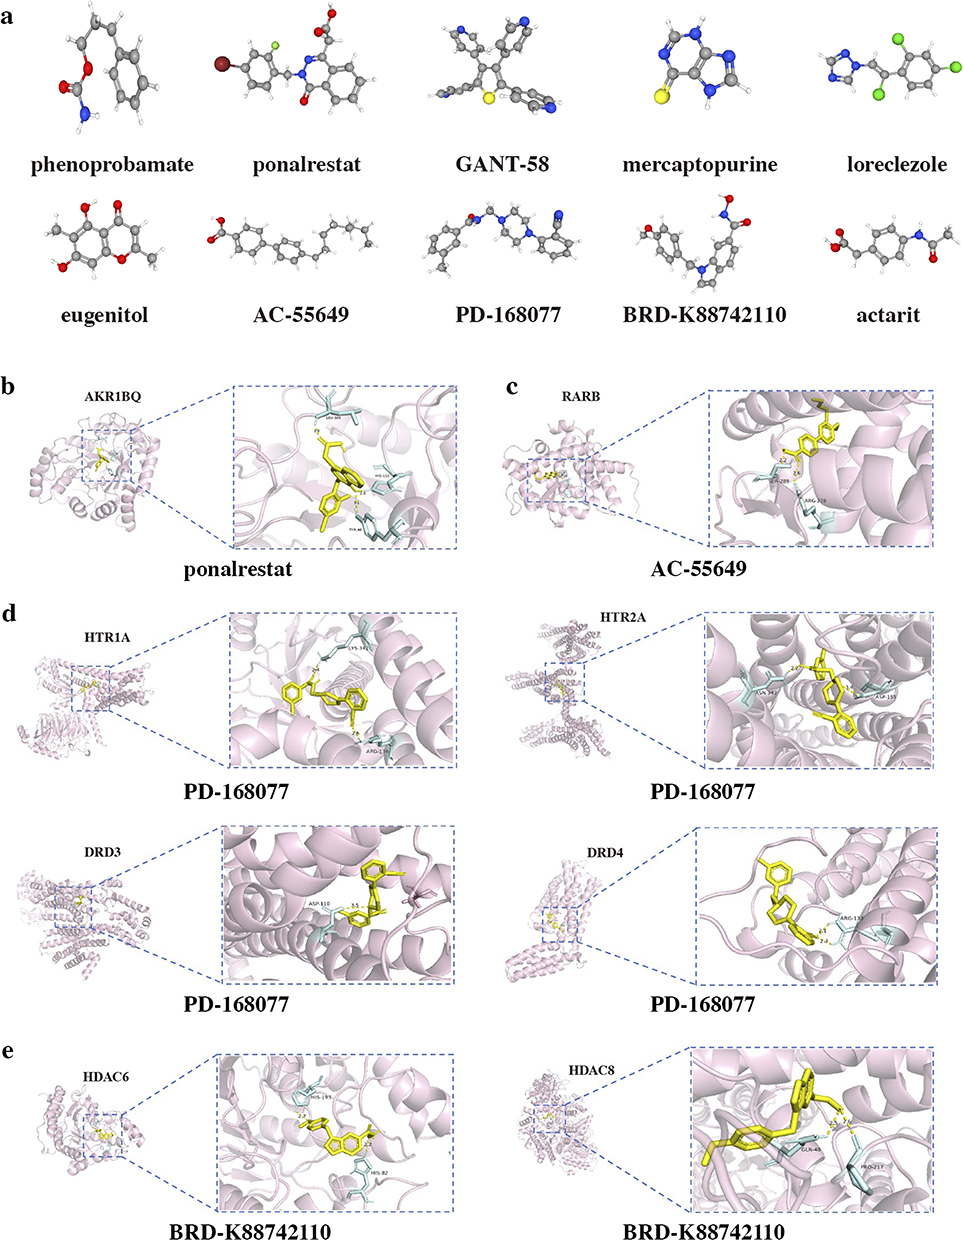 |
Figure 8 Drug prediction and molecular docking. (a) The structure of predicted drugs. (b) Molecular docking analyses for ponalrestat with target proteins AKR1BQ. (c) Molecular docking analyses for AC-55649 with target proteins RARB. (d) Molecular docking analyses for PD-168077 with target proteins HTR1A, HTR2A, DRD3, and DRD4, respectively. (e) Molecular docking analyses for BRD-K88742110 with target proteins HDAC6, and HDAC8, respectively. |
Discussion
EE is a complex disorder characterized by diverse symptoms and a multifaceted etiology. A real-world study has shown that both patients and physicians express dissatisfaction with the current treatment options for EE,21 which imposes a substantial economic burden on society.22 The management of this chronic recurrent disease necessitates personalized approaches tailored to each individual case.22 However, the lack of available transcriptional profiles considerably hampers efforts to comprehend its underlying mechanisms and devise precise treatment strategies. This study marks the inaugural unveiling of the transcriptional landscape of EE. The findings of this study contribute to a deeper understanding of the molecular mechanisms underlying the pathogenesis of EE. By identifying the hub genes and their overexpression in both clinical samples and experimental rats, the study provides valuable insights into the molecular alterations that occur in EE.
Refractoriness and recurrence pose challenging issues for EE.21 The rates of proton pump inhibitor – refractory GERD reported in different studies vary.23 While some argue that NERD forms a substantial portion of refractory GERD cases,5 a meta-analysis indicates that EE and truly NERD (defined by both endoscopy and 24-h MII-pH monitoring) have similar response rates to antisecretory therapy.24 Therefore, there is an unmet need for the treatment of EE. It is worthy to comprehensively explore the gene expression profile of EE in order to delve deeper into its molecular mechanisms and find solutions for difficult–to–treat cases.
Clinical history, questionnaires, and the response to antisecretory therapy alone are inadequate for definitively diagnosing GERD, often necessitating further investigations.25 The Lyon Consensus surpasses previous classifications by proposing parameters for diagnosing GERD using endoscopy and pH-metry (or pH-impedance monitoring).25 The inclusion criteria for this study adhere to these parameters. Moreover, the Lyon Consensus emphasizes that low-grade EE may have a physiological basis and exhibits a robust response to acid suppression therapy, with minimal risk of progressing to Barrett’s esophagus.26 Consequently, patients with LA-A or LA-B esophagitis were excluded, while those with severe-grade EE (LA-C or LA-D) were included.
The sequencing results indicate that EE and NERD represent distinct diseases rather than merely different manifestations within the GERD spectrum, based on comparison with our previous work.10 Partially consistent with prior research, the cytokines IL-1β, IL-8, IL-33, and MCP-1 (CCL2) exhibited notable increases in the EE group.27,28 However, contrary to earlier findings, we did not detect differential expressions of RANTES (CCL5) or IL-6 in these two groups.27 Moreover, we validated the activation of various proteins involved in crucial signaling pathways, such as the MAPK, AKT, and NF-κB pathways.
To comprehend the process of EE initiation and development, we conducted GO and KEGG enrichment analysis for DEGs. This analysis revealed that the complement activation pathway plays a pivotal role in EE progression. Furthermore, GSEA analysis highlighted the significant involvement of chemokine signaling. Although immune cells are considered the primary contributors to esophageal inflammation, they are not the sole culprits. Exposed to stomach contents, including pepsin, trypsin, acid, and the esophageal microbiome, the epithelial cells of the esophagus become the primary instigators of inflammation. These cells generate and release proinflammatory mediators, such as proinflammatory cytokines, reactive oxygen species, and platelet-activating factor. These mediators not only exacerbate epithelial damage but also activate mesenchymal cells. Activation of epithelial cells by any external stimulus results in the upregulation of molecules and mediators that facilitate communication with immune cells and amplify the immune response. This reaction involves the upregulation of adhesion molecules and the release of additional cytokines and chemoattractants, which perpetuate inflammation through a self-sustaining loop. However, comprehensive further research is necessary to elucidate the precise mechanisms underlying the immune response in EE. Our immune infiltration analysis provides additional evidence and insights for the study of immune mechanisms of EE.
In addition to performing the DEG analysis, we utilized WGCNA and CytoHubba from Cytoscape to gain further insights into the hub genes associated with genotype-specific modules. Among the identified hub genes, SOX9 stood out as it exhibited the most significant difference and displayed highest diagnostic value. This finding was further validated in a surgical reflux rat model. Immune infiltration analysis showed that SOX9 was significantly associated with resting memory CD4 T cells and CD8 T cells in EE mucosa. SOX9 is a transcription factor commonly found in Paneth cells and potential stem cells of intestinal crypts.29 It has been established as a vital marker for the intestinal epithelium. A previous study has demonstrated that the activation of DMBT1, a human columnar cell factor found in Barrett’s epithelium, is regulated by SOX9.30 Furthermore, the expression of sonic hedgehog in the mouse esophageal epithelium led to the expression of SOX9 in epithelial cells and columnar cytokeratin.30 Comprehensive investigations examining the role of SOX9 in EE are warranted. Toll-like receptors play a pivotal role as transmembrane receptors in the human innate immune system.31 These receptors are expressed not only in immune cells but also in non-immune cells. Our bioinformatic analysis revealed TLR4 as one of the identified hub genes for EE. Activation of TLR4 is thought to exert a substantial influence on inflammatory signaling pathway in the digestive tract.32 Inhibition of the TLR4/NFκB signaling pathway is regarded as a logical approach for the development of preventive and therapeutic drugs targeting intestinal inflammation.32 Nevertheless, the precise mechanisms by which TLR4, as well as other identified hub genes, contribute to GERD remain enigmatic. The roles of hub genes in EE necessitate additional functional experimental validation due to the study’s limited sample size. Furthermore, leveraging the advancements in single-cell sequencing technology, our research team will persist in performing single-cell multi-omics research to elucidate the specific roles and mechanisms of the mentioned hub genes in EE.
The GABA(B) receptor agonist baclofen has been applied for the treatment of GERD due to its significant inhibition of transient lower esophageal sphincter relaxations.33 In CMap analysis, loreclezole, another GABA receptor agonist, was predicted for the treatment of EE. The immunosuppressant mercaptopurine, which has the potential to modulate the exaggerated immune response and reduces inflammation processes is also predicted to be beneficial in the treatment of EE.34 These candidate drugs were predicted based on gene expression profiles, highlighting the importance of exploring gene expression patterns for the development of targeted therapeutic options for GERD.
GERD encompasses a variety of syndromes that are characterized by a diverse range of pathophysiological factors. As a result, the idea of a universally applicable therapeutic approach is rendered ineffective. Evidently, GERD demonstrates significant variability, emphasizing the necessity to comprehensively understanding its gene expression profile for precise management. Therefore, we implemented transcriptomic sequencing and integrated bioinformatic analysis to facilitate comprehensive research on GERD.
Conclusion
A thorough analysis was conducted to investigate the transcriptomic study on EE. Four hub genes, namely SOX9, SPP1, TIMP1, and TLR4, associated with EE were identified and validated in both clinical samples and rat models. Notably, immune-related genes of EE were also identified, and the study further delved into immune infiltration and potential drug candidates for EE. This study has the potential to offer novel insights into the gene expression patterns of EE, paving the way for further research endeavors and facilitating the development of precise therapeutic strategies for treating EE.
Data Sharing Statement
The datasets utilized and/or analyzed during the current study can be obtained from the corresponding authors upon reasonable request. Raw data of the RNA sequencing were deposited at GEO (www.ncbi.nlm.nih.gov/geo, GSE190027).
Ethics Approval and Consent to Participate
For patient samples, we obtained written informed consent from each patient and received approval from the hospital ethics committee (No.2021-380). The study was conducted following the guidelines outlined in the Declaration of Helsinki.
Acknowledgments
We sincerely appreciate the superb assistance from the Central Laboratory of Ruijin Hospital and the core facility supported by Basic Medical Sciences, Shanghai Jiao Tong University School of Medicine.
Author Contributions
All authors made a significant contribution to the work reported, whether that is in the conception, study design, execution, acquisition of data, analysis and interpretation, or in all these areas; took part in drafting, revising or critically reviewing the article; gave final approval of the version to be published; have agreed on the journal to which the article has been submitted; and agree to be accountable for all aspects of the work.
Funding
This work was supported by the National Natural Science Foundation of China (grant numbers 81700492, 81702899, and 81970480).
Disclosure
The authors report no conflicts of interest in this work.
References
1. Katz PO, Dunbar KB, Schnoll-Sussman FH, Greer KB, Yadlapati R, Spechler SJ. ACG clinical guideline for the diagnosis and management of gastroesophageal reflux disease. Am J Gastroenterol. 2022;117(1):27–56.
2. Richter JE, Rubenstein JH. Presentation and epidemiology of gastroesophageal reflux disease. Gastroenterology. 2018;154(2):267–276. doi:10.1053/j.gastro.2017.07.045
3. Fass R. Gastroesophageal Reflux Disease. N Engl J Med. 2022;387(13):1207–1216. doi:10.1056/NEJMcp2114026
4. Eusebi LH, Ratnakumaran R, Yuan Y, Solaymani-Dodaran M, Bazzoli F, Ford AC. Global prevalence of, and risk factors for, gastro-oesophageal reflux symptoms: a meta-analysis. Gut. 2018;67(3):430–440. doi:10.1136/gutjnl-2016-313589
5. Fass R, Boeckxstaens GE, El-Serag H, Rosen R, Sifrim D, Vaezi MF. Gastro-oesophageal reflux disease. Nat Rev Dis Primers. 2021;7(1):55. doi:10.1038/s41572-021-00287-w
6. Katzka DA, Pandolfino JE, Kahrilas PJ. Phenotypes of gastroesophageal reflux disease: where Rome, Lyon, and Montreal meet. Clin Gastroenterol Hepatol. 2020;18(4):767–776. doi:10.1016/j.cgh.2019.07.015
7. Lundell LR, Dent J, Bennett JR, et al. Endoscopic assessment of oesophagitis: clinical and functional correlates and further validation of the Los Angeles classification. Gut. 1999;45(2):172–180. doi:10.1136/gut.45.2.172
8. Dunbar KB, Agoston AT, Odze RD, et al. Association of acute gastroesophageal reflux disease with esophageal histologic changes. JAMA. 2016;315(19):2104–2112. doi:10.1001/jama.2016.5657
9. Ustaoglu A, Nguyen A, Spechler S, Sifrim D, Souza R, Woodland P. Mucosal pathogenesis in gastro-esophageal reflux disease. Neurogastroenterol Motil. 2020;32(12):e14022. doi:10.1111/nmo.14022
10. Zhao Y, Ma T, Zou D. Identification of Unique transcriptomic signatures and hub genes through RNA sequencing and integrated WGCNA and PPI network analysis in nonerosive reflux disease. J Inflamm Res. 2021;14:6143–6156. doi:10.2147/jir.S340452
11. Langfelder P, Horvath S. WGCNA: an R package for weighted correlation network analysis. BMC Bioinf. 2008;9:559.
12. Bindea G, Mlecnik B, Hackl H, et al. ClueGO: a Cytoscape plug-in to decipher functionally grouped gene ontology and pathway annotation networks. Bioinformatics. 2009;25(8):1091–1093. doi:10.1093/bioinformatics/btp101
13. Zhou Y, Zhou B, Pache L, et al. Metascape provides a biologist-oriented resource for the analysis of systems-level datasets. Nat Commun. 2019;10(1):1523. doi:10.1038/s41467-019-09234-6
14. Szklarczyk D, Kirsch R, Koutrouli M, et al. The STRING database in 2023: protein-protein association networks and functional enrichment analyses for any sequenced genome of interest. Nucleic Acids Res. 2023;51(D1):D638–D646. doi:10.1093/nar/gkac1000
15. Shannon P, Markiel A, Ozier O, et al. Cytoscape: a software environment for integrated models of biomolecular interaction networks. Genome Res. 2003;13(11):2498–2504. doi:10.1101/gr.1239303
16. Chen H, Hu YH, Fang Y, et al. Nrf2 deficiency impairs the barrier function of mouse oesophageal epithelium. Gut. 2014;63(5):711–719. doi:10.1136/gutjnl-2012-303731
17. Bhattacharya S, Dunn P, Thomas CG, et al. ImmPort, toward repurposing of open access immunological assay data for translational and clinical research. Sci Data. 2018;5:180015. doi:10.1038/sdata.2018.15
18. Newman AM, Liu CL, Green MR, et al. Robust enumeration of cell subsets from tissue expression profiles. Nat Methods. 2015;12(5):453–457. doi:10.1038/nmeth.3337
19. Lamb J, Crawford ED, Peck D, et al. The Connectivity Map: using gene-expression signatures to connect small molecules, genes, and disease. Science. 2006;313(5795):1929–1935. doi:10.1126/science.1132939
20. Pires DE, Blundell TL, Ascher DB. pkCSM: predicting small-molecule pharmacokinetic and toxicity properties using graph-based signatures. J Med Chem. 2015;58(9):4066–4072. doi:10.1021/acs.jmedchem.5b00104
21. Vaezi MF, Brunton S, Mark Fendrick A, et al. Patient journey in erosive oesophagitis: real-world perspectives from US physicians and patients. BMJ Open Gastroenterol. 2022;9(1):e000941. doi:10.1136/bmjgast-2022-000941
22. Katzka DA, Kahrilas PJ. Advances in the diagnosis and management of gastroesophageal reflux disease. BMJ. 2020;371:m3786. doi:10.1136/bmj.m3786
23. Fock KM, Talley N, Goh KL, et al. Asia-Pacific consensus on the management of gastro-oesophageal reflux disease: an update focusing on refractory reflux disease and Barrett’s oesophagus. Gut. 2016;65(9):1402–1415. doi:10.1136/gutjnl-2016-311715
24. Weijenborg PW, Cremonini F, Smout AJ, Bredenoord AJ. PPI therapy is equally effective in well-defined non-erosive reflux disease and in reflux esophagitis: a meta-analysis. Neurogastroenterol Motil. 2012;24(8):747–757. doi:10.1111/j.1365-2982.2012.01888.x
25. Ghisa M, Barberio B, Savarino V, et al. The Lyon consensus: does it differ from the previous ones? J Neurogastroenterol Motil. 2020;26(3):311–321. doi:10.5056/jnm20046
26. Gyawali CP, Kahrilas PJ, Savarino E, et al. Modern diagnosis of GERD: the Lyon Consensus. Gut. 2018;67(7):1351–1362. doi:10.1136/gutjnl-2017-314722
27. Shan J, Oshima T, Muto T, et al. Epithelial-derived nuclear IL-33 aggravates inflammation in the pathogenesis of reflux esophagitis. J Gastroenterol. 2015;50(4):414–423. doi:10.1007/s00535-014-0988-1
28. Isomoto H, Wang A, Mizuta Y, et al. Elevated levels of chemokines in esophageal mucosa of patients with reflux esophagitis. Offi J Am Coll Gastroenterol. 2003;98(3):551–556. doi:10.1111/j.1572-0241.2003.07303.x
29. Bastide P, Darido C, Pannequin J, et al. Sox9 regulates cell proliferation and is required for Paneth cell differentiation in the intestinal epithelium. J Cell Biol. 2007;178(4):635–648. doi:10.1083/jcb.200704152
30. Wang DH, Clemons NJ, Miyashita T, et al. Aberrant epithelial-mesenchymal Hedgehog signaling characterizes Barrett’s metaplasia. Gastroenterology. 2010;138(5):1810–1822. doi:10.1053/j.gastro.2010.01.048
31. Gay NJ, Gangloff M, W AN. Toll-like receptors as molecular switches. Nat Rev Immunol. 2006;6(9):693–698. doi:10.1038/nri1916
32. Kordjazy N, Haj-Mirzaian A, Haj-Mirzaian A, et al. Role of toll-like receptors in inflammatory bowel disease. Pharmacol Res. 2018;129:204–215. doi:10.1016/j.phrs.2017.11.017
33. Yadlapati R, Gyawali CP, Pandolfino JE. AGA clinical practice update on the personalized approach to the evaluation and management of GERD: expert review. Clin Gastroenterol Hepatol. 2022;20(5):984–994e1. doi:10.1016/j.cgh.2022.01.025
34. Korelitz BI, Sachar DB, Schneider J. Full Potential of 6-mercaptopurine in IBD may remain untapped. Am J Gastroenterol. 2020;115(12):2109–2110. doi:10.14309/ajg.0000000000000769
 © 2024 The Author(s). This work is published and licensed by Dove Medical Press Limited. The
full terms of this license are available at https://www.dovepress.com/terms.php
and incorporate the Creative Commons Attribution
- Non Commercial (unported, 3.0) License.
By accessing the work you hereby accept the Terms. Non-commercial uses of the work are permitted
without any further permission from Dove Medical Press Limited, provided the work is properly
attributed. For permission for commercial use of this work, please see paragraphs 4.2 and 5 of our Terms.
© 2024 The Author(s). This work is published and licensed by Dove Medical Press Limited. The
full terms of this license are available at https://www.dovepress.com/terms.php
and incorporate the Creative Commons Attribution
- Non Commercial (unported, 3.0) License.
By accessing the work you hereby accept the Terms. Non-commercial uses of the work are permitted
without any further permission from Dove Medical Press Limited, provided the work is properly
attributed. For permission for commercial use of this work, please see paragraphs 4.2 and 5 of our Terms.