")
Back to Journals » Journal of Multidisciplinary Healthcare » Volume 18
Uncovering Diagnostic Correlations Between Traditional Chinese and Western Medicine Using Instrumental Variable Models in Cardiometabolic Patients: Evidence from 1.2 Million Records
Authors Zhou J , Zhou S, Chen H, Chen X, Zou G, Gao Y, Jing S, Bishai DM , Li J, Zhong A , Liu Z, Liu A
Received 20 March 2025
Accepted for publication 18 June 2025
Published 5 July 2025 Volume 2025:18 Pages 3827—3841
DOI https://doi.org/10.2147/JMDH.S524976
Checked for plagiarism Yes
Review by Single anonymous peer review
Peer reviewer comments 3
Editor who approved publication: Dr Pavani Rangachari
Jingjing Zhou,1,2 Shangcheng Zhou,3 Huijing Chen,1 Xiyin Chen,2 Guanyang Zou,1 Yulin Gao,4 Shangwen Jing,5,6 David Makram Bishai,2 Jinxin Li,7 Ailin Zhong,8 Zhenyuan Liu,2 Ailing Liu1
1School of Public Health and Management, Guangzhou University of Chinese Medicine, Guangzhou, Guangdong, People’s Republic of China; 2School of Public Health, Li Ka Shing Faculty of Medicine, The University of Hong Kong, Hong Kong Special Administrative Region, People’s Republic of China; 3School of Humanities and Management, Zhejiang Chinese Medical University, Hangzhou, Zhejiang, People’s Republic of China; 4School of Nursing, Southern Medical University, Guangzhou, Guangdong, People’s Republic of China; 5Science and Technology Innovation Center, Guangzhou University of Chinese Medicine, Guangzhou, Guangdong, People’s Republic of China; 6School of Chinese Medicine, The University of Hong Kong, Hong Kong Special Administrative Region, People’s Republic of China; 7The Second Affiliated Hospital of Guangzhou University of Chinese Medicine, Guangdong Provincial Hospital of Chinese Medicine, Guangzhou, Guangdong, People’s Republic of China; 8Office of International Exchange and Cooperation, Guangzhou University of Chinese Medicine, Guangzhou, Guangdong, People’s Republic of China
Correspondence: David Makram Bishai, School of Public Health, Li Ka Shing Faculty of Medicine, The University of Hong Kong, G/F, Patrick Manson Building (North Wing), 7 Sassoon Road, Pokfulam, Hong Kong, People’s Republic of China, Tel + 852 3917 9916, Email [email protected]
Background: Little is known about the relationship between syndromes in Traditional Chinese Medicine (TCM) and chronic diseases coded by Western Medicine (WM). TCM hospitals where both WM and TCM are practiced offer an opportunity to assess this relationship. TCM, based on syndrome differentiation and treatment, may aid in guiding treatment and predicting length of stay and healthcare costs. However, inconsistent coding of TCM syndromes arises due to variations in diagnostic interpretation, subjective assessment, and lack of standardized coding practices. The objective was to assess the correlation between WM diagnoses and TCM syndromes, accounting for diagnostic miscoding in the data.
Methods: We examined discharge data from 1,218,224 records for patients aged 45 and above, diagnosed with cardiometabolic diseases and admitted to TCM hospitals between 2017 and 2022, stays ranging from 24-hours to 90 days. Latent class analysis (LCA) was used to measure the correlation between TCM syndromes and WM. To address potential diagnostic errors, we applied bivariate probit models with instrumental variable (IV).
Results: There were 580,698 (47.67%) records for males, while 989,702 (81.24%) records from Tertiary-A hospitals. The LCA and probit models revealed that TCM syndrome diagnoses had a high ratio of noise to signal. After correcting for diagnostic errors, significant associations were found between WM diagnoses and TCM syndromes. Notably, diabetes mellitus was strongly associated with syndrome/pattern of qi and yin deficiency (coefficient = 2.711); cerebrovascular diseases showed strong associations with syndrome/pattern of qi deficiency with blood stasis (coefficient = 2.433) and syndrome/pattern of wind and phlegm blocking collaterals (coefficient = 3.176). All patterns had strong marginal effects (P < 0.001).
Conclusion: This large-scale study quantitatively maps the relationship between TCM and WM diagnoses. It introduces a new statistical approach to understanding the correlation between these two diagnostic systems, offering insights into integrated medicine for secondary prevention.
Keywords: cardiometabolic diseases, western medicine, TCM syndromes, instrumental variable methods, errors in variable
Background
Current research on chronic diseases is mostly based on disease classifications of Western medicine (WM).1–3 By cross-coding leading patterns of WM with Traditional Chinese Medicine (TCM) syndromes, one can examine patterns of alignment between the TCM practitioners’ syndromes and the WM syndromes. These patterns may help in clinical practice because they are the basis of syndrome differentiation and treatment, which can help enabling personalized integrative care, predicting disease severity as measured by length of stay or medical costs and improving cross-disciplinary training.4
TCM has a unique theoretical system in the treatment and prevention of diseases. Previous studies showed that TCM constitutions’ identification can divide the population into nine types, eg1) Ping-he (balance), 2) Qi-xu (qi deficiency), 3) Yang-xu (yang deficiency), 4) Yin-xu (yin deficiency), 5) Tan-shi (phlegm and dampness), 6) Shi-re (dampness and heat), 7) Xue-yu (blood stasis), 8) Qi-yu (qi depression) and 9) Te-bing (allergic).5 Constitutions play an important role in improving clinical treatment for related diseases.5,6 Separate from TCM constitutions are TCM syndromes, which are classified according to etiology, pathogenesis, and clinical manifestations and are the patterns or sums of symptoms of a disease at a certain stage in diseases development process.7 In TCM hospitals, patients with the same WM diagnosis will have different TCM syndromes because of different etiology, location, nature, and the relationship between pathogenic factors and the body’s resistance in the disease.8,9 TCM doctors’ efforts in syndrome differentiation guide treatment.7 Patients in TCM hospitals in China are treated according to the combination of their WM classified diseases and TCM syndromes using a holistic consideration. The diagnostic efforts of dual WM and TCM diagnoses routinely generates a large quantity of data about each patient. To date, there have been few statistical efforts to find the cross-correlation patterns between the TCM and Western traditions.8,10,11
Finding correlations in the distribution of WM diseases with TCM syndromes can provide more evidence for the effective implementation of integrated TCM and WM and provide new ideas for secondary prevention. A study in Hunan province and Hong Kong derived eight TCM pattern differentiation rules for functional dyspepsia patients, which provide new evidence for disease diagnosis and prevention.12 Although there have been studies of the correlation between TCM syndromes and diseases, most literatures used questionnaires or data from one department in the hospital.8,13 The healthcare records data in TCM institutions maintain dual WM codes and TCM codes for each patient. However, the TCM syndromes distribution may vary because of spatial differences of topography and climate where the patient is situated that are included in TCM diagnoses.12 Differences in medical norms and localized medical practice cultures may also affect doctors’ habits.14 A study15 from Shanghai showed that the TCM syndromes diagnosis were inconsistent because of variations in diagnostic interpretation across different schools of TCM, subjective syndrome assessment, or lack of standard enforcement in coding practices, etc. Therefore, we aimed to use the total TCM records in a city from 2017 to 2022 to find the correlation between WM disease diagnosis and TCM syndrome diagnosis in cardiometabolic diseases, which have the highest burden and similar risk factors.1,16,17 To reduce the inconsistencies in TCM syndrome classification, we explored the use of Latent Class Analysis (LCA) to reveal the correlation between WM and TCM by treating each diagnosis as a latent variable.18 We also used bivariate probit models with instrumental variables (IV)19 to reduce the endogeneity bias and reduce measurement error so as to reveal the correlations. The ultimate goal is to provide evidence that the dual coding offers patients benefits in the form of secondary prevention derived by integrated medicine.
Methods
Data Sources
De-identified hospitalization data were obtained from the Structured Query Language (SQL) database of healthcare in a city of South China. Eligible data came from hospitalization records for inpatients who had been admitted to one of 25 different TCM institutions from 2017 to 2022. Inclusion criteria were records for patients aged 45 or above with length of stay for at least 24-hours and no more than 90 days. Patients had to have been diagnosed with hypertension diseases (HTN), type 2 diabetes mellitus (DM), disorders of lipoprotein metabolism (DLM), coronary heart diseases (CHD), heart failure (CHF), cerebrovascular diseases (CVD). These conditions corresponded to ICD-10 codes (I10-I13, I20-I25, I50, I60-I66, I69, E11, E12, E14, E78).
In order to employ the instrumental variable method, a set of exogenous predictor variables was needed. These instrumental variables included the hospital’s observed proportion of each TCM diagnosis by gender. We also used air quality, temperature, Relative Humidity (RH), and day of the week of the admission as covariate variables. Air quality data came from the National urban air quality real-time release platform of China (https://air.cnemc.cn:18007/). Temperature data came from the National Climatic Data Center (NCDC, https://www.ncei.noaa.gov/pub/data/noaa/isd-lite/), part of the National Oceanic and Atmospheric Administration (NOAA). RH came from the following formula.20

where Dp means the average dew point temperature (degree Celsius), T means the average temperature (degree Celsius).
Data Analysis
We used R software21 version 4.4.1 to conduct data cleaning, database administration, descriptive analysis, and LCA. We used Stata MP22 version 18 to conduct the Wilcox chi-squared test, Kruskal–Wallis’s chi-squared test, probit analysis, and bivariate probit analysis.
Tidyverse package23 in R software was used to clean the data and select the records with the diagnosis of cardiometabolic diseases. The flow chart of data cleaning is shown in Figure 1. Then, we standardized the TCM syndromes (Supplementary Table 1) entered by the TCM practitioners in each record according to the terminology released in 1995 (GB1995) and revised in 2021 (GB2021)24 and by consulting the doctors in TCM hospitals.
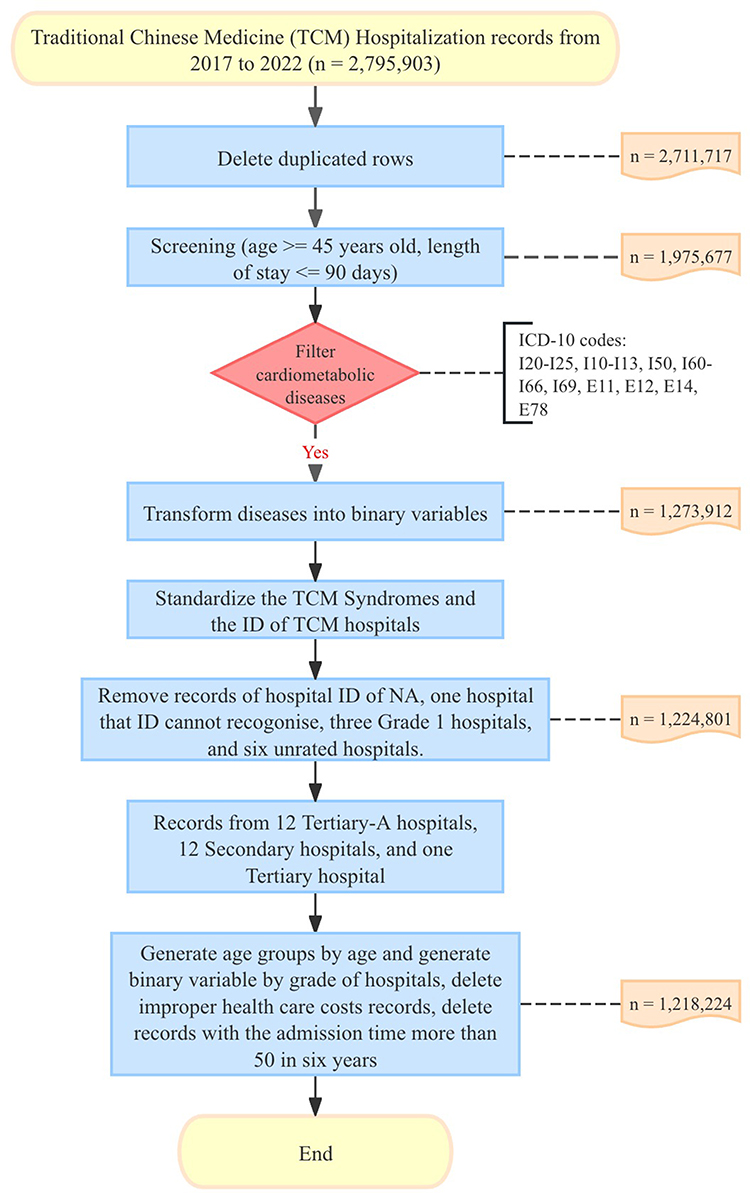 |
Figure 1 Flow chart of data cleaning. |
We deleted improper records of healthcare costs by reference to a table of basic healthcare costs and remove the records of 69 patients who had each been admitted more than 50 times. As the amount of TCM syndromes missing data was relatively small (177 missing data in 1,218,224 records) and no meaningful way to impute the missing values was available based on the existing records, we used the removing setting in the bivariate probit analysis. Descriptive statistical analysis was used for general information. Numbers and percentages were used to describe categorical data. The mean ± sd was used to summarize continuous variables that followed a normal distribution. The median and interquartile range were used for variables that did not follow a normal distribution.
We firstly used the LCA method25 to measure the correlation between TCM syndromes and WM and divide the records into different classes using the poLCA package. We analyzed the latent class for pure WM diagnoses, pure WM diagnoses with 18 TCM syndromes, WM diagnoses and added the TCM syndromes one by one according to the proportion and suggestion from TCM doctors. The overall model fits were reported with Akaike information criterion (AIC), Bayesian information criterion (BIC), Likelihood ratio (G^2), Chi-square goodness of fit (X^2), and P value. We set the maximum number of iterations = 3000, tolerance value = 1e-10, na.rm = FALSE, times of model is estimated (nrep) = 10. P value was determined using the likelihood ratio test, which tests the improvement in fit of a k class model with k–1 class model. We searched for classifications in which adding TCM diagnoses improved the AIC, BIC, and G^2 of the overall classification. We also used an ordinary probit model26 in Stata to assess the correlation between WM and TCM syndromes.
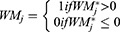
We were concerned that the TCM syndromes might have suffered from miscoding leading to the well-known errors in the variables (EIV) problem.27 When independent variables are measured with imprecision, coefficients are biased towards zero because noise dominates signal in the data. A well-known solution to EIV bias is to use a set of instrumental variables Z that would be correlated with the TCM syndromes (used here as independent variables) directly, but not with the dependent variables (ie the WM diagnoses). By predicting error miscoded TCM syndromes from the instruments Z, much of the noise can be removed provided there is a good fit in the instrumental variable step. Because the WM diagnosis and TCM syndromes were all dichotomous, we used a bivariate probit model.27–29 The bivariate probit model is a joint model for two binary dependent variables that finds the correlation index from one latent variable to two latent variables,29 and the formulas for two latent variables are presented as30


Where j is the WM diagnosis from 1 to 6, k is the TCM syndrome diagnosis from 1 to 20,  and
and  are joint normal with means were zero, variances were one, and correlation rho
  . The bivariate probit model outcome formulas were30
The bivariate probit model is estimated as a joint system using maximum likelihood. Notice that TCM is an independent variable in Equation [1a] and a dependent variable in Equation [1b]. The Z variables that predict TCM in Equation [1b] are excluded in [1a] and serve to reduce the noise in the raw measures of TCM. For instruments, we chose to use the hospital’s observed proportion of each TCM diagnosis by gender. We defend the exclusion of these Z variables from [1a] by asserting that TCM hospitals may have a local culture with peer effects that make certain TCM syndromes more or less common.
The marginal effects were calculated for the joint probability by the formula

Where  means the expected value of the dependent variable WMj,
  means the change in the dependent variable TCMk.
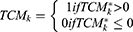
The covariate variables (x variables) included were age group, the daily mean value of carbon monoxide (CO), the daily mean value of ozone (O3), daily average temperature (TEMP), dew point temperature (DEWP), admission time from 2017 to 2022, day of week, holiday or not, RH, and PM2.5. The overall fit of the models was estimated with coefficients, marginal effects, Wald χ2 and P value. Then, we compared the correlations between WM and TCM, and chose the WM-TCM patterns. The rho statistic in a bivariate probit model assesses the correlation between error terms in [1a] and [1b]. If rho is statistically no different from zero, then the bivariate model offers no gain in statistical efficacy and the model could just as well have been estimated as separate equations. Essentially rho = 0 is consistent with the null hypothesis of no EIV in the coding of TCM diagnoses. For bivariate probit models, there is no method to test its overidentification. We applied a linear probability two-stage model to the dichotomous diagnostic data in order to perform an overidentification test using estat overid after running the model with ivreg2, and the weak instrument test was used to evaluate the explanatory power of the instrumental variables at the first stage.31 The modeling sequence for statistical analysis was shown in Figure 2.
 |
Figure 2 Flow diagram of the modeling sequence for statistical analysis. |
Results
Basic Information of Hospitalized Records
Among 1,975,677 TCM hospitalized records with patients aged 45 or above and length of stay in hospitals from 24 hours to 90 days, there were 1,273,912 (64.48%) records with diagnosis of cardiometabolic diseases from 2017 and 2022. There were 1,218,224 episodes in total with 580,698 (47.67%) for males and 637,526 (52.33%) for females, while 989,702 (81.24%) were from Tertiary-A hospitals and 228,522 (18.77) were not from Tertiary-A hospitals. The average age of subjects was 69.42 ± 12.106 for all, 68.14 ± 11.957 for males, and 70.59 ± 12.132 for females. Among all the cardiometabolic diseases, patients with HTN had the most records (833,881, 68.45%), followed by DM (403,139, 33.09%), CVD (395,835, 32.49%), CHD (279,845, 22.97%), DLM (256,600, 20.98%), CHF (140,323, 11.52%). Among all the TCM syndromes, the syndrome/pattern of qi stagnation and blood stasis (QSBS, 119,345, 9.74%) had the most records, followed by the syndrome/pattern of qi deficiency with blood stasis (QDBS, 105,976, 8.65%), syndrome/pattern of dual deficiency of liver and kidney (DDLK, 104,079, 8.50%). Shown in Table 1.
 |
Table 1 Basic Information of 1,218,224 Hospitalized Records |
The Leading Traditional Chinese Medicine Syndromes in Each Cardiometabolic Disease
The leading TCM syndromes in cases with the Western medicine diagnosis of DLM was QSBS (27,405, 2.25%), followed by the syndrome/pattern of qi deficiency with phlegm binding (QDPB, 23,968, 1.97%) and DDLK (21,621, 1.77%). The leading TCM syndromes when the Western medicine diagnosis was HTN was also QSBS (80,255, 6.59%), followed by QDBS (77,833, 6.39%) and DDLK (76,392, 6.27%). The leading TCM syndromes in diabetes mellitus were QDBS (35,591, 2.92%), followed by QSBS (34,770, 2.85%) and DDLK (31,930, 2.62%). The leading TCM syndromes in heart failure were QDBS (15,727, 1.29%), followed by QDPB (7,863, 0.65%) and syndrome/pattern of dual deficiency of spleen and kidney (DDSK, 6,609, 0.54%). The leading TCM syndromes in CHD were QDPB (34,043, 2.79%), followed by QDBS (27,949, 2.29%) and QSBS (20,483, 1.68%). The leading TCM syndromes in CVD were QDBS (75,909, 6.23%), followed by syndrome/pattern of phlegm and stasis obstructing the collaterals (PSOC, 34,904, 2.87%) and QDPB (28,681, 2.35%). The proportion of leading TCM syndromes in different cardiometabolic diseases is shown in Table 2.
 |
Table 2 The Leading Traditional Chinese Medicine Syndromes in Cardiometabolic Diseases |
Correlations Between Western Medicine Diagnosis and TCM Syndromes Diagnosis
The LCA models showed that the six diseases model had the best fit statistics. Adding the TCM syndrome data did nothing to improve the statistical fit of the classification. This is consistent with our concern that the TCM syndrome data had a high ratio of noise to signal. See Supplementary Table 2–Table 21.
The probit models and bivariate probit models with IV showed that almost all absolute values of ordinary probit coefficients were smaller than coefficients from bivariate probit models with IV, except that the coefficient between CHD and syndrome/pattern of heart blood stasis obstruction (HBSO, ordinary coefficient = 1.775, P < 0.001; Bivariate coefficient = 1.149, P < 0.001), or the coefficient between CHD and the syndrome/pattern of heart yang insufficiency (HYI, ordinary coefficient = 1.577, P < 0.001; Bivariate coefficient = 1.048, P < 0.001), and CVD with syndrome/pattern of wind and phlegm stagnating and impeding vessels and collaterals (WPIVC, ordinary coefficient = 1.987, P < 0.001; Bivariate coefficient = 0.066, P < 0.001). This indicates that the bias in the raw data is “towards zero” which is also consistent with regressors being contaminated with noise. The F-tests indicated that the instrumental variables are strongly correlated with TCM syndromes (F > 10). The overidentification test showed that there is evidence of overidentification, which may indicate potential issues with instrument validity, but it is hard to be sure because the linear approximation is imperfect. Shown in Supplementary Table 22–Supplementary Table 27.
The bivariate probit models with IV showed that the standout patterns linking WM diagnoses and TCM syndromes were a connection between HTN with syndrome/pattern of liver yang hyperactivity (LYH, coefficient = 2.306, P < 0.001); CHF with syndrome/pattern of heart yang insufficiency (HYI, coefficient = 1.911, P < 0.001), or with syndrome/pattern of qi and yin deficiency (QYD, coefficient = 1.531, P < 0.001); DM with QYD (coefficient = 2.711, P < 0.001); DLM with syndrome/pattern of dual deficiency of qi and blood (DDQB, coefficient = 2.088, P < 0.001), or with syndrome/pattern of spleen deficiency with dampness obstruction (SDDS, coefficient = 1.616, P < 0.001), or with syndrome/pattern of spleen deficiency with dampness encumbrance (SDDE, coefficient = 1.575, P < 0.001); CVD with syndrome/pattern of wind and phlegm blocking collaterals (WPBC, coefficient = 3.176, P < 0.001), or with QDBS (coefficient = 2.433, P < 0.001), or with syndrome/pattern of phlegm and stasis obstructing the collaterals (PSOC, coefficient = 2.403, P < 0.001), or with syndrome/pattern of phlegm and stasis obstructing the internal (PSOI, coefficient = 2.031, P < 0.001). All the patterns above had strong marginal effects (5.105~27.846, P < 0.001). See Table 3, Figure 3 and Supplementary Table 28.
 |
Table 3 Coefficients of Bivariate Probit Models and Marginal Effects |
 |
Figure 3 Correlation between Western Medicine and Traditional Chinese Medicine diagnosis. Abbreviations: WPIVC, syndrome/pattern of wind and phlegm stagnating and impeding vessels and collaterals; WPBC, syndrome/pattern of wind and phlegm blocking collaterals; TPOL, syndrome/pattern of turbid phlegm obstructing the lung; SDDS, syndrome/pattern of spleen deficiency with dampness obstruction; SDDE, syndrome/pattern of spleen deficiency with dampness encumbrance; QYD, syndrome/pattern of qi and yin deficiency; QSBS, syndrome/pattern of qi stagnation and blood stasis; QDPB, syndrome/pattern of qi deficiency with phlegm binding; QDBS, syndrome/pattern of qi deficiency with blood stasis; PSOI, syndrome/pattern of phlegm and stasis obstructing the internal; PSOC, syndrome/pattern of phlegm and stasis obstructing the collaterals; LYH, syndrome/pattern of liver yang hyperactivity; KDC, syndrome/pattern of kidney deficiency with complex; HYI, syndrome/pattern of heart yang insufficiency; HBSO, syndrome/pattern of heart blood stasis obstruction; DHPD, syndrome/pattern of dampness and heat pouring downwards; DDSK, syndrome/pattern of dual deficiency of spleen and kidney; DDQB, syndrome/pattern of dual deficiency of qi and blood; DDLS, syndrome/pattern of dual deficiency in the lung and spleen; DDLK, syndrome/pattern of dual deficiency of liver and kidney. |
Discussion
Using data on TCM hospitalization records in middle-aged and older adults in a city of South China, we found correlation patterns between WM diagnoses and TCM syndromes in cardiometabolic diseases. These findings reflect how changes in TCM syndromes may influence variations in WM diagnoses, offering insights into the dynamic relationship between the two systems.
In our study, the most common TCM syndromes in our records for patients with cardiometabolic diseases were QSBS, QDBS and DDLK. A related study in a hospital of north China showed that the leading TCM syndromes in heart diseases were QDBS, QDPB, PSOI, and HBSO, which is partly consistent with our study.11 According to TCM theory, the TCM syndromes distribution in space will vary because of spatial differences of topography and climate. Locations also vary in medical norms and medical practice cultures that may also affect doctors’ habits in how they diagnose TCM syndromes.14 According to WM, CHD, CVD, and CHF share common risk factors of HTN, DM, and DLM.32,33 We found that HTN, DM, and DLM had a large quantity of records, and the distribution showed spatial variation. Because our data came from 25 different hospitals, there may be patterns due to hospital based norms and cultures within how practitioners interpret and apply TCM theory.14 The LCA models were the first attempt to reveal the correlation between WM and TCM, by treating each diagnosis as a latent variable.18 The pure WM LCA results showed a good fit. However, when we added TCM syndromes into LCA models, the statistical values of tests of fit such as AICs, BICs, and likelihood ratios became worse. This statistical finding indicates that the TCM syndromes contained substantial noise reflecting statistical errors in the recording of TCM syndrome diagnosis.27
The probit models showed that the TCM syndromes were correlated with WM diagnosis, however the ordinary probit coefficients were attenuated and biased towards zero as would be expected if there were a high degree of mis-coding. This may have occurred because of the complexity of diagnosis, different theories and different doctor habit in TCM diagnosis bring challenge to reveal the correlations of TCM and WM. There are some competing theories in TCM,34 resulting in different school of thought, and different hospitals may have the central doctor or teacher spread an alternative school of thought.
To correct for measurement error, we predicted each patient’s assigned TCM syndrome in their different hospitals using instrumental variables (IV) calibrated to diagnostic patterns seen in each hospital. These prediction models produced diagnostic tests (F-Statistics) showing they were statistically justified.19 Moreover, even though there can also be miscoding of syndromes in WM, it was generally more reliable in our analysis because the dataset was restricted to of ICD-10 codes for CHF, CHD, CVD, DM, HTN and DLM. The bivariate probit with IV showed that different WM diagnoses were correlated with selected specific TCM syndromes. The marginal effects after bivariate probit showed that LYH was statistically significantly associated with HTN, the same finding held for HYI and QYD in CHF, QYD in DM, DDQB, SDDS, and SDDE in DLM, WPBC, QDBS, and PSOI in CVD with the coefficients of bivariate probit were larger than 1.5. The largest effects were seen for WPBC and CVD, QYD and DM, and QDBS and CVD, so we will now discuss the potential significance of these results.
To understand the most significant findings of a correlation between WPBC, QDBS and CVD, we look to both TCM and WM theories of pathogenesis. According to TCM theory, QDBS is caused by pathogenic factors damaging vital qi or qi deficiency failing to move blood, leading to blood stasis. Clinical findings in QDBS that TCM practitioners look for include localized stabbing pain that does not shift, a pale or dark purple tongue and stasis spots or patches on the edges. The pulse is deep, thin, or rough. Other accompanying symptoms include a dull complexion, fatigue, weakness, shortness of breath, and reluctance to speak.24 WPBC is understood in TCM theory to be caused by wind pathogens stirring up hidden phlegm or liver wind carrying phlegm, which disrupts the meridians and obstructs the muscles and channels. The TCM symptoms characterizing WPBC include post-stroke hemiplegia, limb spasms or tremors, twitching, facial deviation, drooling from the mouth, slurred speech, etc.24 CVD may also be accompanied by symptoms such as dizziness and numbness in the limbs.24 In WM, the clinical manifestations of CVD largely depend on the affected area of the brain and the severity of the damage. Common symptoms include sudden numbness or weakness in the face, arm, or leg, especially on one side of the body. This weakness or numbness may affect speech, walking, or the ability to grasp objects, which may also lead to vision problems and severe headache: A sudden, intense headache with no apparent cause, which may be accompanied by vomiting, dizziness, or altered consciousness. A previous study showed the similar results of acute cerebral infarction were correlated to the syndrome elements of qi deficiency, phlegm, blood stasis, and wind.35 However, these studies did not consider errors in variables and just had a small number of samples.
Theory can also shed light on the correlation between QYD and DM. The TCM concept of QYD refers to a type of syndrome caused by various factors that lead to the depletion of both qi and yin, where signs of qi deficiency and yin deficiency coexist, resulting in a lack of body nourishment.24 In TCM, qi deficiency refers to the condition where the body’s qi, or vital energy, is insufficient, leading to an inability to regulate and retain essential body functions, such as body fluids and blood. This can result in symptoms like spontaneous sweating, frequent urination, and fatigue, as the body fails to “hold” its resources properly. On the other hand, yin deficiency generating heat reflects a situation where the depletion of yin, the body’s cooling and moistening force, leads to internal heat. When yin is deficient, the body loses its balance between yin and yang, resulting in signs of internal heat such as hot flashes, night sweats, dry mouth, and irritability.7 A mechanism that could explain the symptoms of DM as understood by TCM practitioners could be hyperglycemic diuresis, which would deplete body fluids, hence leading to dry mouth and thirst as described under the “Xiaoke disease” pattern.7
Syndrome differentiation to guide treatment is the core of TCM. In TCM theory, a disease characterized with multiple TCM syndromes can reflect the severity of the case.7 Previous studies also showed that TCM syndrome classification may change as the disease progresses and the TCM syndromic changes can reflect a natural transitions from occurrence, initial, intermediate, and advanced stages, to recovery, relapse, or deterioration of disease.9 The better understanding of correlations between WM and TCM syndromes may add values to the clinical practice. For example, improving the personalized integrative care, predicting length of stay or healthcare costs and establishing cross-disciplinary training.
Limitations
Data came from the home page of the hospitalization record, which did not cover comprehensive information. There was unmeasured confounding that may affect the results. For example, the inconsistencies between doctors, the lack of biological indicators related to TCM syndromes. Moreover, the findings are correlational rather than causal, which can only reveal the correlation between TCM and WM diagnosis.
Conclusions
We found the correlations between WM and TCM syndromes diagnosis were attenuated due to coding errors and these correlations became more detectable with the usage of IV. Considering possible correspondence between each tradition’s theory of pathogenesis can provide a new perspective for integrative medicine and a way to cross walk between two contrasting medical diagnostic traditions. TCM practitioners describe the severity of diseases by assigning TCM syndromes, which also reflect the etiology and pathogenesis and naturally motivate target measures to correct the disorder. This study provides a basis for adding TCM syndrome modules to clinical electronic medical records, as well as for standardizing coding of dual diagnoses and conducting interdisciplinary training in institutions that practice both diagnoses.
Abbreviations
WM, Western Medicine; TCM, Traditional Chinese Medicine; HTN, hypertension diseases; DM, type 2 diabetes mellitus; DLM, disorders of lipoprotein metabolism; CHD, coronary heart diseases; CHF, heart failure; CVD, cerebrovascular diseases; AIC, Akaike information criterion; BIC, Bayesian information criterion; QSBS, syndrome/pattern of qi stagnation and blood stasis; QDBS, syndrome/pattern of qi deficiency with blood stasis; DDLK, syndrome/pattern of dual deficiency of liver and kidney; QDPB, syndrome/pattern of qi deficiency with phlegm binding; PSOC, syndrome/pattern of phlegm and stasis obstructing the collaterals; PSOI, syndrome/pattern of phlegm and stasis obstructing the internal; DDQB, syndrome/pattern of dual deficiency of qi and blood; DDSK, syndrome/pattern of dual deficiency of spleen and kidney; WPBC, syndrome/pattern of wind and phlegm blocking collaterals; QYD, syndrome/pattern of qi and yin deficiency; TPOL, syndrome/pattern of turbid phlegm obstructing the lung; SDDS, syndrome/pattern of spleen deficiency with dampness obstruction; KDC, syndrome/pattern of kidney deficiency with complex; WPIVC, syndrome/pattern of wind and phlegm stagnating and impeding vessels and collaterals; DHPD, syndrome/pattern of dampness and heat pouring downwards; SDDE, syndrome/pattern of spleen deficiency with dampness encumbrance; DDLS, syndrome/pattern of dual deficiency in the lung and spleen; HBSO, syndrome/pattern of heart blood stasis obstruction; LYH, syndrome/pattern of liver yang hyperactivity; HYI, syndrome/pattern of heart yang insufficiency.
Data Sharing Statement
The data that support the findings are restrictions apply and not publicly available. We will provide the details of the data with reasonable request. The code will be available upon publication.
Ethics Approval and Consent to Participate
This study utilizes anonymized medical record data and complies with the principles of the Declaration of Helsinki. Ethical approval for the research was obtained from ethics committee of Southern Medical University (Approval No. of ethics committee: 2024-75), and all procedures followed data privacy protection and ethical guidelines to ensure the confidentiality of participants.
Acknowledgments
We thank all doctors and researchers who helped during the implementation of the project, including Dr. Qing Xia (Queensland University of Technology), Ms. Qingzhuo Ren (Shenzhen Children’s Hospital) and Mr. Kaiyuan Zhang (The Second Affiliated Hospital of Guangzhou University of Chinese Medicine, Guangdong Provincial Hospital of Chinese Medicine).
Funding
International Program for Postgraduates, Guangzhou University of Chinese Medicine.
Disclosure
The authors declare that they have no competing interests.
References
1. Chinese Preventive Medicine Association, Branch of Heart Disease Prevention and Control, Chinese Preventive Medicine Association, Chinese Diabetes Society, Branch of Stroke Prevention and Control, Chinese Preventive Medicine Association, Chinese Health Management Society, Branch of Non-communicable Chronic Disease Prevention and Control, Chinese Preventive Medicine Association. Chinese guideline on healthy lifestyle to prevent cardiometabolic diseases. Chin Circulation J. 2020;12:141–162.
2. Larsen FB, Pedersen MH, Friis K, Glümer C, Lasgaard M. A latent class analysis of multimorbidity and the relationship to socio-demographic factors and health-related quality of life. a national population-based study of 162,283 Danish adults. PLoS One. 2017;12(1):e0169426. doi:10.1371/journal.pone.0169426
3. Zheng Y, Zhou Z, Wu T, et al. Association between composite lifestyle factors and cardiometabolic multimorbidity in Chongqing, China: a cross-sectional exploratory study in people over 45 years and older. Front Public Health. 2023;11:1118628. doi:10.3389/fpubh.2023.1118628
4. Lam WC, Lyu A, Bian Z. ICD-11: impact on traditional Chinese medicine and world healthcare systems. Pharm Med. 2019;33(5):373–377. doi:10.1007/s40290-019-00295-y
5. Wang Q. Individualized medicine, health medicine, and constitutional theory in Chinese medicine. Front Med. 2012;6(1):1–7. doi:10.1007/s11684-012-0173-y
6. Chen KF. Study on Traditional Chinese Medicine Constitution Factors Related to Health-Related Quality of Life in the General Population of Nine Provinces and Cities [Master]. Beijing University of Chinese Medicine; 2009. https://kns.cnki.net/kcms2/article/abstract?v=3uoqIhG8C475KOm_zrgu4lQARvep2SAk6at-NE8M3PgrTsq96O6n6cBr3nAhfLqDKYQhjzUomHyyx7awzvApEh0kW7cwArVh&uniplatform=NZKPT.
7. Zhang BL, Wu MH. Internal Medicine of Traditional Chinese Medicine.
8. Lei SY, Chang X, Wang LY, Liu DS, Han XJ. The characteristics of TCM syndromes in 3446 patients suffering CHD complicated with depression based on literature study. World J Tradit Chin Med. 2022;35:63–68.
9. Cheng F, Wang X, Song W, et al. Biologic basis of TCM syndromes and the standardization of syndrome classification. J Tradit Chin Med Sci. 2014;1(2):92–97. doi:10.1016/j.jtcms.2014.09.005
10. Shuang LI, Shuwei D, Zheyi D, et al. Distribution of traditional Chinese medicine syndromes in diabetic kidney disease chronic kidney disease 1-5: a correlation study. J Tradit Chin Med. 2024;44(3):572–580. doi:10.19852/j.cnki.jtcm.20230802.007
11. Huang XL, Li X, Ji HC, et al. A retrospective study on the modern traditional Chinese medicine syndrome characteristics of coronary heart disease based on the clinical diagnosis and treatment data in Tianjin from 2015 to 2021. J Traditional Chin Med. 2024;65:1363–1368.
12. Ho L, Xu Y, Zhang NL, et al. Data driven identification and classification of Chinese medicine syndrome types among functional dyspepsia patients: latent tree analysis (abridged secondary publication). Hong Kong Med J. 2024;30(4):40–46.
13. Gao H. Distribution Characteristics of Traditional Chinese Medicine Inquiry Symptoms and Syndrome of 1007 Patients with Coronary Heart Disease at Different Ages [Master]. Shanghai University of Traditional Chinese Medicine; 2021.
14. Zheng HX. Basic Theory of Traditional Chinese Medicine. Beijing: China Traditional Chinese Medicine Press; 2016.
15. Liu GP, Wang YQ, Zhao NQ, et al. Discussion on the information interpretation and diagnostic consistency of the four diagnoses among TCM clinicians. World Sci Technol. 2010;12:358–362.
16. GBD 2021 Diabetes Collaborators. Global, regional, and national burden of diabetes from 1990 to 2021, with projections of prevalence to 2050: a systematic analysis for the global burden of disease study 2021. Lancet. 2023;402(10397):203–234. doi:10.1016/S0140-6736(23)01301-6
17. GBD 2021 Risk Factors Collaborators. Global burden and strength of evidence for 88 risk factors in 204 countries and 811 subnational locations, 1990–2021: a systematic analysis for the global burden of disease study 2021. Lancet. 2024;403(10440):2162–2203. doi:10.1016/S0140-6736(24)00933-4
18. Skrondal A, Rabe-Hesketh S. Generalized Latent Variable Modeling: Multilevel, Longitudinal, and Structural Equation Models. Boca Raton: Chapman & Hall/CRC; 2004.
19. Hernan MA, Robins JM. Causal Inference: What If. Boca Raton: Chapman & Hall/CRC; 2020.
20. Lawrence MG. The relationship between relative humidity and the dewpoint temperature in moist air: a simple conversion and applications. Bull Am Meteorol Soc. 2005;86(2):225–234. doi:10.1175/BAMS-86-2-225
21. R: the R project for statistical computing [Internet]. [cited May 19, 2025]. Available from: https://www.r-project.org/.
22. Stata/MP: advanced multiprocessing capabilities [Internet]. [cited May 19, 2025]. Available from: https://www.stata.com/statamp/.
23. Wickham H. RStudio. tidyverse: easily install and load the “Tidyverse” [Internet]. 2023 [cited May 19 2025]. Available from: https://cran.r-project.org/web/packages/tidyverse/index.html.
24. National medical administration of traditional Chinese medicine (2020) no. 3. notice of the national health commission of the state administration of traditional Chinese medicine on issuing the classification and code of tcm diseases and the terms of tcm clinical diagnosis and treatment _ department documents of the state council _ Chinese government website [Internet]. 2020. Available from: https://www.gov.cn/zhengce/zhengceku/2020-11/24/content_5563703.htm.
25. Maddali MV, Moore AR, Sinha P, et al. Molecular endotypes of idiopathic pulmonary fibrosis: a latent class analysis of two multicenter observational cohorts. Am J Respir Crit Care Med. 2024;210(4):455–464. doi:10.1164/rccm.202402-0339OC
26. Khandker SR, Koolwal GB, Samad HA. Handbook on Impact Evaluation: Quantitative Methods and Practices. Washington, D.C: World Bank; 2010. https://hdl.handle.net/10986/2693.
27. Griliches Z. Errors in variables and other unobservables. Econometrica. 1974;42(6):971–998. doi:10.2307/1914213
28. Christofides LN, Stengos T, Swidinsky R. On the calculation of marginal effects in the bivariate probit model. Econ Lett. 1997;54(3):203–208. doi:10.1016/S0165-1765(97)00025-6
29. Seyoum S. Analysis of prevalence of malaria and anemia using bivariate probit model. Ann Data Sci. 2018;5(2):301–312. doi:10.1007/s40745-018-0138-3
30. Katchova A. Econometrics academy - bivariate probit and logit models. 2013. Available from: https://sites.google.com/site/econometricsacademy/econometrics-models/bivariate-probit-and-logit-models.
31. Andrews I, Stock JH, Sun L. Weak instruments in instrumental variables regression: theory and practice. Annu Rev Econ. 2019;11(1):727–753. doi:10.1146/annurev-economics-080218-025643
32. Han Y, Hu Y, Yu C, et al. Lifestyle, cardiometabolic disease, and multimorbidity in a prospective Chinese study. Eur Heart J. 2021;42(34):3374–3384. doi:10.1093/eurheartj/ehab413
33. Li R, Shao J, Hu C, et al. Metabolic risks remain a serious threat to cardiovascular disease: findings from the global burden of disease study 2019. Intern Emerg Med. 2024;19(5):1299–1312. doi:10.1007/s11739-024-03605-8
34. Ma Z, Jia C, Guo J, Gu H, Miao Y. Features analysis of five-element theory and its basal effects on construction of visceral manifestation theory. J Tradit Chin Med. 2014;34(1):115–121. doi:10.1016/s0254-6272(14)60064-9
35. Wang YY, Hu J, Xu RQ, Lu XL, Wang YW. Analysis on the correlation of traditional Chinese medicine syndromes with collateral circulation, cerebral blood flow perfusion and prognosis of patients with acute cerebral infarction. J Guangzhou Univ Tradit Chin Med. 2024;41:1662–1669.
 © 2025 The Author(s). This work is published and licensed by Dove Medical Press Limited. The
full terms of this license are available at https://www.dovepress.com/terms.php
and incorporate the Creative Commons Attribution
- Non Commercial (unported, 4.0) License.
By accessing the work you hereby accept the Terms. Non-commercial uses of the work are permitted
without any further permission from Dove Medical Press Limited, provided the work is properly
attributed. For permission for commercial use of this work, please see paragraphs 4.2 and 5 of our Terms.
© 2025 The Author(s). This work is published and licensed by Dove Medical Press Limited. The
full terms of this license are available at https://www.dovepress.com/terms.php
and incorporate the Creative Commons Attribution
- Non Commercial (unported, 4.0) License.
By accessing the work you hereby accept the Terms. Non-commercial uses of the work are permitted
without any further permission from Dove Medical Press Limited, provided the work is properly
attributed. For permission for commercial use of this work, please see paragraphs 4.2 and 5 of our Terms.