")
Back to Journals » Journal of Inflammation Research » Volume 17
Unveiling and Validating the Role of Fatty Acid Metabolism in Ulcerative Colitis
Authors Deng B, Zhen J, Xiang Z, Li X , Tan C, Chen Y, He P, Ma J, Dong W
Received 1 July 2024
Accepted for publication 28 August 2024
Published 13 September 2024 Volume 2024:17 Pages 6345—6362
DOI https://doi.org/10.2147/JIR.S479011
Checked for plagiarism Yes
Review by Single anonymous peer review
Peer reviewer comments 2
Editor who approved publication: Dr Tara Strutt
Beiying Deng,1,2,* Junhai Zhen,3,* Zixuan Xiang,1,2,* Xiangyun Li,1,2 Cheng Tan,1,2 Ying Chen,1 Pengzhan He,1 Jingjing Ma,4 Weiguo Dong1,*
1Department of Gastroenterology, Renmin Hospital of Wuhan University, Wuhan, People’s Republic of China; 2Key Laboratory of Hubei Province for Digestive System Disease, Wuhan, People’s Republic of China; 3Department of General Practice, Renmin Hospital of Wuhan University, Wuhan, People’s Republic of China; 4Department of Geriatric, Renmin Hospital of Wuhan University, Wuhan, People’s Republic of China
*These authors contributed equally to this work
Correspondence: Weiguo Dong, Department of Gastroenterology, Renmin Hospital of Wuhan University, No. 99 Zhangzhidong Road, Wuhan, Hubei Province, 430060, People’s Republic of China, Tel +86 027-88041911, Email [email protected]
Background: Ulcerative colitis (UC) is a debilitating intestinal disorder that imposes a significant burden on those affected. Fatty acid metabolism plays a pivotal role in regulating immune cell function and maintaining internal homeostasis. This study investigates the biological and clinical significance of fatty acid metabolism within the context of UC.
Methods: Gene expression profiles from patients with UC and healthy controls were retrieved, enabling the identification of differentially expressed genes (DEGs) specific to UC. These DEGs were then intersected with genes related to fatty acid metabolism, resulting in the identification of differentially expressed fatty acid metabolism-related genes (FAM-DEGs). Machine learning was employed to pinpoint key feature genes from the FAM-DEGs, which were subsequently used to construct a predictive UC model and to uncover molecular subtypes associated with fatty acid metabolism in UC. An animal model of UC was established using 3% dextran sulfate sodium (DSS) administration. Western blot analysis confirmed the expression levels of genes in intestinal tissues.
Results: The machine learning analysis identified three pivotal genes—ACAT1, ACOX2, and HADHB—culminating in a highly predictive nomogram. Consensus cluster analysis further categorized 637 UC samples into two distinct subgroups. The molecular subtypes related to fatty acid metabolism in UC exhibited significant differences in gene expression, biological activities, and enrichment pathways. Immune infiltration analysis highlighted elevated expression of two genes (excluding HADHB) in subtype 1, which corresponded with a marked increase in immune cell infiltration within this subtype. Western blot analysis demonstrated that ACAT1, ACOX2, and HADHB expression levels in the DSS group were significantly reduced, paralleling those observed in the normal group.
Conclusion: This study highlights the critical role of specific fatty acid metabolism-related genes in UC, emphasizing their potential as targets for therapeutic intervention and shedding light on the underlying mechanisms of UC progression.
Keywords: fatty acid metabolism, ulcerative colitis, machine learning, biomarkers, pharmacology, immune infiltrations
Introduction
Ulcerative colitis (UC) is a chronic inflammatory disease that can affect the entire colon, contributing to a growing global health burden.1 Despite ongoing research, the intricate pathogenesis of UC remains poorly understood, likely involving factors such as a compromised intestinal mucosal barrier, immune dysregulation, and altered gut microbiota.2,3 Fatty acid metabolism plays a critical role in modulating immune cell function and maintaining homeostasis through processes such as fatty acid intake, synthesis, and beta-oxidation.4 Specific fatty acids and metabolic pathways have been implicated in the pathogenesis of inflammatory bowel diseases (IBD).5 Short-chain fatty acids (SCFAs), produced by gut microbiota, serve not only as an energy source for colonic cells but also play a vital role in preserving the integrity of the intestinal epithelial barrier.6 Additionally, the rising prevalence of the Western diet, characterized by high fat intake—particularly saturated fats—has been associated with increased susceptibility to inflammatory conditions.7 In animal models of IBD, treatment with n-6 polyunsaturated fatty acids (PUFAs) results in a significant reduction in intestinal goblet cells and an influx of leukocytes.8 In contrast, n-3 PUFAs and their oxidized derivatives exhibit anti-inflammatory properties, mitigating IBD-related inflammation.9
Immune dysregulation is a key mechanism driving inflammatory bowel diseases. Disruptions in fatty acid metabolism can result in abnormal immune cell activation and excessive inflammatory factor release.10,11 The transcription factor peroxisome proliferator-activated receptor (PPAR), an essential endogenous ligand in fatty acid metabolism, is critical for maintaining the M2 macrophage phenotype.12 Additionally, fatty acids upregulate CD36 expression, which, by enhancing fatty acid uptake, promotes the M2 phenotype and perpetuates a harmful cycle of activation. Dysfunctional epithelial cells and polarized macrophages produce substantial levels of pro-necrotic cytokines.13 Moreover, CCAAT-enhancer-binding protein, regulated by fatty acids and their derivatives, facilitates the dedifferentiation of myofibroblasts into adipocytes.14 Consequently, targeting fatty acid metabolism represents a promising strategy for UC management.15
Despite these insights, gaps remain in our understanding of the role of fatty acid metabolism-related genes in UC etiology, and the prognostic significance of these genes requires further investigation. Given the complex interplay between genetic factors and disease progression, a deeper understanding of fatty acid metabolism in UC pathophysiology could offer valuable insights for developing novel therapeutic strategies and personalized treatments. This study aimed to elucidate the mechanisms driving UC progression and lay the groundwork for pioneering interventions that leverage the potential of fatty acid metabolism-related genes, ultimately enhancing UC management and prognosis.
Methods
Data Extraction and Preprocessing
Clinical data and colonic mucosal gene expression profiles from patients with UC and healthy controls (HC) were retrieved from the GEO database. To ensure robust sample representation in subsequent analyses, data from GSE87466 and GSE206285 were integrated and processed, with adjustments made for batch effects. For broader context validation, the GSE75214 dataset was utilized as an external validation set.
Identification of Differentially Expressed Fatty Acid Metabolism-Related Genes
A list of genes implicated in fatty acid metabolism was compiled from existing literature (Supplementary Table S1). The Wilcoxon rank-sum test was employed to rigorously assess differences in gene expression between groups. A protein-protein interaction (PPI) network was constructed using the STRING database (version 11.5, http://string-db.org/) to investigate gene interactions,16 which was then visualized using Cytoscape software (version 3.9.1, https://cytoscape.org) after filtering out disconnected nodes.17 Significant gene clusters were identified using the MCODE plugin,18 and potential transcription factors (TFs) driving gene expression changes were screened using ChIP-X enrichment analysis 3 (ChEA3, https://maayanlab.cloud/chea3/).19
Functional Enrichment Analysis
The biological functions of the genes were evaluated through Gene Ontology (GO) and Kyoto Encyclopedia of Genes and Genomes (KEGG) analyses. To examine variations in enriched functions and pathways across different molecular subtypes, Gene Set Variation Analysis (GSVA) was employed, with a |t|-value greater than 2 set as the threshold for significant enrichment.
Analysis of Immune Cell Infiltration
The infiltration levels of immune cell subtypes within the samples were quantified using the single-sample Gene Set Enrichment Analysis (ssGSEA) method. Differences in immune cell abundance between groups and correlations between specific feature genes and immune cells were analyzed using the Wilcoxon rank-sum test and Spearman correlation analysis.
Identification of Feature Genes Using Machine Learning Algorithms
To develop predictive models, the Python “Pycaret” package was used to construct nine different machine-learning algorithms based on the gene expression profiles of differentially expressed fatty acid metabolism-related genes. The 676 samples were randomly divided into training and testing sets in a 7:3 ratio, with UC incidence as the response variable and differentially expressed genes (DEGs) as feature variables. Each algorithm underwent a hyperparameter grid search and 10-fold cross-validation on the training set to identify the optimal hyperparameters.
To evaluate the performance of the machine-learning algorithms, Precision-Recall (PR) curves and Area Under the ROC Curve (AUC) metrics were generated for each model. Additionally, accuracy, F1 score, Kappa, and MCC values were calculated for comprehensive assessment.
Construction and Validation of Nomogram Based on the Feature Genes
Based on the identified feature genes involved in fatty acid metabolism, a nomogram was developed and its accuracy and clinical relevance were assessed using calibration and decision curve analyses. The diagnostic efficacy of the nomogram, as well as the differential expression of fatty acid metabolism-related genes between patients with UC and HC, were further evaluated using the GSE75214 dataset. The ability of these genes to distinguish between the two groups was assessed through the generation of ROC curves using the “pROC” package.
Animal Experiments
Male C57BL/6J wild-type mice, aged 6 to 8 weeks, were procured from Hunan SJA Laboratory Animal Co., Ltd. The mice were housed in standard, pathogen-free conditions with ad libitum access to food and water.
Six mice were randomly assigned to each of the control and DSS groups. The DSS group received 3% DSS (MP Biomedicals, Santa Ana, CA, USA) in their drinking water for seven consecutive days, while the control group was given distilled water. Daily observations were made for body weight, food and water intake, rectal bleeding, survival, and fecal consistency. The Disease Activity Index (DAI) was calculated for each mouse based on body weight loss, occult blood, and stool consistency. Colon tissues from both groups were collected and preserved in 4% buffered formalin. For histopathological examination, tissue sections were sliced to 5 μm thickness and stained with hematoxylin and eosin (HE), then examined under a light microscope (Olympus Corporation, Tokyo, Japan).
The study followed the ARRIVE guidelines. Animal experiments and care strictly followed the regulations of the National Institutes of Health for the ethical treatment and use of animals in research (NIH Publication No. 80-23; revised 1978) and received approval from the Ethics Committee of Renmin Hospital of Wuhan University (Protocol No. WDRM20230603D).
Western Blot Analysis
Western blot (WB) analysis was conducted as previously described.20 Protein extracts were obtained from mouse colon tissues using a lysis buffer containing complete protease inhibitors without ethylenediaminetetraacetic acid (EDTA). The proteins were separated by 10% sodium dodecyl sulfate-polyacrylamide gel electrophoresis (SDS-PAGE) and transferred to a polyvinylidene difluoride membrane. The membranes were incubated overnight at 4°C with primary antibodies, followed by incubation with secondary antibodies at 37°C for 2 hours. α-tubulin served as an internal control. The antibodies used included HADHB (Rabbit, 1:2000, Proteintech, China), ACOX2 (Rabbit, 1:1000, ELK Biotechnology), and ACAT1 (Rabbit, 1:1000, ELK Biotechnology).
Unsupervised Clustering Analysis
For unsupervised clustering analysis of patients with UC, the “ConsensusClusterPlus” package was utilized. Through 1000 iterations of the k-means algorithm, 637 patients with UC were stratified into distinct molecular subtypes, with the maximum number of subtypes (k) set to six. The optimal number of subtypes was determined using consensus matrices, consensus clustering scores, and cumulative distribution curves. t-SNE analysis was then performed to visualize distribution disparities among the subtypes.
Small Molecule Agents Screening and Mechanism of Action Analysis
To explore potential small molecule drugs tailored to specific subtypes, the Connectivity Map (CMap, https://clue.io/) database was utilized. The top 150 subtype-specific DEGs were used as input for CMap analysis. Screening of potential compounds was based on enrichment scores, followed by a mechanism of action analysis for the selected compounds (Supplementary Tables S2 and S3).
Statistical Analysis
All statistical analyses were conducted using R software (version 4.2.3, https://www.r-project.org) and associated R packages. Group comparisons were performed using the t-test for two groups and one-way ANOVA for three or more groups. Spearman correlation analyses were performed using the “ggpubr” and “stats” R packages, with a p-value of <0.05 considered statistically significant.
Results
Data Preprocessing and Identification of Fatty Acid Metabolism-Related DEGs
To elucidate the role of fatty acid metabolism in UC development, gene expression profiles from colonic tissues of a combined cohort comprising 637 patients with UC and 39 HC were curated from the GSE87466 and GSE206285 datasets. Prior to batch correction, the principal component analysis revealed that samples clustered by dataset rather than by sample type, indicating that data source exerted a greater influence on the results than sample type, thereby confirming the presence of a batch effect (Figure 1A). Post-correction, samples predominantly clustered according to UC or HC status, suggesting that sample type became the primary source of variation (Figure 1B and C). This adjustment led to the identification of 3196 DEGs (Figure 1D and E). By intersecting these DEGs with a predefined set of 309 genes linked to fatty acid metabolism, 109 differentially expressed genes specifically associated with fatty acid metabolism (FAM-DEGs) were identified (Figure 1F). Functional analyses underscored the significant enrichment of these genes in pathways related to fatty acid metabolism, including fatty acid degradation, the carboxylic acid catabolic process, and the organic acid catabolic process (Figure 1G and H).
 |
Figure 1 Identification of FAM-DEGs. (A and B) PCA of two datasets before (A) and after (B) batch effect correction. (C) PCA of the merged dataset. (D and E) Heatmap (D) and volcano plot (E) illustrating gene expression patterns between patients with UC and HC. (F) Venn diagram showing overlapping genes between differentially expressed genes and fatty acid metabolism-related genes. (G) KEGG pathway enrichment analysis of FAM-DEGs. (H) GO enrichment analysis of FAM-DEGs. Abbreviations: FAM-DEGs, fatty acid metabolism-related differentially expressed genes; PCA, principal component analysis; UC, ulcerative colitis; HC, healthy controls; KEGG, Kyoto Encyclopedia of Genes and Genomes; GO, Gene Ontology. |
Further insights into the interconnections among these FAM-DEGs were provided by a gene relationship network diagram. A PPI network was constructed using the STRING database, and the MCODE plugin was employed to identify significant gene cluster modules, with subsequent analysis focusing on the highest-scoring module (Figure 2A and B). Correlation analysis of the 23 genes in module 1 was then conducted to explore the role of fatty acid metabolism in UC progression (Figure 2C). The results revealed that most fatty acid metabolism-related genes exhibited significant synergistic interactions.
 |
Figure 2 (A) Protein interaction network of 109 FAM-DEGs. (B) MCODE sub-network. (C) Correlation heatmap of 23 FAM-DEGs. (D) Split violin plot showing the expression levels of transcription factors in patients with UC and HC. Abbreviations: FAM-DEGs, fatty acid metabolism-related differentially expressed genes; UC, ulcerative colitis; HC, healthy controls. Notes: *p < 0.05, ***p < 0.001, ****p < 0.0001. |
Identification of TFs
Given that co-expressed genes often share common TFs, the CHEA3 database was employed to identify potential TFs regulating these genes. The analysis revealed NR1H4, MLXIPL, NR1I2, CEBPA, NKX2-3, ZNF181, ESRRA, NR1I3, CREB3L3, and RORC as the top 10 significantly enriched TFs. Expression profiling of these TFs in patients with UC and HC showed significant downregulation of NR1H4, MLXIPL, NR1I2, CEBPA, ESRRA, and NR1I3 in patients with UC, while NKX2-3 was upregulated (Figure 2D). ZNF181 and RORC were excluded from further analysis due to their absence in the dataset.
Identification of Fatty Acid Metabolism-Related Features Genes Using Multiple Machine Learning Methods
The cohort of 676 samples was divided into a training set of 473 samples and a testing set of 203 samples (7:3 ratio). The diagnostic performance of nine machine learning models in differentiating patients with UC from HC was assessed using 23 FAM-DEGs in the testing set, with LightGBM and Adaboost models showing superior diagnostic accuracy (Table 1 and Figure 3).
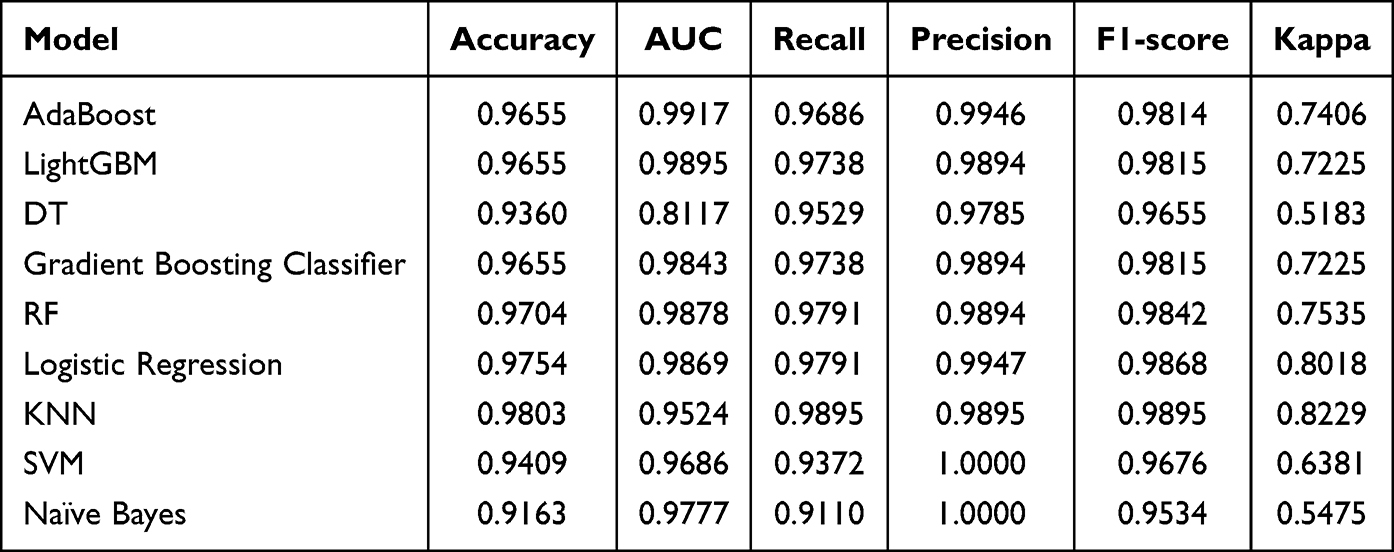 |
Table 1 Diagnostic Efficacy Comparison of Nine Distinct Machine Learning Models |
 |
Figure 3 Evaluation of nine machine learning algorithms based on the area under the ROC curve (AUC) and Precision-Recall (PR) curves. (A) AdaBoost algorithm. (B) Decision Tree algorithm. (C) Naïve Bayes algorithm. (D) Gradient Boosting Classifier. (E) KNN algorithm. (F) LightGBM algorithm. (G) Logistic Regression. (H) Random Forest algorithm. (I) SVM algorithm. Abbreviations: KNN, K-nearest neighbors; LightGBM, Light Gradient Boosting; SVM, Support Vector Machines. |
By cross-referencing the top 10 feature genes identified by Adaboost (Figure 4A) and LightGBM (Figure 4B), seven key feature genes were identified: ACAT1, ACOX2, HADHB, ACOX1, EHHADH, ECH1, and ACADM. ROC curve analysis demonstrated the strong diagnostic potential of these genes in predicting UC, with ACOX1 achieving an AUC value of 0.972 (Figure 5A).
 |
Figure 4 Variable importance plot in the AdaBoost (A) and LightGBM (B) machine learning algorithms. Abbreviation: LightGBM, Light Gradient Boosting. |
 |
Figure 5 (A) ROC analysis of seven feature FAM-DEGs in diagnosing UC. (B) Logistic model for diagnosing UC. (C and D) Calibration curves (C) and DCA (D) evaluating the prediction efficacy and clinical benefit of the nomogram in the training set. (E) Risk score derived from the model for patients with UC and HC in the training set. (F) ROC evaluation of the nomogram’s diagnostic performance in the training set. Abbreviations: ROC, the receiver operating characteristic; FAM-DEG, fatty acid metabolism-related differentially expressed genes; UC, ulcerative colitis; HC, healthy controls; DCA, decision curve analysis. Notes: ****p < 0.0001. |
Construction and Validation of a Diagnostic Model Based on Fatty Acid Metabolism-Related Genes
A logistic regression model was subsequently developed using these genes, resulting in the equation: risk score = (−6.9946ACAT1) + (−4.1114ACOX2) + (−3.5219*HADHB). The nomogram based on these three feature genes proved to be an effective predictive tool for diagnosing UC, as indicated by the calibration curve (Figure 5B and C) and decision curve analysis (DCA) (Figure 5D), with an AUC value of 0.991 (Figure 5F). The risk score derived from the model showed significant variation between patients with UC and HC in the training set (Figure 5E). The DCA (Figure 6A and E) and calibration curve (Figure 6B and F) findings consistently demonstrated the nomogram’s favorable diagnostic performance in both the testing and validation sets, with ROC curve AUC values of 0.989 and 1.00 (Figure 6C and G), respectively. Additionally, the risk score demonstrated significant differences between patients with UC and HC in both sets (Figure 6D and H). Consistent with these findings, expression levels of ACAT1, ACOX2, and HADHB were significantly reduced in patients with UC within the external dataset (Figure 6J). The ROC curve AUC values for ACAT1, ACOX2, and HADHB in the external dataset were 0.959, 1.00, and 0.988, respectively (Figure 6I). Collectively, these results highlight the potential of ACAT1, ACOX2, and HADHB as promising biomarkers for distinguishing patients with UC from HC.
 |
Figure 6 (A and E) DCA evaluating the prediction efficacy of the nomogram in the testing (A) and validation sets (E). (B and F) Calibration curves evaluating the clinical benefit of the nomogram in the testing (B) and validation sets (F). (C and G) ROC evaluation of the nomogram’s diagnostic performance in the testing (C) and validation sets (G). (D and H) Risk score derived from the model for patients with UC and HC in the testing (D) and validation sets (H). (I) ROC curve analysis for ACAT1, ACOX2, and HADHB in diagnosing UC in the external dataset. (J) Expression levels of ACAT1, ACOX2, and HADHB in patients with UC and HC in the external dataset. Abbreviations: DCA, decision curve analysis; ROC, the receiver operating characteristic; UC, ulcerative colitis; HC. healthy control. Notes: ****p < 0.0001. |
Validation of Genes in Colon Tissues
An animal model for colitis was successfully established by administering 3% DSS, which resulted in significant weight loss (Figure 7A), a marked increase in DAI scores (Figure 7B), and a notable reduction in colon length (Figure 7C and D) compared to the control group. These changes were further corroborated through HE staining and histopathological scoring (Figure 7E and F). To delve deeper into the molecular mechanisms, Western blot analysis was conducted to assess the expression levels of ACAT1, ACOX2, and HADHB in the colons of mice with DSS-induced colitis compared to controls. Consistent with our prior findings, the expression of these genes was significantly lower in the colonic tissues of the DSS group (Figure 7G–J).
 |
Figure 7 Validation of gene expression in colon tissues. (A and B) Relative weight change (A) and disease activity index (B) in each group (n = 6). (C) Representative morphological images of mouse colons from the control and DSS groups. (D) Statistical analysis of colon length. (E) Representative H&E staining of colonic tissues from each group. (F) Statistical results for histological damage scores in each group (n = 6). (G) Western blot analysis of ACAT1, ACOX2, and HADHB levels in colon tissues. Group identifications are as shown. (H–J) Quantitative analysis of Western blot results for ACAT1 (H), ACOX2 (I), and HADHB (J) expression. Data are presented as mean ± SEM. Abbreviation: DSS, dextran sulphate sodium. Notes: *p < 0.05, **p < 0.01, ***p < 0.001, ****p < 0.0001. |
Analysis of Immune Cell Infiltration in UC and HC
Immune dysfunction plays a critical role in the pathogenesis of UC. Examination of immune cell infiltration in the colonic tissues of patients with UC and HC revealed significantly higher levels of immune cells in patients with UC. These included CD56bright and CD56dim natural killer cells, central memory CD4 and CD8 T cells, effector memory CD4 T cells, T cells, immature dendritic cells, memory B cells, monocytes, plasmacytoid dendritic cells, and T follicular helper cells (Figure 8A and B). The correlations among the 28 immune cell types are depicted in Figure 8C. These findings suggest that altered immune activity may play a significant role in the onset and progression of UC. Notably, ACAT1 exhibited strong correlations with immune cells such as effector memory CD4 T cells and activated dendritic cells (Figure 8D), while ACOX2 showed strong correlations with CD56bright and CD56dim natural killer cells and neutrophils (Figure 8E). Additionally, HADHB was strongly associated with CD56bright natural killer cells, central memory CD8 T cells, and myeloid-derived suppressor cells (MDSCs) (Figure 8F). Collectively, these results underscore the potential role of fatty acid metabolism-mediated immune cell activation as a key pathological mechanism driving UC progression.
 |
Figure 8 (A) Heatmap illustrating variations in immune cell infiltration in the colon tissues of patients with UC and HC. (B) Differences in infiltrated immune cells between patients with UC and HC. (C) Heatmap showing correlations among immune cells. (D–F) Lollipop charts presenting the correlations between ACAT1 (D), ACOX2 (E), HADHB (F) expression, and immune cells. Abbreviations: UC, ulcerative colitis; HC, healthy controls; ns, not significant. Notes: *p < 0.05, **p < 0.01, ***p < 0.001, ****p < 0.0001. |
Construction of Fatty Acid Metabolism Subtypes in UC
Using an unsupervised clustering analysis based on the three FAM-DEGs, patients with UC were categorized into two distinct subtypes, 1 and 2 (Figure 9A–C). Significant differences in the expression levels of ACAT1 and ACOX2 were observed between these subtypes, while the variation in HADHB expression was not statistically significant (Figure 9D). Heatmap and volcano plot analyses further highlighted significant differences in gene expression profiles between the subtypes (Figure 9E and F). Additionally, distinct patterns of immune infiltration were evident between subtype 1 and subtype 2 (Figure 10A).
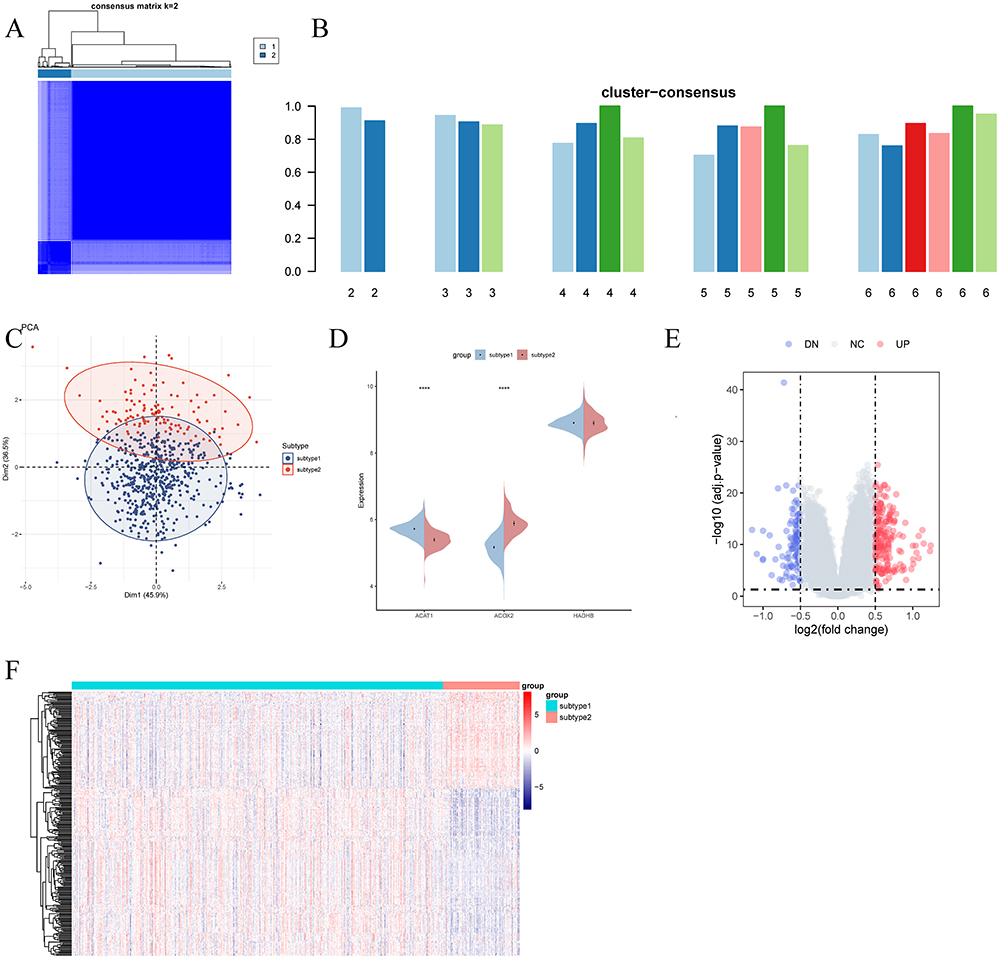 |
Figure 9 Identification and enrichment analysis of fatty acid metabolism-related subtypes. (A) Consensus clustering matrix at k = 2. (B) Consensus scores for each subtype at k = 2 to 6. (C) PCA plot distinguishing subtype 1 (blue) from subtype 2 (red) samples. (D) Split violin plot showing the expression of ACAT1, ACOX2, and HADHB between subtypes. (E and F) Volcano plot (E) and heatmap (F) depicting gene expression patterns between subtypes. Abbreviation: PCA, principal component analysis; Notes: ****p < 0.0001. |
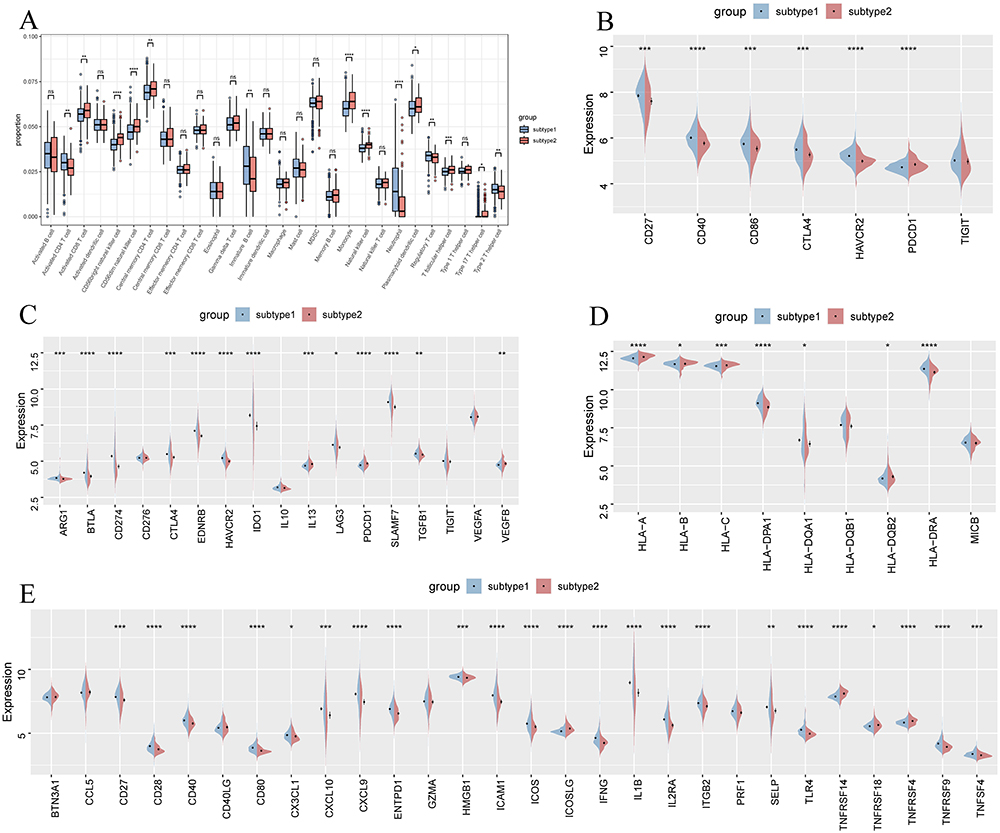 |
Figure 10 (A) Boxplot showing differences in infiltrated immune cells between subtypes. (B–E) Split violin plots displaying the expression levels of immune checkpoint genes (B), immune suppressor genes (C), MHC-related genes (D), and immune activation genes (E) in patients with UC and HC. Abbreviations: UC, ulcerative colitis; HC: healthy controls. ns, not significant. MHC, major histocompatibility complex. Notes: *p < 0.05, **p < 0.01, ***p < 0.001, ****p < 0.0001. |
Distinct Immune and Functional Pathway Patterns Between Fatty Acid Metabolism-Related UC Subgroups
An assessment of immune-related gene expression between the two subtypes revealed that most immunosuppression, immune activation, and MHC-related genes were upregulated in subtype 1. This suggests that fatty acid metabolism-related subtype 1 exhibits a heightened immune response compared to subtype 2 (Figure 10C–E). Additionally, immune checkpoint-associated genes, including CD27, CD40, CD86, CTLA4, and HAVCR2, were significantly elevated in subtype 1, indicating that this subtype might benefit more from immune-based therapies (Figure 10B).
Subsequent GSVA analysis was conducted to explore differences in functional and pathway enrichment between the subtypes. The results showed that subtype 1 exhibited upregulation of pathways such as cytoplasmic stress granule formation, stress granule assembly, negative regulation of cellular amide metabolism, and ribonucleoprotein granule formation. In contrast, subtype 2 showed upregulation in pathways related to acyl-CoA oxidase activity, lysophospholipase activity, response to bile acid, carboxylic ester hydrolase activity, galactose catabolism, carboxylic acid binding, sulfur compound catabolism, and lipase activity (Figure 11A).
 |
Figure 11 (A and B) Differences in enriched biological functions (A) and hallmark pathways (B) between distinct subtypes ranked by t-values of GSVA scores. (C and D) CMap analysis showing the MoA of subtype 1-specific (C) and subtype 2-specific (D) small-molecule compounds. Abbreviations: GSVA, Gene Set Variation Analysis; CMap, the Connectivity Map; MoA, mechanism of action. |
KEGG analysis further highlighted distinct pathway activations between the subtypes. Subtype 1 was characterized by the upregulation of pathways involved in ubiquitin-mediated proteolysis, apoptosis, the JAK-STAT signaling pathway, neurotrophin signaling, and the p53 signaling pathway. Conversely, subtype 2 demonstrated elevated activity in several metabolic pathways, including those related to glycine, serine, threonine, glutathione, alpha-linolenic acid, tyrosine, glycerophospholipids, arachidonic acid, and primary bile acid biosynthesis (Figure 11B).
Prediction of Subtype-Specific Small Molecules and Their Modes of Action
To identify potential therapeutic targets for each subtype, CMap analysis was utilized to predict specific small molecule compounds. For subtype 1, MEK inhibitors such as AS-703026, MEK1-2-inhibitor, PD-0325901, PD-184352, PD-98059, selumetinib, and U-0124 were identified. Additionally, compounds like desoxypeganine, harpagoside, and solanine, which share characteristics of acetylcholinesterase inhibitors, were associated with subtype 1. For subtype 2, predicted small molecule compounds included acetylcholine receptor antagonists such as lobeline, methantheline, and procyclidine, as well as serotonin receptor antagonists like melperone, NAS-181, and palonosetron. Furthermore, substances such as scoulerine, triacsin-c, and yohimbine were identified as adrenergic receptor antagonists (Figure 11C and D).
Discussion
UC is a chronic gastrointestinal disorder marked by persistent inflammation and tissue damage throughout the colonic mucosa, with its exact etiology yet to be fully understood.6 The unclear pathogenesis, absence of reliable biological markers, and variability in treatment responses result in a significant disease burden for many patients with UC. Consequently, there is an urgent need to develop novel, effective diagnostic markers for UC.
Fatty acids, fundamental components of cellular membranes and energy reserves, play a critical role in various physiological processes. The complex relationship between fatty acid metabolism and chronic inflammatory conditions like UC has attracted considerable attention in recent research.6 Disruptions in fatty acid metabolism lead to the accumulation of specific lipid intermediates, which in turn provoke immune responses and exacerbate inflammation21 This accumulation compromises the integrity of the intestinal epithelial barrier, generating inflammatory stimuli and triggering abnormal immune responses. Additionally, imbalances between pro-inflammatory and anti-inflammatory lipid mediators derived from fatty acids further amplify the inflammatory cascade, perpetuating the chronic nature of UC.4 Despite this, the exact role of fatty acid metabolism in UC pathogenesis remains inadequately clarified.
This study provides a comprehensive exploration of the multifaceted role of fatty acid metabolism in UC, highlighting its influence on disease onset, progression, and potential mitigation. Initially, 109 FAM-DEGs were identified using gene expression data from 637 patients with UC and 39 healthy controls (HC) obtained from the GEO database. This discovery underscored the significant role of fatty acid metabolism in exacerbating UC progression. Functional enrichment analysis revealed a marked enrichment in processes associated with fatty acid metabolism, such as fatty acid degradation, carboxylic acid metabolism, and organic acid metabolism, further supporting the critical involvement of these 109 signature genes. Moreover, the gene correlation network demonstrated strong associations among the FAM-DEGs, suggesting that dysregulation in these genes may be a fundamental factor in the onset and progression of UC.
Further analysis of TFs identified ten potential regulators of these signature genes, with validation showing a significant increase in NKX2-3 expression in the colonic tissues of patients with UC. NKX2-3, a homeodomain transcription factor, is closely associated with the development of intestinal lymphoid tissue and the pathogenesis of IBD.22 It is prominently expressed in the ileum and is also commonly observed in the smooth muscle and endothelial cells of the intestines and pancreas, as well as in the colonic lamina propria of adult mice. Notably, nucleotide polymorphisms in the NKX2-3 coding region may confer susceptibility to both UC and Crohn’s disease (CD).23 The NKX2-3 rs4409764 GT genotype, in particular, provides significant protection against UC (OR: 0.18, 95% CI: 0.03–0.93).24 Recent studies on human specimens suggest that NKX2-3 may regulate VAP-1 and TGF-mediated progression of UC.25 Collectively, these findings indicate that NKX2-3 may be a driving force in colitis at the stromal level, implicating NKX2-3+ stromal cells in the maintenance of epithelial homeostasis.
Screening and performance comparison of various machine learning algorithms revealed that the LightGBM and Adaboost models exhibited exceptional diagnostic accuracy. A comprehensive analysis of fatty acid metabolism-related genes at both global and local levels identified seven key genes closely associated with fatty acid metabolism: ACOX2, ACAT1, HADHB, ACOX1, EHHADH, ECH1, and ACADM. Currently, most UC diagnoses rely on clinical symptoms resulting from mucosal damage in the intestines. The development of predictive tools and detailed genetic-level classification of patients with UC could significantly enhance clinical diagnosis and treatment, reducing potential long-term health risks. Consequently, a predictive model for UC was developed based on the seven feature genes, particularly ACAT1, ACOX2, and HADHB, and its reliable predictive capacity was validated.
Peroxisomal acyl-coenzyme A oxidase 2, encoded by the ACOX2 gene, is a key enzyme in fatty acid metabolism, playing a vital role in regulating lipid balance and cellular homeostasis.26 This enzyme facilitates the oxidation of very long-chain fatty acids (VLCFAs) within peroxisomes, preventing the accumulation of harmful lipid intermediates and maintaining lipid homeostasis.27 The potential role of ACOX2 in UC progression warrants careful consideration, as evidence suggests its involvement in regulating inflammation and oxidative stress pathways closely linked to UC progression.28 Disruption of these processes may compromise the integrity of the intestinal epithelial barrier, triggering abnormal immune responses. ACOX2’s role in fatty acid metabolism may also influence the production of bioactive lipid mediators that modulate immune cell activity and inflammatory signaling.29
Acetyl CoA acetyltransferase 1, encoded by the ACAT1 gene, is pivotal in cellular lipid metabolism, catalyzing the conversion of two acetyl CoA molecules into acetoacetyl CoA, a critical step in the synthesis of essential lipids such as cholesterol.30 Emerging research highlights ACAT1’s potential role in UC pathogenesis, given its involvement in lipid metabolism and balance.31 Dysregulation of lipid metabolism is a hallmark of UC.32 As a key contributor to this process, ACAT1 can influence the generation and balance of lipid mediators involved in inflammatory pathways.32 Disruption of lipid metabolism can impair the intestinal mucosal barrier, leading to increased inflammation and abnormal immune responses, thereby advancing UC progression.33 Additionally, genetic variations within the ACAT1 gene may affect its enzymatic activity, influencing lipid metabolism and potentially impacting the disease course or severity.34
The HADHB gene primarily influences fatty acid metabolism within cell mitochondria,35 playing a key role in the oxidation-reduction of fatty acids. Although current research has not established a direct link between HADHB and UC, investigating their potential connection through the lens of fatty acid metabolism could yield valuable insights.
In addition to fatty acid metabolism, the immune response is central to UC pathogenesis. Analysis of immune infiltration revealed a significant increase in immune cell presence within the colonic tissues of patients with UC, consistent with previous research.36 Further examination of the relationship between characteristic genes and immune cells demonstrated strong correlations between ACAT1, ACOX2, HADHB, and a wide range of immune cells. Importantly, two UC subtypes associated with fatty acid metabolism were identified using these three target genes, with subtype 1 notably exhibiting a protective effect against UC.
Moreover, significant differences in gene expression profiles, as well as functional and pathway enrichment, were observed between the two subtypes. Subtype 1 showed upregulation in pathways such as cytoplasmic stress granule formation, stress granule assembly, and ribonucleoprotein granule formation. In contrast, subtype 2 exhibited upregulation in pathways related to acyl-CoA oxidase activity, lysophospholipase activity, bile acid response, carboxylic ester hydrolase activity, galactose catabolism, carboxylic acid binding, sulfur compound catabolism, and lipase activity.
This study successfully screened and validated fatty acid biomarker genes with significant diagnostic potential in UC, leading to the development of a precise predictive model. Notably, this research represents the first categorization of molecular subtypes associated with fatty acid metabolism in UC using characteristic genes, offering new perspectives for early prevention, personalized diagnosis, and treatment of the disease. However, the study has certain limitations. Firstly, the analysis relied on publicly accessible databases, which lack original sequencing data and may introduce selection bias. Secondly, the relatively small sample size makes it difficult to fully exclude potential confounders such as comorbidities, ethnicity, gender, and age. Consequently, further large-scale multicenter prospective studies are required to more thoroughly explore the potential of these characteristic genes in predicting UC.
Conclusion
In summary, this study rigorously examined and validated three pivotal genes—ACAT1, ACOX2, and HADHB—significantly associated with the mechanisms underlying UC onset. Utilizing these genes, a nomogram was developed to accurately predict UC risk. Additionally, a novel classification of molecular subtypes linked to these genes was introduced, providing valuable insights into the mechanisms driving UC. This research not only sheds light on UC pathogenesis and addresses the clinical treatment heterogeneity but also lays the foundation for future risk stratification and personalized precision medicine strategies in UC.
Data Sharing Statement
These data were derived from the following resources available in the public domain: Gene Expression Omnibus (GEO) database (http://www.ncbi.nlm.nih.gov/geo). The corresponding author can be directed for further requirements.
Ethics and Dissemination
Gene Expression Omnibus (GEO) is a public database supported by the National Center for Biotechnology Information (NCBI) at the National Library of Medicine (NLM) of United States. In accordance with the Department of Health and Human Services of United States regulations outlined in 45 CFR 46.101, research using certain publicly available data sets does not involve “human subjects”. The data contained within these specific data sets are neither identifiable nor private and thus do not meet the federal definition of “human subject” as defined in 45 CFR 46.102. This research adheres to these criteria, as the data from GEO are publicly accessible and de-identified. Therefore, this research project does not need to be reviewed and approved by the Institutional Review Board, (IRB).
Acknowledgments
The authors thank the National Cancer Institute for providing the Gene Expression Omnibus (GEO) data set. In addition, the authors would like to thank the editors and the anonymous reviewers for their valuable comments and suggestions to improve the quality of the paper.
Funding
The National Natural Science Foundation of China (No. 82370542) and Natural Science Foundation of Hubei Province (2022CFB703) funded this manuscript.
Disclosure
The authors have no conflicts of interest to declare in this work.
References
1. Buie MJ, Quan J, Windsor JW, et al. Global Hospitalization Trends for Crohn’s Disease and Ulcerative Colitis in the 21st Century: A Systematic Review With Temporal Analyses. Clin Gastroenterol Hepatol. 2023;21(9):
2. Liu S, Zhao W, Lan P, Mou X. The microbiome in inflammatory bowel diseases: from pathogenesis to therapy. Protein Cell. 2021;12(5):
3. Guan Q. A Comprehensive Review and Update on the Pathogenesis of Inflammatory Bowel Disease. J Immunol Res. 2019;2019:
4. Basson AR, Chen C, Sagl F, et al. Regulation of Intestinal Inflammation by Dietary Fats. Front Immunol. 2020;11:
5. Schirmer M, Garner A, Vlamakis H, Xavier RJ. Microbial genes and pathways in inflammatory bowel disease. Nat Rev Microbiol. 2019;17(8):
6. Parada VD, De la Fuente MK, Landskron G, et al. Short Chain Fatty Acids (SCFAs)-Mediated Gut Epithelial and Immune Regulation and Its Relevance for Inflammatory Bowel Diseases. Front Immunol. 2019;10:
7. Krela-Kaźmierczak I, Zakerska-Banaszak O, Skrzypczak-Zielińska M, et al. Where Do We Stand in the Behavioral Pathogenesis of Inflammatory Bowel Disease? The Western Dietary Pattern and Microbiota-A Narrative Review. Nutrients. 2022;14(12). doi:10.3390/nu14122520
8. Scaioli E, Liverani E, Belluzzi A. The Imbalance between n-6/n-3 Polyunsaturated Fatty Acids and Inflammatory Bowel Disease: A Comprehensive Review and Future Therapeutic Perspectives. Int J Mol Sci. 2017;18(12). doi:10.3390/ijms18122619
9. Reddy KV, Naidu KA. Maternal and neonatal dietary intake of balanced n-6/n-3 fatty acids modulates experimental colitis in young adult rats. Eur J Nutr. 2016;55(5):
10. He J, Zhang P, Shen L, et al. Short-Chain Fatty Acids and Their Association with Signalling Pathways in Inflammation, Glucose and Lipid Metabolism. Int J Mol Sci. 2020;21(17). doi:10.3390/ijms21176356
11. Vila IK, Chamma H, Steer A, et al. STING orchestrates the crosstalk between polyunsaturated fatty acid metabolism and inflammatory responses. Cell Metab. 2022;34(1):
12. Liu S, Zhang H, Li Y, et al. S100A4 enhances protumor macrophage polarization by control of PPAR-γ-dependent induction of fatty acid oxidation. J Immunother Cancer. 2021;9(6). doi:10.1136/jitc-2021-002548
13. Chen Y, Zhang J, Cui W, Silverstein RL. CD36, a signaling receptor and fatty acid transporter that regulates immune cell metabolism and fate. J Exp Med. 2022;219(6). doi:10.1084/jem.20211314
14. Sabatier M, Birsen R, Lauture L, et al. C/EBPα Confers Dependence to Fatty Acid Anabolic Pathways and Vulnerability to Lipid Oxidative Stress-Induced Ferroptosis in FLT3-Mutant Leukemia. Cancer Discov. 2023;13(7):
15. Deleu S, Machiels K, Raes J, Verbeke K, Vermeire S. Short chain fatty acids and its producing organisms: An overlooked therapy for IBD? EBioMedicine. 2021;66:
16. Szklarczyk D, Morris JH, Cook H, et al. The STRING database in 2017: quality-controlled protein-protein association networks, made broadly accessible. Nucleic Acids Res. 2017;
17. Shannon P, Markiel A, Ozier O, et al. Cytoscape: a software environment for integrated models of biomolecular interaction networks. Genome Res. 2003;13(11):
18. Chin CH, Chen SH, Wu HH, Ho CW, Ko MT. cytoHubba: identifying hub objects and sub-networks from complex interactome. BMC Syst Biol. 2014;8(Suppl 4):
19. Keenan AB, Torre D, Lachmann A, et al. ChEA3: transcription factor enrichment analysis by orthogonal omics integration. Nucleic Acids Res. 2019;47(W1):
20. Wei S, Wu X, Chen M, et al. Exosomal-miR-129-2-3p derived from Fusobacterium nucleatum-infected intestinal epithelial cells promotes experimental colitis through regulating TIMELESS-mediated cellular senescence pathway. Gut Microbes. 2023;15(1):
21. Liu X, Zhang Y, Li W, et al. Fucoidan Ameliorated Dextran Sulfate Sodium-Induced Ulcerative Colitis by Modulating Gut Microbiota and Bile Acid Metabolism. J Agric Food Chem. 2022;70(47):
22. Pabst O, Förster R, Lipp M, Engel H, Arnold HH. NKX2.3 is required for MAdCAM-1 expression and homing of lymphocytes in spleen and mucosa-associated lymphoid tissue. EMBO J. 2000;19(9):
23. Lu X, Tang L, Li K, et al. Contribution of NKX2-3 polymorphisms to inflammatory bowel diseases: a meta-analysis of 35358 subjects. Sci Rep. 2014;4:
24. Luu LDW, Popple G, Tsang SPW, et al. Genetic variants involved in innate immunity modulate the risk of inflammatory bowel diseases in an understudied Malaysian population. J Gastroenterol Hepatol. 2022;37(2):
25. Hsia LT, Ashley N, Ouaret D, Wang LM, Wilding J, Bodmer WF. Myofibroblasts are distinguished from activated skin fibroblasts by the expression of AOC3 and other associated markers. Proc Natl Acad Sci U S A. 2016;113(15):
26. Zhang Y, Chen Y, Zhang Z, et al. Acox2 is a regulator of lysine crotonylation that mediates hepatic metabolic homeostasis in mice. Cell Death Dis. 2022;13(3):
27. Ferdinandusse S, Denis S, van Roermund C, et al. A novel case of ACOX2 deficiency leads to recognition of a third human peroxisomal acyl-CoA oxidase. Biochim Biophys Acta Mol Basis Dis. 2018;1864(3):
28. Sharma RS, Harrison DJ, Kisielewski D, et al. Experimental Nonalcoholic Steatohepatitis and Liver Fibrosis Are Ameliorated by Pharmacologic Activation of Nrf2 (NF-E2 p45-Related Factor 2). Cell Mol Gastroenterol Hepatol. 2018;5(3):
29. Kelkka T, Tyster M, Lundgren S, et al. Anti-COX-2 autoantibody is a novel biomarker of immune aplastic anemia. Leukemia. 2022;36(9):
30. Goudarzi A. The recent insights into the function of ACAT1: A possible anti-cancer therapeutic target. Life Sci. 2019;232:
31. Gu L, Zhu Y, Lin X, Tan X, Lu B, Li Y. Stabilization of FASN by ACAT1-mediated GNPAT acetylation promotes lipid metabolism and hepatocarcinogenesis. Oncogene. 2020;39(11):
32. Sung J, Alghoul Z, Long D, Yang C, Merlin D. Oral delivery of IL-22 mRNA-loaded lipid nanoparticles targeting the injured intestinal mucosa: A novel therapeutic solution to treat ulcerative colitis. Biomaterials. 2022;288:
33. Szántó M, Gupte R, Kraus WL, Pacher P, Bai P. PARPs in lipid metabolism and related diseases. Prog Lipid Res. 2021;84:
34. Peng K, Wang S, Liu R, et al. Effects of UBE3A on Cell and Liver Metabolism through the Ubiquitination of PDHA1 and ACAT1. Biochemistry. 2023;62(7):
35. Sekine Y, Yamamoto K, Kurata M, et al. HADHB, a fatty acid beta-oxidation enzyme, is a potential prognostic predictor in malignant lymphoma. Pathology. 2022;54(3):
36. Huo A, Wang F. Biomarkers of ulcerative colitis disease activity CXCL1, CYP2R1, LPCAT1, and NEU4 and their relationship to immune infiltrates. Sci Rep. 2023;13(1):
 © 2024 The Author(s). This work is published and licensed by Dove Medical Press Limited. The
full terms of this license are available at https://www.dovepress.com/terms.php
and incorporate the Creative Commons Attribution
- Non Commercial (unported, 3.0) License.
By accessing the work you hereby accept the Terms. Non-commercial uses of the work are permitted
without any further permission from Dove Medical Press Limited, provided the work is properly
attributed. For permission for commercial use of this work, please see paragraphs 4.2 and 5 of our Terms.
© 2024 The Author(s). This work is published and licensed by Dove Medical Press Limited. The
full terms of this license are available at https://www.dovepress.com/terms.php
and incorporate the Creative Commons Attribution
- Non Commercial (unported, 3.0) License.
By accessing the work you hereby accept the Terms. Non-commercial uses of the work are permitted
without any further permission from Dove Medical Press Limited, provided the work is properly
attributed. For permission for commercial use of this work, please see paragraphs 4.2 and 5 of our Terms.