")
Back to Journals » Journal of Pain Research » Volume 18
Variability in Pain Traits Among Young Individuals with High and Low Pain Sensitivity
Authors Zhi Y, Mao Z, Zhang M , Kong Y
Received 4 April 2025
Accepted for publication 28 June 2025
Published 8 July 2025 Volume 2025:18 Pages 3439—3450
DOI https://doi.org/10.2147/JPR.S529198
Checked for plagiarism Yes
Review by Single anonymous peer review
Peer reviewer comments 2
Editor who approved publication: Dr Jonathan Greenberg
Yongkang Zhi,1,2 Ziyu Mao,1,2 Ming Zhang,1,2 Yazhuo Kong1– 3
1State Key Laboratory of Cognitive Science and Mental Health, Institute of Psychology, Chinese Academy of Sciences, Beijing, 100101, People’s Republic of China; 2Department of Psychology, University of Chinese Academy of Sciences, Beijing, 100049, People’s Republic of China; 3Wellcome Centre for Integrative Neuroimaging, FMRIB, Nuffield Department of Clinical Neurosciences, University of Oxford, Oxford, OX3 9DU, UK
Correspondence: Ming Zhang, Institute of Psychology, Chinese Academy of Sciences, 16 Lincui Road, Chaoyang District, Beijing, 100101, People’s Republic of China, Email [email protected]
Objective: Pain is a complex experience involving sensory, emotional, and cognitive components, with significant variability in sensitivity across individuals. Pain sensitivity is closely linked to pain-related traits, which influence how pain is perceived. However, it remains unclear whether differences in these traits exist between individuals with high or low pain sensitivity, which could have implications for predicting pain disorders.
Methods: This study aimed to examine the variability of pain-related traits in individuals with high or low pain sensitivity, using both self-report measures and quantitative sensory tests in a sample of 92 healthy young adults. Based on scores from the Pain Sensitivity Questionnaire (PSQ) and Somatosensory Sensitivity Scales (SeSS), participants were classified into high and low pain sensitivity groups using Gaussian Mixture Modeling. Subsequently, a range of pain-related measures—including pressure pain threshold (PPT), pain tolerance threshold (PTT), mechanical detection threshold (MDT), mechanical pain threshold (MPT), pain catastrophizing (PCS), and pain vigilance (PVAQ)—were used to examine interrelationships among traits across the two sensitivity groups.
Results: Our findings show that self-reported pain sensitivity mediated the relationship between pain threshold and pain catastrophizing. Notably, we identified distinct patterns in the correlations of pain-related traits between high and low sensitivity groups. In the high sensitivity group, pain-related cognitive traits were strongly correlated, while in the low sensitivity group, sensory traits were more prominent.
Conclusion: These findings provide valuable insights into developing more effective pain coping strategies by considering differentiated sensitivity, particularly for individuals with chronic pain.
Keywords: pain sensitivity, pain threshold, pain catastrophizing, pain component
Introduction
Pain is a subjective experience composed of sensory, emotional, and cognitive dimensions.1 The sensory dimension relates to the biological aspects of pain, such as its intensity and location, while the emotional dimension refers to an individual’s feelings about pain, such as its unpleasantness.2 The cognitive dimension, in contrast, involves thoughts about the meaning of pain, both in the present and future.3 This complexity causes pain to be influenced by a variety of biological and psychological factors, leading to significant variability in pain sensitivity among individuals.4
Pain sensitivity is thought to be a characteristic specific to each individual relating to how they perceive or react to painful stimuli,5 and can predict how a healthy individual might rate the intensity of pain.6 Pain sensitivity has been linked to changes in the structure and connectivity of brain regions involved in sensory processing.7 Clinically, it is often used to predict chronic and postoperative pain.8 Previous research has shown that individuals with high or low pain sensitivity will respond differently to the same noxious stimulus, with differences observed in self-reported pain levels as well as in the brain regions associated with sensory, emotional, and cognitive aspects of pain.4 When comparing subjective ratings of specific ranges of thermal and pressure stimuli between older and younger adults, we observed that older adults exhibited significantly lower sensitivity to thermal pain compared to younger adults, whereas no significant difference was found for pressure pain.9 These evidences suggest that individuals with high or low pain sensitivity may also differ in multiple dimensions of pain perception.
Pain-related traits play a critical role in shaping pain perception.10,11 Traits typically refer to variables that are temporally stable within an individual or group. In pain-related research, variables such as pain catastrophizing,12 pain vigilance,13 quantitative sensory testing (QST),14,15 and pain sensitivity, among other relevant variables, demonstrate consistent individual differences, as supported by longitudinal and psychometric evidence. An individual’s awareness to pain, for example, can influence how they assess a pain stimulus.16 Those with higher pain vigilance are more likely to develop chronic pain disorders.13,17 Catastrophizing – anticipating or exaggerating the consequences of pain – is another maladaptive thinking pattern linked to pain.18 This can lead to increased fear of pain, which in turn will intensify one’s pain experience in clinical settings.19 Research has shown that pain sensitivity correlates with other pain-related traits in healthy individuals,20 and it is thought to predict the strength of fear responses to noxious stimuli.7,21 Pain-related fear is often used to explain the progression from acute to chronic pain.22 While high pain sensitivity is commonly observed in chronic pain patients and is correlated with altered pain thresholds (eg, thermal or cold pain),20,23,24 it is not typically seen in healthy individuals.25 These findings suggest that differences in pain-related traits between high and low pain sensitivity individuals may provide valuable insights for predicting pain disorders.
Previous studies focused on the classification of pain sensitivity have, for the most part, been built based on pain thresholds elicited by high-intensity somatosensory stimulation.26,27 An absence of a direct correlation between pain threshold and pain-related traits (eg, pain catastrophizing) was revealed,28 leaving a poor explanation between these dimensions and sensitivity. Considering that pain threshold is a perception of pain that involves complex sensory processing, rather than a simple response to stimulus intensity,1 this study used the Pain Sensitivity Questionnaire (PSQ), which assesses responses to imagined painful everyday situations,25 to classify individuals into either a low or high pain sensitivity group by applying Gaussian mixture modeling. Then, the relationship between pain-related traits (eg, pain threshold, tolerance, vigilance, and catastrophizing) was examined to explore how these traits varied across individuals with low and high pain sensitivity. Considering that pain has three (ie, sensory, emotional, and cognitive) components,1 we expected connections among these traits related different components to differ between high and low sensitivity groups. In different high and low sensitivity groups, these pain-related traits across dimensions would be positively intercorrelated, indicating a shared disposition toward amplified pain processing. Moreover, we anticipated that cognitive–affective factors (catastrophizing and vigilance) would mediate the relationship between sensory thresholds and experimentally induced pain reports.
Methods
Participants
A power analysis conducted in G*Power Version 3.1 determined that a sample size of 84 participants (42 per group) was required to detect a moderate effect (Cohen’s d = 0.80).29 After excluding 6 participants who did not complete the full experiment, a total of 92 participants (aged 22 to 27) took part in this study (Table 1). Participants were instructed to refrain from consuming alcohol or pain medications for the 24 hours preceding the study.30 Informed consent was obtained from all participants, and all were compensated for their participation upon completion of the required tasks.
 |
Table 1 Participants’ Demographics and Pain-Related Variables |
Self-Reported Pain Questionnaires
Pain Sensitivity Questionnaire (PSQ)
The PSQ comprises 17 items assessing the respondent’s perception of various imagined physical stimuli that could be experienced in daily life (eg, “Imagine you bump your shin badly on a hard edge. How painful would that be for you?”;31 Cronbach’s α = 0.93). Respondents rated the pain intensity of each scenario on a numeric rating scale ranging from 0 (“no pain”) to 10 (“the worst pain imaginable”). Three items (ie, items 5, 9, and 13) describe non-painful situations, act as control items, thus their scores are excluded while calculating the total score. The remaining 14 item scores are used to calculate the total PSQ score, which can then serve as a measure of pain sensitivity.
Pain Catastrophizing Scale (PCS)
The PCS consists of 13 items, and is used to quantify the thoughts and feelings the respondent associates with pain (eg, “I worry all the time about whether the pain will end”;32 Cronbach’s α = 0.93). The PCS has been shown to be positively correlated with respondents’ risk of developing chronic pain.33 Respondents are asked to indicate the degree to which they have the described thoughts or feelings when experiencing pain by rating each item on a numeric rating scale ranging from 0 (“not at all”) to 4 (“all the time”). The PCS comprises three subscales: helplessness (feeling unable to cope effectively with pain, items 1 to 5, and 12), magnification (the exaggeration of perceived pain-related threats, items 6, 7, and 13), and rumination (the tendency to focus on pain, items 8 to 11).
Pain Vigilance and Awareness Questionnaire (PVAQ)
The PVAQ is made up of 16 items which measure respondents’ attention and awareness of pain (eg, “I am very sensitive to pain”;17 Cronbach’s α = 0.80), and its total score is considered to be indicative of a respondent’s degree of pain hypervigilance.34 Respondents rate how frequently they experience each described sensation on a numeric rating scale ranging from 0 (“never”) to 5 (“always”).
Somatosensory Sensitivity Scales (SeSS)
The SeSS consists of three subscales which measure respondents’ sensitivity to auditory (10 items), visual (10 items), and somatosensory stimuli (15 items).35 In this study, only the somatosensory subscale was used, which includes items related to touch (eg, “I do not like walking barefoot on a carpet”, 9 items), pain (eg, “I cannot hold a hot tea cup”, 4 items), and itch (eg, “Wool sweaters make me itchy”, 2 items), with a Cronbach’s α = 0.79. As no formal Chinese version of the scale currently existed, we first conducted a translation process to ensure its cultural and linguistic appropriateness. Two bilingual experts first translated the scale into Chinese, after which a third expert re-translated it back into English. The back-translated version of the scale was then sent to the original author to confirm the intent of all items remained unchanged. To further validate the translated scale, after the current study was completed, an additional 74 participants (45 females, age = 23.59 ± 0.98 years, rangeage = 22–27 years) who had not participated in the current study were recruited to complete the Chinese-translated SeSS, resulting in a Cronbach’s α of 0.78 and an intra-class correlation coefficient of 0.80 for test-retest reliability.
Experimental Pain Threshold
Mechanical Detection and Mechanical Pain Thresholds
Participants’ mechanical detection threshold (MDT) and mechanical pain threshold (MPT) were assessed using von Frey filaments (Semmes-Weinstein monofilament set, Aesthesio, USA), which includes 20 filaments of varying diameters (sizes 1.65 to 6.65), corresponding to forces ranging from 0.008 to 300 g. The filament was applied vertically to the centre of the dorsum of the hand, with pressure increasing gradually until the filament bowed.36 This process took approximately one second.
Both the MDT and MPT were measured using the method of limits,37 with filaments applied randomly to either the left or right hand. Each filament size was applied to the participant’s arm thrice, with an interval of approximately 1 s between each filament application. The first filament perceived by the participant (indicated by them saying “yes”) was recorded as the supra-threshold value. Then, filaments were applied in decreasing order of force until the participant no longer perceived the sensation (indicated by them saying “no”) to mark the infra-threshold value.38 The MDT and MPT were then calculated by taking the geometric means of the eight values (four supra-threshold and four infra-threshold); specifically, these values were multiplied together, and the eighth root was taken to determine each participant’s mechanical detection and pain thresholds.39
Pressure Pain Threshold and Pressure Pain Tolerance
Participants’ pressure pain threshold (PPT) and pressure tolerance threshold (PTT) were assessed on the thenar eminence of the hand opposite the one used to test the MDT and MPT using a handheld algometer (probe diameter = 1 cm; FPX200, Wagner Instruments, USA). The participant was instructed to indicate when they first felt pain, at which point the pressure was immediately released.37 The pressure value recorded at this point was noted as the PPT. This procedure was repeated five times, with a 30-second rest period between trials.
Similarly, the PTT was measured by gradually increasing the pressure until the participant reported it as being “unbearable.” The pressure was then stopped, and the value was recorded as the PTT. This process was also repeated five times, with a 60-second rest period between each trial.28 The final PPT and PTT values were calculated as the mean of the five trials.
Procedure
After providing their informed consent, participants first completed the PSQ, PCS, PVAQ, and SeSS questionnaires (Figure 1). Next, the MDT and MPT were assessed on the dorsum of the participant’s right or left hand using von Frey filaments; 55 participants were tested on the left hand and 37 on their right. Following these tests, the PPT and PTT were measured on the palm of the participant’s opposite hand, at the thenar eminence. All participants were instructed to keep their eyes closed throughout the mechanical stimuli assessment procedure to minimize perceptual bias.
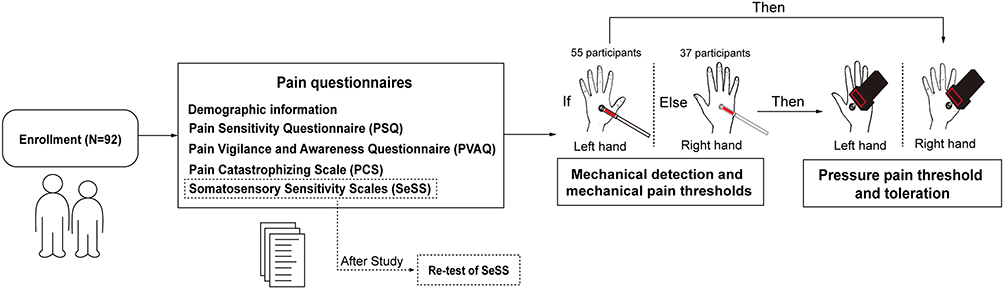 |
Figure 1 Flowchart of the current study. |
Statistical Analysis
All statistical analyses were performed using IBM SPSS Statistics version 26.0 (IBM Corp., Armonk, NY, USA). Descriptive statistics (including the Kolmogorov–Smirnov test) were first computed for all primary variables. The PROCESS macro (version 3.5 by Andrew F. Hayes) was used for mediation analysis, which was conducted using a bias-corrected bootstrap procedure (5,000 resamples), with 95% confidence intervals (CI) to determine the significance of indirect effects. Then, pain sensitivity classes were divided by the Gaussian Mixed Model (GMM). Group differences in pain traits and experimental pain thresholds were examined using independent-sample t-tests and Pearson correlations. Finally, the correlation coefficients derived from the correlation analysis of the two groups of subjects were subjected to a Fisher’s Z-test to compare the similarities and differences between the relationships of the pain-related variables between the two groups. All statistical tests were two-tailed, with a significance level set at p < 0.05.
Results
Associations Between Pain Assessment Dimensions
First, data normality was assessed using the Kolmogorov–Smirnov test (Table 1), with data points beyond three standard deviations from the mean treated as missing values. Pearson correlation analysis revealed that the variables of pain cognitive dimensions were correlated (see Table S1). Specifically, the PSQ score was strongly positively correlated with both the PCS score (R2 = 0.42, p < 0.001) and the PVAQ score (R2 = 0.30, p = 0.002). Additionally, the PVAQ score was significantly positively correlated with the PCS score (R2 = 0.48, p < 0.001). Significant positive correlations were also observed between the pain sensory dimension variables, that is, the peripheral sensibility thresholds, the PPT and PTT values (R2 = 0.66, p < 0.001), as well as the MDT and MPT values (R2 = 0.37, p < 0.001). Regarding the SeSS results, the pain subscale score was positively correlated with those of the other two subscales: tactile (SeSS-tactile: R2 = 0.37, ptactile < 0.001) and itch (SeSS-itch: R2 = 0.29, pitch = 0.003).
The analysis also revealed associations between the cognitive and sensory dimensions of pain perception. Significant negative correlations were found between the PSQ score and the MPT value (R2 = –0.29, p = 0.002), between the PVAQ score and the MDT value (R2 = –0.24, p = 0.013), and between the PVAQ score and the MPT value (R2 = –0.19, p = 0.048). These results suggest that individuals with greater sensitivity to mechanical stimuli tend to have higher levels of subjective pain cognition. In contrast, a significant positive correlation was observed between the PVAQ score and the PTT value (R2 = 0.28, p = 0.004), indicating that individuals who are more vigilant toward pain may have a higher tolerance for pressure pain. Additionally, significant positive correlations were found between the PSQ and SeSS-pain scores (R2 = 0.42, p < 0.001), suggesting that greater pain sensitivity is aligned with heightened somatosensory sensitivity.
Given the complex relationship between the cognitive and sensory dimensions of pain perception, the mediation analysis was conducted using Process (version 4.2) in SPSS 23. Pain sensory dimension (ie, thresholds, quantified by the MDT/MPT/PPT/PTT) was set as the independent variable, specific cognitive pain dimensions (ie, the PCS) as the dependent variable, and the other cognitive dimensions (ie, the PSQ, the PVAQ) as potential mediators. Age and temperature were included as control variables. The bootstrapping method (5,000 samples, Model 6) was employed for significance testing.40,41 The results indicated that the PSQ and the PVAQ mediated the relationship between the MPT and the PCS (R2 = 0.17, MSE = 496.26, F(5,84) = 4.21, p = 0.004, Figure 2). Specifically, two indirect pathways were identified: (1) from the MPT to the PSQ, and then to the PCS (indirect effect = −0.10, 95% CI = [−0.2189, −0.0157]), and (2) from the MPT to the PSQ, then to the PVAQ, and finally to the PCS (indirect effect = −0.028, 95% CI = [−0.0693, −0.0021]). These findings suggest that a greater sensitivity to mechanical pain is associated with a higher level of pain catastrophizing, with subjective pain sensitivity playing a key regulatory role.
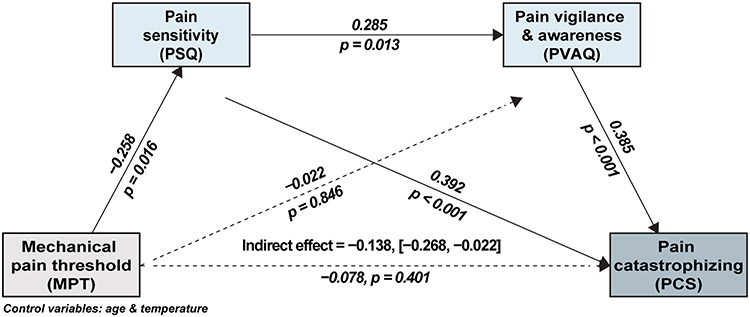 |
Figure 2 Pain sensitivity and vigilance mediating the mechanical pain threshold negative effect on pain catastrophizing. |
Pain Sensitivity Classes Divided by the Gaussian Mixed Model (GMM)
Building on the observed effects of pain sensitivity revealed in the mediation analysis and its relevance to pain perception,42 a GMM analysis was conducted to investigate pain characteristics across different sensitivity groups. This analysis was performed using the scikit-learn package (version 1.5.2) in Python 3.10.5.43 The mixture model was applied to the PSQ and SeSS pain subscale scores to define distinct pain sensitivity classes and assign participants accordingly. To identify the optimal model, two criteria were used: (1) the absence of spurious classes and (2) the lowest Bayesian Information Criterion (BIC) value.44
The model with two classes, yielding the lowest BIC value of 32.54, was selected as the best-fitting model. The two identified classes were labeled low pain sensitivity (LPS; PSQ: 54.13 ± 13.35, SeSS-pain: 9.30 ± 2.42, n = 47) and high pain sensitivity (HPS; PSQ: 91.93 ± 15.69, SeSS-pain: 13.24 ± 2.69, n = 45), which aligns with previous study results.21 Independent samples t-tests confirmed that the PSQ and SeSS-pain scores differed significantly between the two groups: t(90) = –12.47, pPSQ <0.001; t(90) = –7.40, pSeSS-pain < 0.001, validating the grouping (Figure 3A).
 |
Figure 3 High and low sensitivity grouping. (A) Grouping according to GMM. (B) Discrepancy in pain-related traits across LPS and HPS. Abbreviations: LPS, low pain sensitivity; HPS, High pain sensitivity. Notes: *p < 0.05, ***p < 0.005. |
Variability in Pain Traits Correlations Across High and Low Sensitivity Groups
Next, pain-related traits in both cognitive and sensory dimensions were compared between the HPS and LPS groups. Independent samples t-tests showed that the HPS group had significantly higher scores on several pain-related cognitive dimensions than the LPS group: PVAQ (40.56 ± 8.94 vs 34.32 ± 7.48), t(90) = 3.64, p < 0.001; PCS (26.71 ± 9.89 vs 15.79 ± 8.95), t(90) = 5.56, p < 0.001; SeSS-itch (6.18 ± 2.05 vs 5.06 ± 2.19), t(90) = 2.52, p = 0.014; SeSS-tactile (21.22 ± 5.31 vs 17.53 ± 6.18), t(90) = 3.07, p = 0.003 (Figure 3B). Additionally, the MPT value was significantly lower in the HPS group (3.91 ± 0.53 vs 4.22 ± 0.73), t(90) = –2.30, p = 0.024, confirming the accuracy of the groupings. These findings suggest that individuals with higher pain sensitivity also tend to exhibit elevated levels of other pain-related traits in both cognitive and sensory dimensions.
Interestingly, variability was observed in the correlations of the different pain-related traits between the HPS and LPS groups. When examining correlations within each group (Figure 4A), a significant positive correlation was found between pain vigilance and pain catastrophizing in the HPS group (R2 = 0.61, p < 0.001), but no such correlation was seen in the LPS group (R2 = 0.17, p = 0.262). The results of the test for comparing correlations (https://www.psychometrica.de/correlation.html) showed that the difference in correlation exponents was statistically significant (Z = 2.49, p = 0.006, Figure 4B). In contrast, in the LPS group, significant positive correlations were observed between the MPT and MDT, SeSS-pain and SeSS-itch, and SeSS-tactile and SeSS-itch, but these correlations were absent in the HPS group (LPS: R2 = 0.43, p = 0.003 vs HPS: R2 = –0.13, p = 0.400, Z = –2.738, pMPTandMDT = 0.003; LPS: R2 = 0.36, p = 0.014 vs HPS: R2 = 0.01, p = 0.956, Z = –1.701, pSeSS-painanditch = 0.044; LPS: R2 = 0.28, p = 0.057 vs HPS: R2 = –0.19, p = 0.223; Z = –2.225, pSeSS-tactileanditch = 0.013). These findings suggest that cognitive pain traits are more strongly correlated in those experiencing HPS, while sensory pain traits show stronger correlations in those experiencing LPS.
 |
Figure 4 Variability in pain trait correlations across high and low sensitivity groups. (A) Pain-related variable correlations between the two groups. (B) Comparisons of correlations between the two groups. Notes: Pain toleration = PTT value subtracted from PPT value, *p < 0.05; **p < 0.01; ***p < 0.005. |
Discussion
This study explored variability in pain-related traits across low and high pain sensitivity groups using various pain scales as well as quantitative sensory tests. Pain sensitivity was found to mediate the relationship between pain thresholds (measured by mechanical pain) and pain catastrophizing. Specifically, individuals with a higher level of pain sensitivity also exhibited higher scores on cognitive pain-related traits. More importantly, distinct patterns were observed in the correlations of pain-related traits. In the HPS group, cognitive pain traits were significantly correlated, while sensory pain traits showed stronger correlations in the LPS group. This suggests that cognitive traits are more interrelated in individuals with high pain sensitivity, while sensory traits are more interrelated in those with low pain sensitivity.
As a sensory component of pain, pain threshold (measured in this study by mechanical pain) influences pain catastrophizing through its interaction with self-reported pain sensitivity. Pain catastrophizing, which involves the tendency to amplify negative pain experiences,45 has been linked to greater pain sensitivity.46 Individuals who report higher cognitive pain sensitivity tend to experience more negative emotions in response to pain, resulting in worse pain outcomes.47 Pain sensitivity is also negatively correlated with pain threshold, in that the lower one’s pain threshold, the more easily they will perceive pain.45 Actually, while pain threshold reflects the sensory aspect of pain sensitivity, the PSQ score reflects its cognitive aspect. Given these connections, it is logical that the PSQ mediates the relationship between pain threshold and pain catastrophizing. Although we tested both the mechanical pain threshold and the pressure pain threshold, we observed a mediation effect for only the mechanical pain threshold. It should be noted that while both the mechanical pain threshold and pressure pain threshold are measured using pressure-based threshold testing,48 but the mechanical pain threshold has a smaller application area than the pressure pain threshold,49 and as a result, the mechanical pain threshold may be more sensitive, making its relationship with pain catastrophizing easier to detect.
We found that individuals with higher pain sensitivity exhibited greater pain-related traits compared to those with lower sensitivity (Figure 3B). This suggests that high pain sensitivity is linked to a range of maladaptive effects that exacerbate pain. Pain is a complex experience involving both sensory and emotional-cognitive components46 which together shape an individual’s response to noxious stimuli. For example, in our previous research, we found that negative emotions induced by social rejection could heighten individuals’ pain ratings for simultaneously perceived thermal stimuli.50 People with high pain sensitivity are more vulnerable to pain and tend to display more pronounced pain-related traits.48,49 These traits, in turn, influence pain perception during painful experiences.51 Over time, this interplay between sensitivity and pain traits can lead to a cycle of heightened sensitivity and increased pain-related traits, highlighting the multi-dimensional nature of experiencing pain.
This study also revealed differences in the correlations of pain-related traits between the HPS and LPS groups. Consistent with the findings of previous studies which have shown significant positive correlations among pain-related traits,13,17,52 our findings demonstrated that cognitive pain traits (as quantified by the PCS and PVAQ) were strongly correlated in the high pain sensitivity group. This suggests that individuals with high pain sensitivity exhibit greater consistency in their cognitive pain-related traits. The PCS measures respondents’ negative thoughts about pain,53 while the PVAQ reflects respondents’ tendency to focus on pain.54 Both traits, which reflect the cognitive aspect of pain, are known to contribute to the development of chronic pain.55 As noted earlier, cognitive traits can interact to worsen pain perception,51 potentially leading to increased pain sensitivity after pain exposure. Thus, cognitive pain traits may co-vary with high pain sensitivity.
In contrast, sensory pain traits (ie, the MPT and MDT, or the SeSS-itch and SeSS-pain) were found to be significantly correlated in the low pain sensitivity group. This suggests that individuals with low pain sensitivity have greater consistency in their sensory pain traits. Pain threshold, a key measure of the sensory-discriminative component of pain,56,57 is associated with one’s detection and reflexive response to noxious stimuli.58 Similarly, the itch and pain subdomains of the SeSS reflect one’s sensitivity to somatic sensory stimuli.59 These traits all involve responses to direct sensory stimulation. For individuals with low pain sensitivity, pain perception is relatively straightforward, driven primarily by noxious stimuli. Therefore, in the current study, sensory pain traits tended to be interrelated in the low pain sensitivity group.
The discrepancies between the two groups suggest that individuals with low pain sensitivity show more consistent perceptions across different sensory components of experiencing pain, while those with high pain sensitivity are more likely to exhibit correlated perceptions across cognitive components of experiencing pain, specifically. This difference may reflect the influence of cognitive processes on pain perception.35 In individuals with high pain sensitivity, cognitive factors may modulate the way they process noxious stimuli, leading to a more intense pain experience.60,61 Comparatively, individuals with low pain sensitivity tend to perceive noxious stimuli in a more straightforward and less amplified manner.62
This study has several limitations that should be noted. First, although the sample size is acceptable, it is still relatively small. Future studies should use larger sample sizes to help enhance the generalizability of the findings. Second, participants in this study were limited to college students, which restricts the generalizability of our findings to older adults or clinical populations. Prior research indicates that pain sensitivity and related psychological traits may vary systematically across the lifespan.63 For instance, older individuals typically exhibit higher sensory thresholds (ie, lower pain sensitivity) and lower levels of pain catastrophizing compared to younger adults.64–66 These findings suggest that pain traits are not uniformly stable across age groups. Therefore, the conclusions of the present study, while informative, should be interpreted as primarily applicable to young, healthy adults. Future studies should include more age-diverse and clinical samples to validate pain traits’ stability and clinical relevance across the lifespan. Third, this study did not include measurements of emotional components of pain, nor of other relevant variables, such as pain anxiety. To do so in future research could provide us with a more comprehensive understanding of a wider range of the traits of pain.
Conclusions
This study identifies an interesting discrepancy in pain traits, specifically between those young healthy adults with a low or high sensitivity to pain. Cognitive pain traits were correlated in the high pain sensitivity group, while sensory pain traits were correlated in the low pain sensitivity group. Given that experimental pain sensitivity is often linked to clinical pain sensitivity,54 these findings offer valuable insights for clinical practice by suggesting that effective coping strategies should be tailored to the specific sensitivity profile of the individual. For instance, cognitive-behavioral therapy can assist highly sensitive individuals in reframing maladaptive thoughts related to pain. In contrast, physical therapy may serve as an effective modality for pain modulation.
Data Sharing Statement
The data and the codes used in this study are available at: https://doi.org/10.57760/sciencedb.psych.00393.
Ethical Statement
The study procedures were approved by the Institutional Review Board of the Institute of Psychology at the Chinese Academy of Sciences (No. H22139) and adhered to the ethical standards of the Helsinki Declaration.
Author Contributions
All authors made a significant contribution to the work reported, whether that is in the conception, study design, execution, acquisition of data, analysis and interpretation, or in all these areas; took part in drafting, revising or critically reviewing the article; gave final approval of the version to be published; have agreed on the journal to which the article has been submitted; and agree to be accountable for all aspects of the work.
Funding
This research was supported by the National Key R&D Program of China (2022YFC3601700) and the National Natural Science Foundation of China (32100861, 82030121, 82072010) and the Beijing Natural Science Foundation (IS23108).
Disclosure
The authors declare no conflicts of interest in this work.
References
1. Riello M, Cecchini MP, Zanini A, Di Chiappari M, Tinazzi M, Fiorio M. Perception of phasic pain is modulated by smell and taste. Eur J Pain. 2019;23(10):1790–1800. doi:10.1002/ejp.1453
2. Talbot K, Madden VJ, Jones SL, Moseley GL. The sensory and affective components of pain: are they differentially modifiable dimensions or inseparable aspects of a unitary experience? A systematic review. Br J Anaesth. 2019;123(2):e263–e272. doi:10.1016/j.bja.2019.03.033
3. Petrini L, Arendt-Nielsen L. Understanding Pain Catastrophizing: putting Pieces Together. Front Psychol. 2020;11:603420. doi:10.3389/fpsyg.2020.603420
4. Niddam DM, Wang SJ, Tsai SY. Pain sensitivity and the primary sensorimotor cortices: a multimodal neuroimaging study. Pain. 2021;162(3):846–855. doi:10.1097/j.pain.0000000000002074
5. Ostrom C, Bair E, Maixner W, et al. Demographic Predictors of Pain Sensitivity: results From the OPPERA Study. J Pain. 2017;18(3):295–307. doi:10.1016/j.jpain.2016.10.018
6. Bell BA, Ruscheweyh R, Kelley BJ, Ness TJ, Vetter TR, Sellers AB. Ethnic Differences Identified by Pain Sensitivity Questionnaire Correlate With Clinical Pain Responses. Reg Anesth Pain Med. 2018;43(2):200–204. doi:10.1097/AAP.0000000000000689
7. Walker SM. Long-term effects of neonatal pain. Semin Fetal Neonatal Med. 2019;24(4):101005. doi:10.1016/j.siny.2019.04.005
8. Beisheim-Ryan EH, Pohlig RT, Hicks GE, Horne JR, Medina J, Sions JM. Mechanical Pain Sensitivity in Postamputation Pain. Clin J Pain. 2021;38(1):23–31. doi:10.1097/AJP.0000000000000989
9. Zhi Y, Zhang Y, Zhang Y, Zhang M, Kong Y. Age-associated changes in multimodal pain perception. Age Ageing. 2024;53(5):107. doi:10.1093/ageing/afae107
10. Birnie KA, Chambers CT, Spellman CM. Mechanisms of distraction in acute pain perception and modulation. Pain. 2017;158(6):1012–1013. doi:10.1097/j.pain.0000000000000913
11. De Paepe AL, Crombez G. Attentional interference by pain in a dishabituation procedure: an experimental investigation. Pain. 2022;163(6):e725–e737. doi:10.1097/j.pain.0000000000002483
12. Lamé IE, Peters ML, Kessels AG, Van Kleef M, Patijn J. Test--retest stability of the Pain Catastrophizing Scale and the Tampa Scale for Kinesiophobia in chronic pain over a longer period of time. J Health Psychol. 2008;13(6):820–826. doi:10.1177/1359105308093866
13. Roelofs J, Peters ML, McCracken L, Vlaeyen JWS. The pain vigilance and awareness questionnaire (PVAQ): further psychometric evaluation in fibromyalgia and other chronic pain syndromes. Pain. 2003;101(3):299–306. doi:10.1016/S0304-3959(02)00338-X
14. Nothnagel H, Puta C, Lehmann T, et al. How stable are quantitative sensory testing measurements over time? Report on 10-week reliability and agreement of results in healthy volunteers. J Pain Res. 2017;10:2067–2078. doi:10.2147/JPR.S137391
15. Sachau J, Appel C, Reimer M, et al. Test-retest reliability of a simple bedside-quantitative sensory testing battery for chronic neuropathic pain. Pain Rep. 2023;8(1):e1049. doi:10.1097/PR9.0000000000001049
16. McCracken LM. “Attention” to pain in persons with chronic pain: a behavioral approach. Behav Ther. 1997;28(2):271–284. doi:10.1016/S0005-7894(97)80047-0
17. Dimova V, Lotsch J, Huhne K, et al. Association of genetic and psychological factors with persistent pain after cosmetic thoracic surgery. J Pain Res. 2015;8:829–844. doi:10.2147/JPR.S90434
18. Mathur VA, Moayedi M, Keaser ML, et al. High Frequency Migraine Is Associated with Lower Acute Pain Sensitivity and Abnormal Insula Activity Related to Migraine Pain Intensity, Attack Frequency, and Pain Catastrophizing. Front Hum Neurosci. 2016;10:489. doi:10.3389/fnhum.2016.00489
19. Gibson E, Sabo MT. Can pain catastrophizing be changed in surgical patients? A scoping review. Can J Surg. 2018;61(5):311–318. doi:10.1503/cjs.015417
20. Grundstrom H, Larsson B, Arendt-Nielsen L, Gerdle B, Kjolhede P. Associations between pain thresholds for heat, cold and pressure, and Pain Sensitivity Questionnaire scores in healthy women and in women with persistent pelvic pain. Eur J Pain. 2019;23(9):1631–1639. doi:10.1002/ejp.1439
21. Huang X, Yin J, Liu X, et al. The overgeneralization of pain-related fear in individuals with higher pain sensitivity: a behavioral and event-related potential study. Brain Res. 2023;1818:148473. doi:10.1016/j.brainres.2023.148473
22. Meulders A, Vandael K, Vlaeyen JW. Generalization of pain-related fear based on conceptual knowledge. Behav Ther. 2017;48(3):295–310. doi:10.1016/j.beth.2016.11.014
23. Wang D, Frey-Law LA. Multisensory sensitivity differentiates between multiple chronic pain conditions and pain-free individuals. Pain. 2023;164(2):e91–e102. doi:10.1097/j.pain.0000000000002696
24. Zhao H, Ran S, Gan K, Du Y, Li W. Pain sensitivity and quality of life of patients with burning mouth syndrome: a preliminary study in a Chinese population. BMC Oral Health. 2023;23(1):951. doi:10.1186/s12903-023-03689-2
25. Ruscheweyh R, Marziniak M, Stumpenhorst F, Reinholz J, Knecht S. Pain sensitivity can be assessed by self-rating: development and validation of the Pain Sensitivity Questionnaire. Pain. 2009;146(1–2):65–74. doi:10.1016/j.pain.2009.06.020
26. Hummel T, Springborn M, Croy I, Kaiser J, Lotsch J. High pain sensitivity is distinct from high susceptibility to non-painful sensory input at threshold level. Int J Psychophysiol. 2011;80(1):6974. doi:10.1016/j.ijpsycho.2011.01.012
27. Grouper H, Eisenberg E, Pud D. The relationship between sensitivity to pain and conditioned pain modulation in healthy people. Neurosci Lett. 2019;708:134333. doi:10.1016/j.neulet.2019.134333
28. Bagwath Persad LA, Kamerman PR, Wadley AL. Predictors of Cold and Pressure Pain Tolerance in Healthy South African Adults. Pain Med. 2017;18(11):2126–2137. doi:10.1093/pm/pnw291
29. Baguley T. Standardized or simple effect size: what should be reported? Br J Psychol. 2009;100(3):603–617. doi:10.1348/000712608x377117
30. Kanarek RB, Carrington C. Sucrose consumption enhances the analgesic effects of cigarette smoking in male and female smokers. Psychopharmacology (Berl). 2004;173(1–2):57–63. doi:10.1007/s00213-003-1699-0
31. Quan X, Fong DYT, Leung AYM, Liao Q, Ruscheweyh R, Chau PH. Validation of the Mandarin Chinese Version of the Pain Sensitivity Questionnaire. Pain Pract. 2018;18(2):180–193. doi:10.1111/papr.12587
32. Shen B, Wu B, Abdullah TB, et al. Translation and validation of Simplified Chinese version of the Pain Catastrophizing Scale in chronic pain patients: education may matter. Mol Pain. 2018;14:1744806918755283. doi:10.1177/1744806918755283
33. Burns LC, Ritvo SE, Ferguson MK, Clarke H, Seltzer Z, Katz J. Pain catastrophizing as a risk factor for chronic pain after total knee arthroplasty: a systematic review. J Pain Res. 2015;8:21–32. doi:10.2147/JPR.S64730
34. Shigetoh H. Hypervigilance to pain affects activities of daily living: an examination using the Japanese version of the pain vigilance awareness questionnaire. J Phys Ther Sci. 2017;29(12):2094–2096. doi:10.1589/jpts.29.2094
35. Aykan S, Vatansever G, Doganay-Erdogan B, Kalaycioglu C. Development of Sensory Sensitivity Scales (SeSS): reliability and validity analyses. Res Dev Disabil. 2020;100:103612. doi:10.1016/j.ridd.2020.103612
36. Wang Y, Mo X, Zhang J, Fan Y, Wang K, Peter S. Quantitative sensory testing (QST) in the orofacial region of healthy Chinese: influence of site, gender and age. Acta Odontol Scand. 2018;76(1):58–63. doi:10.1080/00016357.2017.1383511
37. Rolke R, Magerl W, Campbell KA, et al. Quantitative sensory testing: a comprehensive protocol for clinical trials. Eur J Pain. 2006;10(1):77–88. doi:10.1016/j.ejpain.2005.02.003
38. Zhang YH, Xu HR, Wang YC, et al. Pressure pain threshold and somatosensory abnormalities in different ages and functional conditions of post-stroke elderly. BMC Geriatr. 2022;22(1):830. doi:10.1186/s12877-022-03515-4
39. Baumgärtner U, Magerl W, Klein T, Hopf HC, Treede RD. Neurogenic hyperalgesia versus painful hypoalgesia: two distinct mechanisms of neuropathic pain. Pain. 2002;96(1–2):141–151. doi:10.1016/s0304-3959(01)00438-9
40. Mamcjht R. Mediation Analysis: issues and Recommendations. J Appl Struct Equ Model. 2018;2(1):i–ix. doi:10.47263/jasem.2
41. Hayes AF. Partial, conditional, and moderated moderated mediation: quantification, inference, and interpretation. Commun Monogr. 2018;85(1):4–40. doi:10.1080/03637751.2017.1352100
42. Meiselles D, Aviram J, Suzan E, Pud D, Eisenberg E. Does self-perception of sensitivity to pain correlate with actual sensitivity to experimental pain? J Pain Res. 2017;10:2657–2663. doi:10.2147/JPR.S149663
43. Pedregosa F, Varoquaux G, Gramfort A, et al. Scikit-learn: machine learning in Python. J Mach Learn Res. 2011;12:2825–2830. doi:10.48550/arxiv.1201.0490
44. Liddle AR. Information criteria for astrophysical model selection. Mon Not R Astron Soc: Lett. 2007;377(1):L74–L78. doi:10.1111/j.1745-3933.2007.00306.x
45. Rhudy JL, France CR, Bartley EJ, Williams AE, McCabe KM, Russell JL. Does pain catastrophizing moderate the relationship between spinal nociceptive processes and pain sensitivity? J Pain. 2009;10(8):860–869. doi:10.1016/j.jpain.2009.02.005
46. Almeida TF, Roizenblatt S, Tufik S. Afferent pain pathways: a neuroanatomical review. Brain Res. 2004;1000(1–2):40–56. doi:10.1016/j.brainres.2003.10.073
47. Gács B, Birkás B, Csathó Á. Time perspectives and pain: negative time perspective profile predicts elevated vulnerability to pain. Pers Individ Differ. 2020;153. doi:10.1016/j.paid.2019.109616
48. Grundström H, Larsson B, Arendt-Nielsen L, Gerdle B, Kjølhede P. Pain catastrophizing is associated with pain thresholds for heat, cold and pressure in women with chronic pelvic pain. Scand J Pain. 2020;20(3):635–646. doi:10.1515/sjpain-2020-0015
49. Failla MD, Gerdes MB, Williams ZJ, Moore DJ, Cascio CJ. Increased pain sensitivity and pain-related anxiety in individuals with autism. Pain Rep. 2020;5(6):e861. doi:10.1097/PR9.0000000000000861
50. Zhang M, Lin X, Zhi Y, Mu Y, Kong Y. The dual facilitatory and inhibitory effects of social pain on physical pain perception. iScience. 2024;27(2):108951. doi:10.1016/j.isci.2024.108951
51. George SZ, Wittmer VT, Fillingim RB, Robinson ME. Sex and pain-related psychological variables are associated with thermal pain sensitivity for patients with chronic low back pain. J Pain. 2007;8(1):2–10. doi:10.1016/j.jpain.2006.05.009
52. Allely CS. Pain sensitivity and observer perception of pain in individuals with autistic spectrum disorder. Sci World J. 2013;2013(1):916178. doi:10.1155/2013/916178
53. Simon E, Zsido AN, Birkas B, Gacs B, Csatho A. Negative time perspective predicts the self-perceived affective and physical components of pain independently from depression, anxiety, and early life circumstances. Acta Psychol (Amst). 2022;224:103536. doi:10.1016/j.actpsy.2022.103536
54. Kunz M, Capito ES, Horn-Hofmann C, et al. Psychometric Properties of the German Version of the Pain Vigilance and Awareness Questionnaire (PVAQ) in Pain-Free Samples and Samples with Acute and Chronic Pain. Int J Behav Med. 2017;24(2):260–271. doi:10.1007/s12529-016-9585-4
55. Raymaekers V, Bamps S, Duyvendak W, et al. Real world data collection and cluster analysis in patients with sciatica due to lumbar disc herniation. Clin Neurol Neurosurg. 2022;217:107246. doi:10.1016/j.clineuro.2022.107246
56. Bellieni CV. The Pain Principle. In: Bellieni CV, editor. A New Holistic-Evolutive Approach to Pediatric Palliative Care. Springer International Publishing; 2022:103–108.
57. Zambito Marsala S, Tinazzi M, Vitaliani R, et al. Spontaneous pain, pain threshold, and pain tolerance in Parkinson’s disease. J Neurol. 2011;258(4):627–633. doi:10.1007/s00415-010-5812-0
58. Woolf CJ, Ma Q. Nociceptors--noxious stimulus detectors. Neuron. 2007;55(3):353–364. doi:10.1016/j.neuron.2007.07.016
59. Costa-López B, Ruiz-Robledillo N, Ferrer-Cascales R, Albaladejo-Blázquez N, Sánchez-SanSegundo M. Relationship between Sensory Processing Sensitivity and Mental Health.
60. Ackerley R, Carlsson I, Wester H, Olausson H, Backlund WH. Touch perceptions across skin sites: differences between sensitivity, direction discrimination and pleasantness. Front Behav Neurosci. 2014;8:54. doi:10.3389/fnbeh.2014.00054
61. Acevedo BP, Jagiellowicz J, Aron E, Marhenke R, Aron A. Sensory processing sensitivity and childhood quality’s effects on neural responses to emotional stimuli. Clin Neuropsychiatry. 2017;14(6):359–373.
62. Kim HJ, Yang GS, Greenspan JD, et al. Racial and ethnic differences in experimental pain sensitivity: systematic review and meta-analysis. Pain. 2017;158(2):194–211. doi:10.1097/j.pain.0000000000000731
63. El Tumi H, Johnson MI, Dantas PBF, Maynard MJ, Tashani OA. Age-related changes in pain sensitivity in healthy humans: a systematic review with meta-analysis. Eur J Pain. 2017;21(6):955–964. doi:10.1002/ejp.1011
64. Lautenbacher S, Kunz M, Strate P, Nielsen J, Arendt-Nielsen L. Age effects on pain thresholds, temporal summation and spatial summation of heat and pressure pain. Pain. 2005;115(3):410–418. doi:10.1016/j.pain.2005.03.025
65. Murray CB, Patel KV, Twiddy H, Sturgeon, JA, Palermo, TM, et al. Age differences in cognitive-affective processes in adults with chronic pain. Eur J Pain. 2021;25:5 1041–1052. doi:10.1002/ejp.1725.
66. Molton IR, Terrill, AL . Overview of persistent pain in older adults. Am Psychol. 2014;69():197–207. doi:10.1037/a0035794
 © 2025 The Author(s). This work is published and licensed by Dove Medical Press Limited. The
full terms of this license are available at https://www.dovepress.com/terms.php
and incorporate the Creative Commons Attribution
- Non Commercial (unported, 4.0) License.
By accessing the work you hereby accept the Terms. Non-commercial uses of the work are permitted
without any further permission from Dove Medical Press Limited, provided the work is properly
attributed. For permission for commercial use of this work, please see paragraphs 4.2 and 5 of our Terms.
© 2025 The Author(s). This work is published and licensed by Dove Medical Press Limited. The
full terms of this license are available at https://www.dovepress.com/terms.php
and incorporate the Creative Commons Attribution
- Non Commercial (unported, 4.0) License.
By accessing the work you hereby accept the Terms. Non-commercial uses of the work are permitted
without any further permission from Dove Medical Press Limited, provided the work is properly
attributed. For permission for commercial use of this work, please see paragraphs 4.2 and 5 of our Terms.