")
Back to Journals » Journal of Pain Research » Volume 17
Vitamin D Levels and Temporomandibular Disorders: A Bidirectional Two-Sample Mendelian Randomization Analysis
Authors Zeng S, Tan Y, Cao Z , Zheng Y , Liu T, Deng Y , Xiong X
Received 7 August 2024
Accepted for publication 11 October 2024
Published 26 October 2024 Volume 2024:17 Pages 3487—3500
DOI https://doi.org/10.2147/JPR.S489583
Checked for plagiarism Yes
Review by Single anonymous peer review
Peer reviewer comments 2
Editor who approved publication: Dr David Keith
Shiya Zeng,1,* Yanyue Tan,1,2,* Zhiwei Cao,3 Yunhao Zheng,1 Tiqian Liu,1 Yifei Deng,1 Xin Xiong1
1State Key Laboratory of Oral Diseases & National Center for Stomatology & National Clinical Research Center for Oral Diseases, West China Hospital of Stomatology, Sichuan University, Chengdu, Sichuan, People’s Republic of China; 2Department of Nursing, West China Hospital of Stomatology, Sichuan University, Chengdu, Sichuan, People’s Republic of China; 3School of Stomatology, Tianjin Medical University, Tianjin, People’s Republic of China
*These authors contributed equally to this work
Correspondence: Xin Xiong, State Key Laboratory of Oral Diseases & National Center for Stomatology & National Clinical Research Center for Oral Diseases, West China Hospital of Stomatology, Sichuan University, No. 15, West Section 3, Second Ring Road, Chengdu, Sichuan, 610041, People’s Republic of China, Tel +86 028 85501425, Email [email protected]
Objective: Growing researches explore vitamin D’s role in temporomandibular disorders (TMDs), but the link between vitamin D and TMDs remains debated. To clarify the causal relationship, we conducted a Mendelian randomization (MR) analysis using data from genome-wide association studies (GWAS).
Subjects and Methods: The GWAS dataset of vitamin D (GWAS ID: ukb-d-30890_irnt; sample size: 329247) was obtained from the IEU Open GWAS project. And that of TMDs (GWAS ID: finn-b-TEMPORO; sample size: 134280), initiated on August 25th, 2017 and publicly released on December 18th, 2023, was extracted from the FinnGen dataset, whose cases were diagnosed based on the revised International Classification of Diseases, 10th Edition (ICD-10) code K07.6. Both datasets were obtained from the European population. According to three assumptions of MR analysis, a bi-directional MR analysis was performed to measure the causal relationship, with Inverse variance weighted (IVW) as the primary method and MR Egger and Weighted median as supplement. Moreover, diverse sensitivity analyses, including Cochran’s Q test, MR Egger intercept, Mendelian randomized polymorphism RESidual Sum and Outlier (MR-PRESSO), and leave-one-out analysis, were used to verify the stability of the findings.
Results: The MR analysis supported causal effects of vitamin D levels on TMDs risks within the European population using IVW method [odds ratio = 1.316; 95% confidence interval = 1.086 to 1.595; P = 0.005], supported by MR Egger and Weighted median. While there was no indication that TMDs have a direct impact on vitamin D levels [β: − 0.00738, standard error = 0.00665; P = 0.568].
Conclusion: The study revealed that within the European population higher levels of vitamin D led to higher risks of developing temporomandibular disorders, but found no obvious evidence that TMDs are causally associated with vitamin D. The conclusion should be cautiously interpreted, given the selection bias of TMDs patients sample.
Keywords: Mendelian randomization analysis, temporomandibular joint disorders, vitamin D, 25-hydroxyvitamin D
Introduction
Vitamin D, whose primary circulating form is 25-hydroxyvitamin D [25(OH)D], plays an important role in calcium homeostasis, contributing significantly to bone health, including the integrity of joint structures and muscles.1 Vitamin D sources include sunlight exposure, diet, and supplements,2 undergoing conversion into active forms in the liver and kidneys.3 Its levels vary by factors like skin color, sex, age, obesity, and metabolism,4 with at-risk groups including those with darker skin, from poorer nations, the young and elderly, the obese, and those with health issues.4 Severe vitamin D deficiency (<=20 ng/mL) and insufficiency (20–29 ng/mL)3 rates range from 5% to 50%, depending on location and population traits.5 And the deficiency of vitamin D is related to a series of pathological conditions, including musculoskeletal diseases, chronic pain, metabolic disorders and so on.6 However, despite the widespread use of vitamin D as a dietary supplement, there is insufficient evidence to establish a direct causal link between vitamin D and chronic pain conditions.7
Temporomandibular Disorders (TMDs) affect a range of musculoskeletal and neuromuscular conditions involving the temporomandibular joint complex, as well as the surrounding muscles and bone structures.8 These disorders are categorized into twelve common types, which include painful conditions and intra-articular diagnoses, based on the Diagnostic Criteria for Temporomandibular Disorders (DC/TMD) criteria that use Axis I and Axis II classifications.9 TMDs is the second most prevalent musculoskeletal issue (following chronic low back pain) leading to pain and disability,9 impacting as high as 31% of adults populations.10 Patients with TMDs often endure unilateral or bilateral pain centered around the pre-auricular area accompanied by clicking and limited jaw movements.11 The TMDs chronic pain12 and the high economic costs of treatment13 can lead to psychological and physical ailments, like mood disturbances, poor sleep quality and challenge in performing daily activities. The development of TMDs involves various factors like vitamin D, biological, environmental, social, emotional, and cognitive triggers.14 And the primary management of TMD focuses on pain relief, and improving joint function through conservative approaches likes self-management, medication, physical therapy, and occlusal splints.12 However, due to incomplete understanding of the etiology and pathogenesis of TMDs,15 there is no universally recognized best treatment method for TMDs in clinical practice.
Although the use of vitamin D in the treatment of TMDs is receiving increasing attention, there remains a lack of consensus regarding a potential causal link between vitamin D levels and the development of TMDs. Some studies have indicated that lower levels of vitamin D can increase the risk of developing TMDs, while some studies have not found the relationship between vitamin D levels and TMDs.16,17 And due to the mixed etiology of TMDs and the inability to effectively avoid the influence of these confounding factors in the study of their impact on TMDs, there is inevitably a risk of bias in these studies.17 Considering vitamin D’s implications for the treatment and prevention strategies of TMDs, identifying the relationship between vitamin D and TMDs could enhance clinical approaches, including reevaluating the potential role of vitamin D in TMD prevention and treatment strategies, thus impacting clinical decision-making and patient outcomes.
Mendelian randomization (MR) analysis method is an epidemiological research technique that uses genetic data to deduce causality from observational studies, especially within the realm of epidemiology.18 With a large number of genome-wide association studies (GWAS) providing a powerful data source for MR analysis, genetic variants, typically single-nucleotide polymorphisms (SNPs), serve as instrumental variables (IVs) in MR analysis, which reduces the influence of confounding factors and reverse causal relationships in research.18 Applying MR analysis to explore the relationship between vitamin D and TMDs can eliminate the confounding effects caused by the complex etiology of TMDs,15 avoid reverse causality,18 separate the effects of vitamin D from other factors in the serum,19 and thus obtain more accurate results.
In this study, based on publicly available aggregated GWAS databases, a bidirectional two-sample MR analysis method was conducted to investigate the potential causal relationships.
Materials and Methods
Study Design
A bi-directional MR study was conducted to explore the causal associations between vitamin D levels and TMDs. SNPs, as IVs in MR analysis,20 need to meet three assumptions of MR analysis:18 relevance (strong correlation with exposure), independence (no link with confounders), and exclusivity (affects outcomes solely through exposure). In the forward analysis, Vitamin D served as the exposure and TMDs served as the outcome; Conversely, in the reverse MR analyses, the exposure was TMDs and the outcome was Vitamin D. The framework is described in Figure 1.
 |
Figure 1 An overview of this MR study designs. |
Data Source
For the forward MR analysis, the exposure data were the summary data of vitamin D and the outcome data were the summary data of TMDs; Meanwhile, for the reverse MR analysis, the exposure data were the summary data of TMDs and the outcome data were the summary data of vitamin D.
The GWAS summary statistics for vitamin D (GWAS ID: ukb-d-30890_irnt) were obtained from the IEU Open GWAS project website (https://gwas.mrcieu.ac.uk/datasets/), with the data released on August 1st, 2018. The study, conducted from Neale lab, included 13,585,763 SNPs and 329,247 individuals of European descent. In addition, the GWAS summary statistics for TMDs (GWAS ID: finn-b-TEMPORO) were extracted from the FinnGen dataset (https://www.finngen.fi/en), specifically the DF10 version, which was initiated on August 25th, 2017 and publicly released on December 18th, 2023. It included 16,379,953 SNPs and 134,280 individuals of European descent, with 2730 cases and 131,550 controls. The dataset integrated genotype information from the Finnish Biobank with digital health records from the Finnish Health Registry.21 The case group for TMDs was diagnosed based on the revised International Classification of Diseases, 10th Edition (ICD-10) code K07.6, and confirmed through standardized clinical diagnostic procedures. And the quality control methods for FinnGen encompass sample and marker quality assessment, genotyping with a custom Axiom FinnGen1 array, imputation using a population-specific SISu v3 reference panel, and accuracy estimation by comparing with WES data.21 The details of data source are shown in Table 1.
 |
Table 1 Details of GWAS Used for Each Phenotype |
Selection of Genetic Variants as IVs
For each exposure factor, the SNPs were selected as IVs according to the three key assumptions of MR.18
As for the relevance assumption, in the forward MR analysis, SNPs significantly related to vitamin D levels from GWAS (p < 5×10⁻⁸), were chosen as initial IVs. Besides, to guarantee the independence among SNPs, the initial IVs were further screened based on linkage disequilibrium (LD) analysis (r2 < 0.001 and clumping distance > 10,000 kb). Similarly, in reverse MR analysis, SNPs with p < 5× 10⁻⁶, r2 < 0.001 and clumping distance > 1000 kb were screened as IVs. The change in screening criteria is intended to filter out available SNPs.
Considering the independence assumption and the exclusion restriction assumption, the SNPs that were related to confounders were deleted manually on LDtrait22 website (https://ldlink.nih.gov/?tab=ldtrait).
Finally, as to avoid the bias from the weak instruments, F-statistic was utilized to measure the strength of relationship between each instrument and the exposure according to the following formula: F = R2 (N – 2) / (1 − R2),23 where N means the sample size of the GWAS dataset and R2 is the proportion of the exposure’s variability accounted for by each instrument. R2 was calculated using the following formula: R2 = 2 × β2 × (1 – EAF) × EAF,23 with β estimates of the genetic effect of every SNP on exposure and EAF is an abbreviation for effect allele frequency. SNPs with F-statistic less than 10 were kicked out, for if F > 10, it indicates sufficient strength.24
MR Analysis
Before conducting MR analysis to estimate the causal effect of the exposure on the outcome, we harmonized the exposure and outcome data extracted according to the SNPs selected, where some SNPs were removed because they were not available in the outcome GWAS dataset.25
To test the causal effect of exposure on outcome, three approaches of MR analysis were performed, with Inverse variance weighted (IVW26) as the primary method supplemented by MR Egger27 and Weighted median.28 The IVW method supposes that the MR assumptions are satisfied or that all SNPs are valid,26 with MR Egger method assuming all IVs to be voided27 and Weighted median method allowing no more than 50% of invalid IVs.28 As IVW method tends to provide wider Confidence interval (CI) and to be more powerful compared to the other two methods,29 it was employed as the principal MR analysis method. And the result was considered significant if the P-value was less than 0.05. In addition, if the outcome was binary, we converted the β estimate to the Odds ratio (OR).25
Sensitivity Analyses
Different sensitivity analyses were used to detect potential pleiotropy, heterogeneity and the consistency of the MR estimates. First, for both IVW method and MR Egger method, Cochran’s Q test was calculated to measure the heterogeneity among IVs with the result of p > 0.05 indicating that there was no heterogeneity.30 Second, the horizontal pleiotropy was identified through the MR Egger intercept, and it means no effect of pleiotropy if the MR–Egger intercept was close to 0 or p > 0.05.31 Moreover, Mendelian randomized polymorphism RESidual Sum and Outlier (MR-PRESSO) test was implemented to identify the horizontal pleiotropy32 and identify the outlier SNPs, where any outlier SNPs present would be removed and MR analyses would be restarted.32 Lastly, to evaluate whether the MR estimate was driven or biased by a particular SNP, leave-one-out analysis was conducted with each SNP removed.33
The MR analyses and Sensitivity analyses were performed using R software version 4.2.0 with the “TwoSampleMR”34 (version 0.5.9) and “MR-PRESSO”32 (version 1.0) R packages.
Power Analyses and Sample Size of TMDs
To investigate power values and sample size for the TMDs database, we utilized the mRnd online calculator (https://shiny.cnsgenomics.com/mRnd/), which is specifically designed for power and sample size calculations in MR studies. We set the significance level α at 0.05, and considered a power value of 0.8 or higher as sufficient35 to detect the potential causal relationship between vitamin D and TMDs. Moreover, we estimated the required sample size for TMDs on the same website, with the same significance level and desired statistical power, to ensure that our study design would have the necessary capability to detect the effects at a reasonable confidence level.
Results
Characteristics of the Selected SNPs
In the forward MR analysis, SNPs significantly associated with Vitamin D were extracted as IVs under a screening criterion that p < 5×10⁻⁸, LD-r2 < 0.001 and clumping distance > 10,000 kb. And in the process of screening for SNPs with F-statistics for IVs over 10, weak IVs were removed. Meanwhile, SNPs correlated with confounders13–15 (Insomnia: rs12893623, rs1421333, rs17047750, rs3741367, rs9409266; Anxiety/tension: rs1972994) were removed manually on LDtrait22 website (https://ldlink.nih.gov/?tab=ldtrait), leaving 53 SNPs. During the process of extracting these 53 SNPs from the TMDs GWAS database, three SNPs were omitted. Therefore, a total of 50 SNPs were ultimately involved in the MR analysis.
For the IVs of TMDs, none of SNPs could be obtained when a strict P-value (P < 5 × 10⁻⁸) was taken for screening. To include valid SNPs associated with TMDs to continue MR analysis, a loose P-value (P < 5 × 10⁻⁶) was used in this study combining with LD analysis (r2 < 0.001 and clumping distance > 1000 kb). With the F-statistic of all SNPs greater than 10 and no SNPs associated with confounding factors, 7 SNPs were available for the MR analysis of TMDs on Vitamin D ultimately.
The details of IVs used in the bidirectional MR analysis are shown in Supplementary Tables 1 and 2.
Causal Effects of Vitamin D on TMDs
The results of this MR analysis are shown in Table 2, Figures 2 and 3. The causal effects of vitamin D on TMDs for each of the three methods (IVW, weighted median, and MR-Egger) were: OR = 1.316 (95% CI: 1.086 to 1.595, P = 0.005); OR = 1.430 (95% CI: 1.095 to 1.868, P = 0.012); OR = 1.545 (95% CI: 1.133 to 2.108, P = 0.006), genetically predicting that Vitamin D was significantly associated with an increased risk of TMDs.
 |
Table 2 Causal Effects of Vitamin D Levels on TMD Risks in MR Analysis |
 |
Figure 2 Continued. |
 |
Figure 2 (a) Scatter plot of the causal effect of Vitamin D levels on TMDs; (b) forest plot of the causal effect of Vitamin D levels on TMDs. |
 |
Figure 3 Continued. |
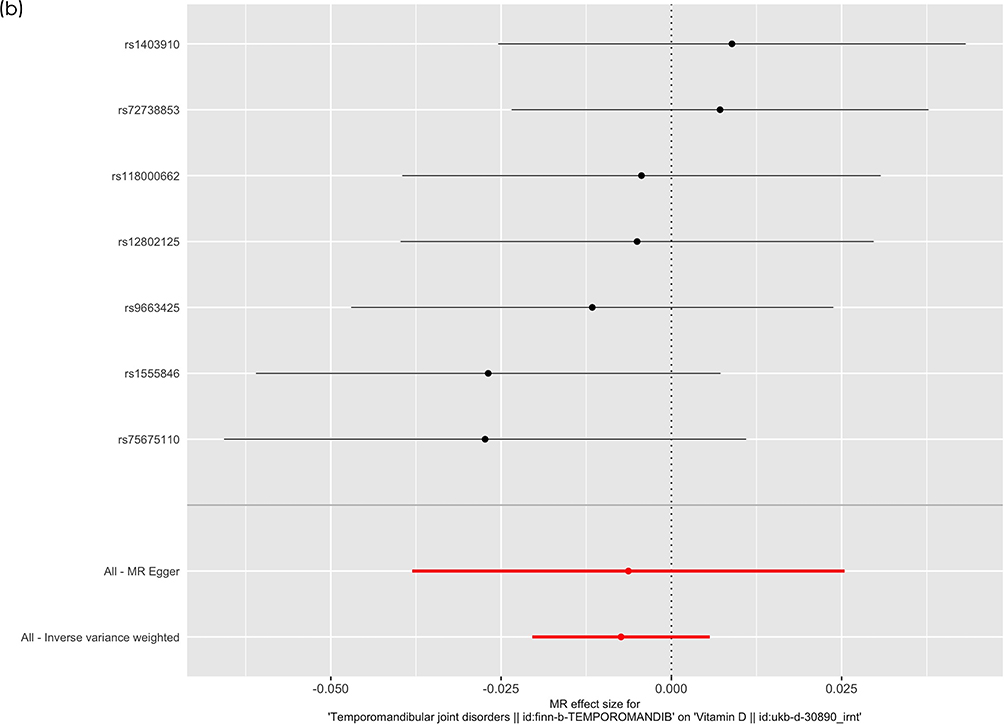 |
Figure 3 (a) Scatter plot of the causal effect of TMD on Vitamin D levels; (b) forest plot of the causal effect of TMD on Vitamin D levels. |
Causal Effects of TMDs on Vitamin D
In the reverse MR analysis, no causal effect of TMDs on Vitamin D was predicted, as the β of TMDs associated with Vitamin D for the main IVW method was −0.00738 (SE = 0.00665, P = 0.267). MR Egger (β = −0.00630, SE = 0.01619, P = 0.713) and Weighted median (β = −0.00482, SE = 0.00844, P = 0.568) showed consistent results. Table 3 shows the results for each of the three methods and Figure 3 reveals the plots of the Causal effects of TMDs on vitamin D with (a) shows the scatter plot, while (b) shows the forest plot.
 |
Table 3 Causal Effects of TMD on Vitamin D Levels in MR Analysis |
Sensitivity Analyses of MR
The Cochran Q-test (PQ > 0.05) indicated a lack of heterogeneity among the included SNPs, and the Egger intercept test (Pintercept > 0.05) and the MR-PRESSO global test (Pglobal > 0.05) indicated little evidence of horizontal pleiotropy bias with no outlier SNPs (see Table 4). Additionally, Figure 4 shows the leave-one-out analysis suggesting the stability of the result without any SNP outliers. And Figure 5, the funnel plot, indicated the absence of pleiotropy.
 |
Table 4 Sensitivity Analysis of the Associations Between Vitamin D and TMDs |
 |
Figure 4 Continued. |
 |
Figure 4 Leave-one-out sensitivity analysis of the effect of (a) Vitamin D levels on TMDs and (b) the effect of TMDs on Vitamin D. |
 |
Figure 5 Continued. |
 |
Figure 5 Funnel plot of the effect of (a) Vitamin D levels on TMDs and (b) the effect of TMDs on Vitamin D. |
Power Analyses and Sample Size of TMDs
To test the potential causal relationship between vitamin D and TMDs, we utilized the mRnd online calculator to ensure a statistical power of at least 0.8. With a significance level set at 0.05 and an input sample size of 134,280, we achieved a power of 0.92, surpassing our target, indicating that our results are highly reliable. And attain a power of 0.8, a sample size of 92,298 is sufficient, which is less than our original sample size, confirming that our study is well-designed to detect the potential causal effect.
Discussion
This research is the first to investigate the bidirectional causal relationship between vitamin D and TMDs through multiple MR methods. The forward MR analysis provides evidence, contrary to general researches,16,17 indicating that an increase in vitamin D levels is related to the development of TMDs. Moreover, the reverse MR analysis shows no significant causal effect of TMDs on vitamin D.
Contrary to our findings, the previous research suggests that vitamin D is effective, or at least not harmful, in the treatment of TMDs.16,17 In some clinical trials little evidence suggests a significant correlation between serum vitamin D concentrations and the prevalence of TMDs, while most case-control studies show an increased risk of TMDs in people with inadequate vitamin D levels.16 However, these previous studies generally lacked adequate differentiation between the effects of vitamin D and calcium,19,36 whose supplements inhibit bone turnover by about 20% and have a positive impact on bone density.37 Moreover, most trials involving vitamin D usually lacked sufficient design to evaluate long-term effects.36
The apparent contradictions between the findings of this MR analysis and those of previous studies can likely be explained by inadequately controlled confounders and limited sample sizes within a limited research timeframe in previous researches, which can result in biased research outcomes. In this MR analysis, confounding factors were carefully removed during the selection of IVs, a larger sample size was used, and the IVs reflect genetic variation remaining stable for a long period of time, allowing for the possibility of drawing conclusions that differ from previous analyses.
While the precise causal pathway from higher vitamin D levels to an increased risk of developing TMDs in our MR analysis is not yet fully understood, we propose some hypotheses based on three key considerations. Firstly, our study samples predominantly consist of European descent, suggesting a potentially lower incidence of vitamin D deficiency38 compared to the global average.39 It is noteworthy that existing research indicates a U-shaped correlation between vitamin D levels and their impact on the skeletal muscle system,40 implying the existence of an optimal level, beyond which both deficiency and excess can be detrimental. Given this, it is conceivable that a significant portion of our study population fall into the latter half of this U-shaped curve, where elevated vitamin D levels correlate with negative impacts on muscular health. Additionally, a prospective case-control study noted a higher prevalence of TMDs among participants with excessively high vitamin D levels, offering tentative support for the potential link between vitamin D excess and increased TMDs risk.41
The second point is that as the grade of research grows stronger and more precise, the early belief about vitamin D’s effect on the risk of TMDs has gradually lessened.16 This new understanding suggests that factors in earlier, less solid studies might have mistakenly made the connection between vitamin D deficiency and TMD risk seem stronger than it actually is. In MR analysis, employing genetic variants as IVs in our MR analysis has substantially mitigated the impact of confounding factors, thus offering a more accurate assessment whether there is a real connection between vitamin D levels and the chance of getting TMDs. The inherent design of MR analysis helps to circumvent many of the biases that can skew findings in common observation studies, thereby enhancing the reliability of our findings.
From another aspect, we can further clarify our findings by considering the temporal dimension of vitamin D’s effects. Studies suggest that the changes in bone density due to long-term exposure to vitamin D may not be the same as those observed with short-term exposure, with the underlying mechanisms in this area still being largely unclear.1,42 Similarly, it is conceivable that vitamin D might exert differential effects on the musculoskeletal system over longer durations as opposed to the findings from short-term clinical trials. Utilizing genetic variation as a metric allows us to examine the outcomes across a more prolonged time horizon. While a multitude of studies have linked vitamin D deficiency to an increased incidence of TMDs, a study concluded that there was no significant effect using genetic methodologies.43 Assessing the impact of vitamin D necessitates a holistic approach that considers both its acute and chronic effects, underscoring the value of a comprehensive understanding that spans both immediate and extended timeframes.
The exact etiology of TMDs is highly complex and we cannot confirm whether the LDtrait22 website includes all factors that SNPs can influence, which may lead to incomplete removal of SNPs related to confounding factors in our MR analysis, making it impossible for our MR analysis results to fully avoid the risks caused by confounding factors. Moreover, a significant limitation of this study, which must be clearly acknowledged, is its reliance on summary data from the European population, which restricts our ability to explore the detailed effects of vitamin D on TMDs. The lack of detailed data on vitamin D levels makes it difficult to conduct stratified analyses across different levels of vitamin D—deficiency, sufficiency, and excess—which obscures the true diversity and variability within the European population. Therefore, we are also unable to confirm whether the impact of vitamin D levels on TMDs exhibits a U-shaped correlation, and we are unable to further speculate on the underlying mechanisms of how vitamin D levels might influence the occurrence or progression of TMDs without the capacity to perform more nuanced analyses. Similarly, TMD data from FinnGen did not classify TMDs into subcategories based on DC/TMD diagnosis criteria, limiting our insights into how vitamin D affects specific TMD. While we have established a general association between vitamin D levels and TMD risk within the European population, we cannot extrapolate these findings to predict outcomes for individual TMD subcategories. As a result, we cannot offer targeted clinical advice as there’s a risk that our findings could lead to unintended consequences if applied inappropriately to specific TMD subcategories. Therefore, detailed datasets on both vitamin D content stratification and subgroup classification of TMDs are also required to explore more refined causal effects of vitamin D on TMDs. Additionally, it is also crucial to emphasize that our findings, though significant, are specific to the European population, whose rate of vitamin D deficiency is lower compared to the global average.38,39 Since the study does not account for variations in vitamin D levels or diverse presentations of TMDs that may exist in non-European populations, and we lack knowledge about how different racial backgrounds might affect the impact on TMDs, these findings cannot be generalized to other demographic groups. Considering this, data from diverse populations are necessary to fully explore the universal patterns of causal effects of vitamin D on TMDs in all humans.
Conclusions
In summary, this MR study demonstrated a causal relationship between vitamin D and the risk of developing TMDs within the European population, but little significant reverse causal relationship was found between TMDs and vitamin D. It is necessary to reconsider both the measurement of vitamin D levels in TMD patients and the rationales behind using vitamin D to assist in the treatment process.
Abbreviations
TMDs, temporomandibular disorders; DC/TMD, Diagnostic Criteria for Temporomandibular Disorders; GWAS, Genome-wide association studies; MR, Mendelian randomization; IVs, Instrumental variables; IVW, Inverse variance weighted; SNPs, Single nucleotide polymorphisms; LD, Linkage disequilibrium; CI, Confidence interval; OR, Odds ratio; MR-PRESSO, Mendelian randomized polymorphism RESidual Sum and Outlier; ICD-10, International Classification of Diseases, 10th Edition.
Ethical Approval and Consent to Participate
As per the regulations outlined in People’s Republic of China’s “Notice on the Implementation of Ethical Review Measures for Life Science and Medical Research”, our study falls under the exemption criteria specified in Section 4 of the regulation. Therefore, ethics approval was not required for this research, as it met the following conditions:
- Exemption Premise: The study exclusively utilized publicly available data, specifically summary-level data from GWAS, which does not involve sensitive personal information, pose harm to individuals, or compromise their privacy.
- Exemption Provision: Our research adheres to the exemption circumstances outlined in Section 4 of the regulation: We utilized lawfully obtained publicly available data for our analysis; the data used in this study were fully anonymized, ensuring the privacy and confidentiality of individuals; our research focuses on analyzing existing data and does not involve interventions, human biological samples, or activities related to reproductive cloning, genetic manipulation, or germ cells.
Due to the nature of our study and its compliance with the exemption criteria, we did not require explicit ethics approval. While informed consent was not obtained from individual participants since the study involved publicly available data, we ensured that all data accessed and analyzed were fully de-identified and complied with the terms of use and guidelines provided by the data source. We affirm that this research was conducted in accordance with the applicable laws, regulations, and ethical standards.
Acknowledgments
This We thank the IEU open GWAS (https://gwas.mrcieu.ac.uk/datasets/).
Funding
The study was supported by National Natural Science Foundation of China (82301129) and Clinical Research Project of West China Hospital of Stomatology, Sichuan University (LCYJ-2023-YY-2).
Disclosure
The authors report no conflicts of interest in this work.
References
1. Bolland MJ, Grey A, Avenell A. Effects of vitamin D supplementation on musculoskeletal health: a systematic review, meta-analysis, and trial sequential analysis. Lancet Diabetes Endocrinol. 2018;6(11):847–858. doi:10.1016/S2213-8587(18)30265-1
2. Benedik E. Sources of vitamin D for humans. Int J Vitam Nutr Res. 2022;92(2):118–125. doi:10.1024/0300-9831/a000733
3. Pramyothin P, Holick MF. Vitamin D supplementation: guidelines and evidence for subclinical deficiency. Curr Opin Gastroenterol. 2012;28(2):139–150. doi:10.1097/MOG.0b013e32835004dc
4. Holick MF, Binkley NC, Bischoff-Ferrari HA, et al. Evaluation, treatment, and prevention of vitamin D deficiency: an endocrine society clinical practice guideline. J Clin Endocrinol Metab. 2011;96(7):1911–1930. doi:10.1210/jc.2011-0385
5. Amrein K, Scherkl M, Hoffmann M, et al. Vitamin D deficiency 2.0: an update on the current status worldwide. Eur J Clin Nutr. 2020;74(11):1498–1513. doi:10.1038/s41430-020-0558-y
6. Alessio N, Belardo C, Trotta MC, et al. Vitamin D deficiency induces chronic pain and microglial phenotypic changes in mice. Int J Mol Sci. 2021;22(7):3604. doi:10.3390/ijms22073604
7. Bassett E, Gjekmarkaj E, Mason AM, Zhao SS, Burgess S. Vitamin D, chronic pain, and depression: linear and non-linear Mendelian randomization analyses. Transl Psychiatry. 2024;14:274. doi:10.1038/s41398-024-02997-7
8. Gauer RL, Semidey MJ. Diagnosis and treatment of temporomandibular disorders. Am Fam Physician. 2015;91(6):378–386.
9. Schiffman E, Ohrbach R, Truelove E, et al. Diagnostic criteria for temporomandibular disorders (DC/TMD) for clinical and research applications: recommendations of the international RDC/TMD consortium network and orofacial pain special interest group. J Oral Facial Pain Headache. 2014;28(1):6–27. doi:10.11607/jop.1151
10. Valesan LF, Da-Cas CD, Réus JC, et al. Prevalence of temporomandibular joint disorders: a systematic review and meta-analysis. Clin Oral Investig. 2021;25(2):441–453. doi:10.1007/s00784-020-03710-w
11. Zakrzewska JM. Temporomandibular disorders, headaches and chronic pain. J Pain Palliat Care Pharmacother. 2015;29(1):61–63. doi:10.3109/15360288.2014.1003678
12. Ferrillo M, Giudice A, Marotta N, et al. Pain management and rehabilitation for central sensitization in temporomandibular disorders: a comprehensive review. Int J Mol Sci. 2022;23(20):12164. doi:10.3390/ijms232012164
13. Wadhokar OC, Patil DS. Current trends in the management of temporomandibular joint dysfunction: a review. Cureus. 2022;14(9:e29314). doi:10.7759/cureus.29314
14. Melis M, Di Giosia M. The role of genetic factors in the etiology of temporomandibular disorders: a review. CRANIO®. 2016;34(1):43–51. doi:10.1179/2151090314Y.0000000027
15. Murphy MK, MacBarb RF, Wong ME, Athanasiou KA. Temporomandibular joint disorders: a review of etiology, clinical management, and tissue engineering strategies. Int J Oral Maxillofac Implants. 2013;28(6):e393–e414. doi:10.11607/jomi.te20
16. Kui A, Buduru S, Labunet A, Balhuc S, Negucioiu M. Vitamin D and temporomandibular disorders: what do we know so far? Nutrients. 2021;13(4):1286. doi:10.3390/nu13041286
17. Ferrillo M, Lippi L, Giudice A, et al. Temporomandibular disorders and vitamin D deficiency: what is the linkage between these conditions? A systematic review. J Clin Med. 2022;11(21):6231. doi:10.3390/jcm11216231
18. Davies NM, Holmes MV, Davey Smith G. Reading Mendelian randomisation studies: a guide, glossary, and checklist for clinicians. BMJ. 2018;362:k601. doi:10.1136/bmj.k601
19. Rosen CJ. Vitamin D supplementation: bones of contention. Lancet. 2014;383(9912):108–110. doi:10.1016/S0140-6736(13)61721-3
20. Sekula P, Del Greco MF, Pattaro C, Köttgen A. Mendelian randomization as an approach to assess causality using observational data. J Am Soc Nephrol JASN. 2016;27(11):3253–3265. doi:10.1681/ASN.2016010098
21. Kurki MI, Karjalainen J, Palta P, et al. FinnGen provides genetic insights from a well-phenotyped isolated population. Nature. 2023;613(7944):508–518. doi:10.1038/s41586-022-05473-8
22. Lin SH, Brown DW, Machiela MJ. LDtrait: an online tool for identifying published phenotype associations in linkage disequilibrium. Cancer Res. 2020;80(16):3443–3446. doi:10.1158/0008-5472.CAN-20-0985
23. Papadimitriou N, Dimou N, Tsilidis KK, et al. Physical activity and risks of breast and colorectal cancer: a Mendelian randomisation analysis. Nat Commun. 2020;11:597. doi:10.1038/s41467-020-14389-8
24. Staiger D, Stock JH. Instrumental variables regression with weak instruments. Econometrica. 1997;65(3):557–586. doi:10.2307/2171753
25. Wang S, Liu H, Yang P, et al. Exploring the genetic association of allergic diseases with cardiovascular diseases: a bidirectional Mendelian randomization study. Front Immunol. 2023;14:1175890. doi:10.3389/fimmu.2023.1175890
26. Hartwig FP, Davey Smith G, Bowden J. Robust inference in summary data Mendelian randomization via the zero modal pleiotropy assumption. Int J Epidemiol. 2017;46(6):1985–1998. doi:10.1093/ije/dyx102
27. Bowden J, Davey Smith G, Burgess S. Mendelian randomization with invalid instruments: effect estimation and bias detection through Egger regression. Int J Epidemiol. 2015;44(2):512–525. doi:10.1093/ije/dyv080
28. Bowden J, Davey Smith G, Haycock PC, Burgess S. Consistent estimation in Mendelian randomization with some invalid instruments using a weighted median estimator. Genet Epidemiol. 2016;40(4):304–314. doi:10.1002/gepi.21965
29. Burgess S, Scott RA, Timpson NJ, Davey Smith G, Thompson SG. Using published data in Mendelian randomization: a blueprint for efficient identification of causal risk factors. Eur J Epidemiol. 2015;30(7):543–552. doi:10.1007/s10654-015-0011-z
30. Bowden J, Hemani G, Davey Smith G. Invited commentary: detecting individual and global horizontal pleiotropy in Mendelian randomization—A job for the humble heterogeneity statistic? Am J Epidemiol. 2018;187(12):2681–2685. doi:10.1093/aje/kwy185
31. Burgess S, Thompson SG. Interpreting findings from Mendelian randomization using the MR-Egger method. Eur J Epidemiol. 2017;32(5):377–389. doi:10.1007/s10654-017-0255-x
32. Verbanck M, Chen CY, Neale B, Do R. Detection of widespread horizontal pleiotropy in causal relationships inferred from Mendelian randomization between complex traits and diseases. Nat Genet. 2018;50(5):693–698. doi:10.1038/s41588-018-0099-7
33. Zheng J, Baird D, Borges MC, et al. Recent developments in Mendelian randomization studies. Curr Epidemiol Rep. 2017;4(4):330–345. doi:10.1007/s40471-017-0128-6
34. Hemani G, Zheng J, Elsworth B, et al. The MR-Base platform supports systematic causal inference across the human phenome. eLife. 2018;7:e34408. doi:10.7554/eLife.34408
35. Yang C, Fagan AM, Perrin RJ, Rhinn H, Harari O, Cruchaga C. Mendelian randomization and genetic colocalization infer the effects of the multi-tissue proteome on 211 complex disease-related phenotypes. Genome Med. 2022;14:140. doi:10.1186/s13073-022-01140-9
36. Cranney A, Horsley T, O’Donnell S, et al. Effectiveness and safety of vitamin D in relation to bone health. Evid Reporttech Assess. 2007;2007(158):1–235.
37. Tang BM, Eslick GD, Nowson C, Smith C, Bensoussan A. Use of calcium or calcium in combination with vitamin D supplementation to prevent fractures and bone loss in people aged 50 years and older: a meta-analysis. Lancet. 2007;370(9588):657–666. doi:10.1016/S0140-6736(07)61342-7
38. Cashman KD, Dowling KG, Škrabáková Z, et al. Vitamin D deficiency in Europe: pandemic?12. Am J Clin Nutr. 2016;103(4):1033–1044. doi:10.3945/ajcn.115.120873
39. Mithal A, Wahl DA, Bonjour JP, et al. Global vitamin D status and determinants of hypovitaminosis D. Osteoporos Int. 2009;20(11):1807–1820. doi:10.1007/s00198-009-0954-6
40. Zittermann A. The Biphasic Effect of Vitamin D on the Musculoskeletal and Cardiovascular System. Int J Endocrinol. 2017;2017:3206240. doi:10.1155/2017/3206240
41. Ekici Ö, Çelik S. The relationship of biochemical factors related to calcium metabolism with temporomandibular disorders. J Stomatol Oral Maxillofac Surg. 2023;124(1, Supplement):101315. doi:10.1016/j.jormas.2022.10.014
42. Tuppurainen MT, Komulainen M, Kröger H, et al. Does vitamin D strengthen the increase in femoral neck BMD in osteoporotic women treated with estrogen? Osteoporos Int. 1998;8(1):32–38. doi:10.1007/s001980050045
43. Yilmaz AD, Yazicioglu D, Tüzüner Öncül AM, Yilmaz E, Ereş G. Vitamin D receptor gene polymorphisms (Apa1 and Taq1) in temporomandibular joint internal derangement/osteoarthritis in a group of Turkish patients. Mol Biol Rep. 2018;45(6):1839–1848. doi:10.1007/s11033-018-4330-5
 © 2024 The Author(s). This work is published and licensed by Dove Medical Press Limited. The
full terms of this license are available at https://www.dovepress.com/terms.php
and incorporate the Creative Commons Attribution
- Non Commercial (unported, 3.0) License.
By accessing the work you hereby accept the Terms. Non-commercial uses of the work are permitted
without any further permission from Dove Medical Press Limited, provided the work is properly
attributed. For permission for commercial use of this work, please see paragraphs 4.2 and 5 of our Terms.
© 2024 The Author(s). This work is published and licensed by Dove Medical Press Limited. The
full terms of this license are available at https://www.dovepress.com/terms.php
and incorporate the Creative Commons Attribution
- Non Commercial (unported, 3.0) License.
By accessing the work you hereby accept the Terms. Non-commercial uses of the work are permitted
without any further permission from Dove Medical Press Limited, provided the work is properly
attributed. For permission for commercial use of this work, please see paragraphs 4.2 and 5 of our Terms.