")
Back to Journals » Clinical Interventions in Aging » Volume 20
Phase Angle Predicts Malnutrition Risk and 6-month Mortality in Older Patients with Multimorbidity: A Retrospective Study
Authors Liu T , Wang Y , Wang Y , Xia D
Received 21 January 2025
Accepted for publication 20 June 2025
Published 26 June 2025 Volume 2025:20 Pages 895—902
DOI https://doi.org/10.2147/CIA.S518795
Checked for plagiarism Yes
Review by Single anonymous peer review
Peer reviewer comments 3
Editor who approved publication: Dr Maddalena Illario
Tingting Liu,1 Yao Wang,1 Yuan Wang,1 Dong Xia2
1Department of Geriatrics, Beijing Geriatric Hospital, Beijing, 100095, People’s Republic of China; 2Department of Emergency, Beijing Geriatric Hospital, Beijing, 100095, People’s Republic of China
Correspondence: Tingting Liu, Department of Geriatrics, Beijing Geriatric Hospital, No. 118 Wenquan Road, Beijing, 100095, People’s Republic of China, Tel +8615321959544, Email [email protected]
Background: This study examined the utility of the phase angle (PhA) in predicting malnutrition risk and 6-month mortality in older patients with multimorbidity.
Methods: We conducted a retrospective analysis of 104 hospitalized older adults with multiple chronic conditions. Data on clinical parameters, body composition, and nutritional status (via Nutritional Risk Screening 2002) were analyzed. Pearson’s correlation analysis and receiver operating characteristic analysis were used to identify the optimal PhA cutoff for malnutrition risk. Mortality and malnutrition were compared between the low and high PhA groups.
Results: PhA was significantly correlated with age, BMI, hemoglobin, albumin, triglycerides, and the extracellular water/total body water ratio (all P < 0.05). The optimal PhA cutoff was 3.15°, which had 62% sensitivity and 79% specificity for malnutrition prediction. Patients in the low PhA group had significantly higher rates of malnutrition (80.85% vs 40.35%, P < 0.05) and mortality (29.79% vs 3.5%, P < 0.05).
Conclusion: PhA is a clinically valuable tool for assessing malnutrition risk and predicting mortality in older patients with multimorbidity. It enables early identification and intervention, improving patient outcomes.
Keywords: phase angle, multiple chronic conditions, aged, malnutrition, mortality
Introduction
Multimorbidity, defined as the co-occurrence of two or more chronic conditions, complicates patients’ nutritional status because of an increased inflammatory burden, altered metabolism, polypharmacy, and a reduced functional status, all of which increase the risk of malnutrition among aging populations.1 As population aging becomes more severe worldwide, multimorbidity has also emerged as a major concern of the global society.1–4 Previous studies confirmed that older individuals often have malnutrition, which can have several detrimental clinical effects.5–7 Importantly, several trials reported that the risk factors for malnutrition in the patient population were at least partially modifiable.8 Early identification of malnutrition risk and timely nutritional interventions produced positive outcomes regarding prognosis and mortality.9,10
Several nutritional assessment tools for malnutrition have been developed and applied in older patients.11–13 Among these, the Nutritional Risk Screening (NRS-2002) is widely used in clinical settings.11 It assesses nutritional status based on parameters such as weight loss, body mass index (BMI), dietary intake, and the severity of the patient’s underlying illnesses. Scores range from 0 to 3 for each domain, with an additional point awarded for patients older than 70 years.12 Higher scores are associated with an increased risk of adverse outcomes. However, NRS-2002 requires effective patient communication and cognitive cooperation, making it less reliable in older adults with cognitive impairments, communication difficulties, or severe illness, which frequently coexist in multimorbid populations.
Bioelectrical impedance analysis (BIA) has emerged as a non-invasive, objective alternative for assessing the nutritional status of individuals. BIA evaluates body composition, cell membrane integrity, and hydration levels, with the phase angle (PhA) being one of its key parameters.14 PhA reflects cellular health and membrane integrity, and it has been linked to nutritional status and clinical outcomes across various patient populations.15–17 PhA is particularly sensitive to malnutrition among older adults because of aging-associated physiological changes such as sarcopenia, decreased cell mass, altered hydration status, and reduced cell membrane function. Studies have demonstrated the utility of PhA in assessing malnutrition and prognosis in conditions such as cancer,18,19 AIDS,20 cardiovascular diseases,15 renal failure,21 and liver cirrhosis.22 Recent studies and systematic reviews identified PhA as a sensitive and reliable biomarker for nutritional assessment, especially among older populations, because of its correlations with cell integrity and patients’ nutritional status. However, specific evidence in older multimorbid populations remains limited, underscoring the importance of this study. Additionally, there is currently no established PhA cutoff for identifying nutritional risk in this population. Moreover, existing research was limited by small sample sizes, homogeneous disease groups, or a lack of longitudinal data, highlighting the necessity of comprehensive studies that encompass broader, more representative older populations.
Therefore, this study aims to fill the existing knowledge gap by establishing an optimal PhA cutoff with direct clinical implications, facilitating early nutritional interventions and improving outcomes in older multimorbid patients. We hypothesized that PhA can serve as a reliable biomarker for assessing nutritional risk and predicting mortality in older patients with multimorbidity. To test this hypothesis, we analyzed the correlations between PhA and nutritional indicators and determined the optimal PhA cutoff using receiver operating characteristic (ROC) analysis, with NRS-2002 serving as the reference standard. Patients were stratified into high and low PhA groups based on the cutoff, and the prevalence of malnutrition risk and mortality was compared between these groups.
Materials and Methods
Patients
This retrospective study included consecutive hospitalized patients aged 65 years and older with multimorbidity (including, but not limited to, cardiovascular, respiratory, renal, endocrine, and neurological disorders), as documented in the patients’ medical records in the geriatric model wards of Beijing Geriatric Hospital from July 2022 to July 2023. This group is particularly vulnerable because of its high malnutrition risk and susceptibility to adverse clinical outcomes. The exclusion criteria, which aimed to eliminate factors potentially compromising the accuracy of BIA measurements, included skin injury at electrode contact sites, pacemaker or implanted cardioverter defibrillator placement, amputation, atypical body shapes, and ascites or visible edema. This study was approved by the Ethics Committee of Beijing Geriatric Hospital (approval number: BJLNYY-2022-014) and adhered to the principles outlined in the Declaration of Helsinki. All participants provided written informed consent.
Relationships of Clinical and Laboratory Parameters with Mortality
Clinical and laboratory data were extracted from electronic medical records. Parameters included sex, age, diagnosis, height, weight, NRS-2002 scores, and arm circumference. BMI was calculated as height squared (m2) divided by body weight (kg). The Modified Cumulative Illness Rating Scale-Geriatric (MCIRS-G) was used to assess comorbidities according to their diagnosis and severity.
Laboratory tests included measurements of lymphocytes, hemoglobin, prealbumin, total albumin, albumin, total cholesterol, and triglycerides. These tests were performed on the same day as BIA. Mortality was defined as death occurring within 6 months of admission or discharge.
Body Composition Assessment
Body composition was assessed using the InBody S10 device (Biospace, Seoul, South Korea) following standardized protocols. Measurements were conducted after patients fasted for at least 8 h and emptied their bladder, with activities such as bathing and exercise avoided within 3 h prior to assessment. Patients removed their shoes, socks, and metal accessories, laid flat for 10–30 min with their limbs slightly extended, and had intact skin at electrode contact sites cleaned with ethanol. Electrodes were placed on the wrists and the backs of the feet, and data were recorded after inputting demographic information. Parameters collected included total body water (TBW) and extracellular water (ECW), and the ratio of ECW to TBW was determined. PhA was calculated as arctan (reactance/resistance) × (180/π) based on measurements from the right arm, trunk, and right leg. All assessments were conducted by a trained physician. The InBody S10 was previously validated in older populations, demonstrating reliability and accuracy in assessing body composition in older patients with chronic conditions.
Statistical Analysis
Statistical analyses were performed using SPSS Statistics (version 25.0, IBM, Armonk, NY, USA). The Levene and Kolmogorov–Smirnov tests were employed to examine the normality of the data and homogeneity of variance. Continuous variables with normal distributions were expressed as the mean ± standard deviation (SD), and non-normally distributed data were presented as the median and interquartile range (IQR). Categorical variables were reported as numbers and percentages. Comparisons between two groups were conducted using the Mann–Whitney U-test or Student’s t-test depending on the data distribution. For multi-group comparisons, one-way ANOVA (continuous variables) or the chi-squared test (categorical variables) was employed. Pearson’s correlation coefficient was used to assess the relationships between PhA and other parameters. ROC curve analysis was performed to determine the optimal PhA cutoff for malnutrition risk, and the area under the curve (AUC) was used as a measure of predictive accuracy. The cutoff was defined as the value with the highest combined sensitivity and specificity. Statistical significance was set at P < 0.05.
Results
Comparison of PhA Across Demographic, Clinical, and Nutritional Parameters
In total, 104 patients were enrolled, including 57 women (54.8%) and 47 men (45.2%) with a mean age of 80.58 ± 5.97 years. The median PhA was 4.0° (IQR = 3.0, 4.9 Table 1). PhA did not significantly differ by sex (P > 0.05). However, age groups exhibited significant differences in PhA, with the oldest group exhibiting the lowest value (P < 0.001). Overall, 58.65% of the patients were at nutritional risk (NRS-2002 score ≥ 3), and these patients had significantly lower PhA than those at low nutritional risk (P < 0.001). Similarly, patients with higher MCIRS-G scores had lower PhA (P < 0.05). PhA was significantly lower among the 16 patients who died during the 6-month follow-up than among survivors (P < 0.001).
 |
Table 1 PhA Comparison by Sex, Age, MCIRS-G Scores, NRS-2002 Scores, and Clinical Outcomes |
Correlations Between PhA and Nutritional Markers
PhA was positively correlated with BMI (r = 0.207, P < 0.001), upper arm circumference (r = 0.182, P < 0.001), albumin levels (r = 0.135, P < 0.001), and triglyceride levels (r = 0.103, P < 0.001). Conversely, PhA was negatively correlated with the ECW/TBW ratio (r = −0.406, P < 0.001, Table 2). These findings suggest that lower PhA is associated with poor nutritional status and fluid imbalance.
 |
Table 2 Correlations Between PhA and Nutritional Indicators |
ROC Analysis of PhA for Malnutrition Risk
Using NRS-2002 as the standard, the AUC for PhA in predicting malnutrition risk was 0.732 (95% confidence interval [CI] = 0.632–0.832, P < 0.001, Figure 1). The optimal PhA cutoff for identifying malnutrition risk was 3.15° (AUC = 0.732, 95% CI = 0.632–0.832; Youden’s index = 0.41), which had 62% sensitivity and 79% specificity.
 |
Figure 1 The ROC curve of the phase angle for malnutrition risk in older patients with multiple diseases. Abbreviations: ROC, receiver operating characteristic; AUC, area under the ROC curve; CI, confidence interval. |
Malnutrition and Mortality by PhA Group
Patients were categorized into high and low PhA groups based on the cutoff of 3.15°. The proportion of patients at risk of malnutrition was significantly higher in the low PhA group (80.85%) than in the high PhA group (40.35%, P < 0.05, relative risk [RR] = 2.08, 95% CI = 1.42–2.83). Similarly, the mortality rate was markedly higher in the low PhA group (29.79%) than in the high PhA group (3.5%, P < 0.05, RR = 9.46, 95% CI = 4.2–20.9, Table 3).
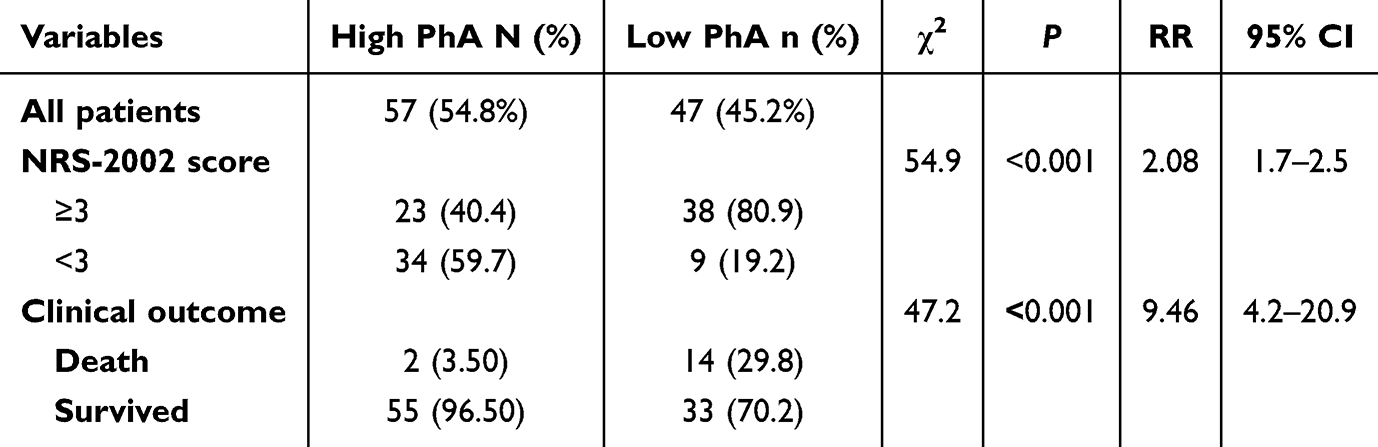 |
Table 3 Malnutrition and Mortality Rates in the Low and High PhA Groups Categorized by the Cutoff |
Discussion
This study demonstrated that PhA is a clinically valuable biomarker for assessing malnutrition risk and predicting 6-month mortality in older patients with multimorbidity. Our findings highlighted the associations of lower PhA with poor nutritional status, advanced age, higher MCIRS-G scores, elevated NRS-2002 scores, and increased mortality risk. These results reinforce the potential utility of PhA in routine clinical practice as a non-invasive, reliable tool for nutritional assessment and prognostication in this vulnerable population.
BIA assumes the body as a uniform cylinder with constant conductivity, and it measures PhA based on the resistance and reactance of an alternating current passing through the body.17 Resistance reflects extracellular fluid, whereas reactance is influenced by cell mass and membrane integrity. Thus, PhA serves as an integral indicator of tissue functionality and body composition.23 A low PhA indicates compromised cell membranes and impaired metabolic functions, whereas a high PhA suggests robust cellular health and higher body cell mass.24 In line with these principles, our study found that patients with advanced age, higher comorbidity scores, greater malnutrition risk, and increased mortality tended to have lower PhA. This is consistent with previous research illustrating that age, inflammation, and malnutrition negatively impact tissue electrical properties, resulting in reduced PhA.25–28
The determination of the PhA cutoff in this study was guided by sensitivity and specificity considerations, anchored to traditional nutritional screening tools. Our results demonstrated significant correlations between PhA and traditional nutritional markers, such as BMI, upper arm circumference, albumin, and triglycerides. Conversely, PhA had an inverse relationship with the ECW/TBW ratio, a marker of fluid imbalance and inflammation.29,30 These findings confirm that lower PhA is associated with poor nutritional status, hypoalbuminemia, and the presence of edema, underscoring its relevance as a nutritional biomarker.
Previous studies reported varying PhA cutoffs ranging from 4.03° to 6.0° depending on the demographic and clinical characteristics of the populations. Our lower PhA cutoff of 3.15° likely reflects our cohort’s older age, greater disease burden, and multimorbidity. This emphasizes the necessity for specific reference values tailored to older multimorbid populations.18,21,31–35 Kubo et al reported a cutoff of 4.03° for men and 3.65° for women in an older population,34 whereas Varan et al identified a threshold of 5.0° for hospitalized older male patients.35 The relatively lower PhA in our cohort might reflect the inclusion of older patients with multiple chronic conditions, further supporting the need for population-specific reference values.
In addition to predicting malnutrition, this study revealed the association between PhA and 6-month mortality. Lower PhA was significantly correlated with increased mortality risk, consistent with findings in other populations, including patients with cancer, chronic renal failure, heart failure, and cirrhosis.16,21,30,36,37 However, implementing PhA measurements in routine clinical practice might face challenges related to costs, training requirements, and device availability, especially in resource-limited healthcare settings. A prospective cohort study of 16,943 patients demonstrated that each 1° increase in PhA decreased mortality risk by 56%.17 These findings underscore the role of PhA as a prognostic marker in older patients with multimorbidity, in whom mortality risk is influenced by age, nutritional status, and disease burden.
This study carries both significance and limitations. Its significance lies in evaluating PhA as a simple, non-invasive tool for assessing malnutrition and predicting outcomes in older patients with multimorbidity, a population with limited research attention. Our findings suggest that PhA can complement traditional assessments, enabling a more holistic approach to nutritional and prognostic evaluations. However, the retrospective, single-center design and small sample size limit the generalizability of our results. Because of the retrospective nature of this study, we could not perform multivariate analysis to adjust for confounders, highlighting an important limitation and area for future research. Additionally, we did not establish sex-specific cutoffs, although no significant sex differences in PhA were observed in our analysis. Future prospective, multicenter studies with larger sample sizes are needed to validate these findings and establish standardized PhA reference values for older populations with multimorbidity. Furthermore, the follow-up duration of 6 months, though practical, might not have fully captured longer-term nutritional changes or outcomes, warranting studies with extended observation periods.
Conclusions
In conclusion, this study supports that PhA is a clinically valuable and accessible biomarker for identifying malnutrition risk and predicting short-term mortality in older adults with multimorbidity, allowing for timely interventions. Utilizing PhA measurements may facilitate targeted nutritional interventions, such as individualized dietary strategies and early nutritional support, potentially improving clinical outcomes and patient quality of life. However, due to the retrospective design, causality cannot be established, and generalizability is limited. Prospective, multicenter studies are therefore warranted to confirm these findings, clarify causal relationships, and broaden their clinical applicability across diverse patient populations.
Data Sharing Statement
The datasets and analyzed during the current study are available from the corresponding author on reasonable request.
Ethics Approval
This study was approved by the Ethics Committee of Beijing Geriatric Hospital (approval number: BJLNYY-2022-014) and adhered to the principles outlined in the Declaration of Helsinki. Written informed consent was obtained from all individual participants included in the study.
Author Contributions
All authors made a significant contribution to the work reported, including study conception; study design; execution; and data acquisition, analysis, and interpretation; as well as drafting, revising, or critically reviewing the article. All authors provided final approval of the version to be published; agreed to the submission of this article to this journal; and agreed to be accountable for all aspects of the work.
Funding
There is no funding to report.
Disclosure
The authors declare that they have no competing interests in this work.
References
1. King DE, Xiang J, Pilkerton CS. Multimorbidity trends in United States adults, 1988-2014. J Am Board Fam Med. 2018;31:503–513. doi:10.3122/jabfm.2018.04.180008
2. Zou S, Wang Z, Bhura M, Zhang G, Tang K. Prevalence and associated socioeconomic factors of multimorbidity in 10 regions of China: an analysis of 0.5 million adults. J Public Health. 2022;44:36–50. doi:10.1093/pubmed/fdaa204
3. Dou LY, Huang J, Zhang ZX, Ye S, Zhang MK. Recent advances in treatment burden of multimorbidity in elderly patients. Chin Gen Pract. 2020;23:874–879. doi:10.12114/j.issn.1007-9572.2019.00.621
4. Majumdar UB, Hunt C, Doupe P, et al. Multiple chronic conditions at a major urban health system: a retrospective cross-sectional analysis of frequencies, costs and comorbidity patterns. BMJ Open. 2019;9:e029340. doi:10.1136/bmjopen-2019-029340
5. Aotani N, Yasui-Yamada S, Kagiya N, et al. Malnutrition by European society for clinical nutrition and metabolism criteria predicts prognosis in patients with gastrointestinal and hepatobiliary-pancreatic cancer. Clin Nutr ESPEN. 2021;42:265–271. doi:10.1016/j.clnesp.2021.01.023
6. Eraslan Doganay G, Cirik MO. Determinants of prognosis in geriatric patients followed in respiratory ICU; either infection or malnutrition. Medicine. 2021;100:e27159. doi:10.1097/md.0000000000027159
7. Qin H, Wang A, Zuo Y, et al. Malnutrition could predict 3-month functional prognosis in mild stroke patients: findings from a nationwide stroke registry. Curr Neurovasc Res. 2021;18:489–496. doi:10.2174/1567202619666211217130221
8. Gomes F, Baumgartner A, Bounoure L, et al. Association of nutritional support with clinical outcomes among medical inpatients who are malnourished or at nutritional risk: an updated systematic review and meta-analysis. JAMA Network Open. 2019;2:e1915138. doi:10.1001/jamanetworkopen.2019.15138
9. Schuetz P, Fehr R, Baechli V, et al. Individualised nutritional support in medical inpatients at nutritional risk: a randomised clinical trial. Lancet. 2019;393:2312–2321. doi:10.1016/s0140-6736(18)32776-4
10. Serón-Arbeloa C, Labarta-Monzón L, Puzo-Foncillas J, et al. Malnutrition screening and assessment. Nutrients. 2022;14(12):2392. doi:10.3390/nu14122392
11. Hersberger L, Bargetzi A, Bargetzi L, et al. Nutritional risk screening (NRS 2002) is a strong and modifiable predictor risk score for short-term and long-term clinical outcomes: secondary analysis of a prospective randomised trial. Clin Nutr. 2020;39:2720–2729. doi:10.1016/j.clnu.2019.11.041
12. Dent E, Hoogendijk EO, Visvanathan R, Wright ORL. Malnutrition screening and assessment in hospitalised older people: a review. J Nutr Health Aging. 2019;23:431–441. doi:10.1007/s12603-019-1176-z
13. Corish CA, Bardon LA. Malnutrition in older adults: screening and determinants. Proc Nutr Soc. 2019;78:372–379. doi:10.1017/s0029665118002628
14. Yamada Y, Yoshida T, Murakami H, et al. Phase angle obtained via bioelectrical impedance analysis and objectively measured physical activity or exercise habits. Sci Rep. 2022;12:17274. doi:10.1038/s41598-022-21095-6
15. Hirose S, Nakajima T, Nozawa N, et al. Phase angle as an indicator of sarcopenia, malnutrition, and cachexia in inpatients with cardiovascular diseases. J Clin Med. 2020;9(8):2554. doi:10.3390/jcm9082554
16. Zhang X, Zhao W, Du Y, et al. A simple assessment model based on phase angle for malnutrition and prognosis in hospitalized cancer patients. Clin Nutr. 2022;41:1320–1327. doi:10.1016/j.clnu.2022.04.018
17. Plauth M, Sulz I, Viertel M, et al. Phase angle is a stronger predictor of hospital outcome than subjective global assessment-results from the prospective Dessau hospital malnutrition study. Nutrients. 2022;14:1780. doi:10.3390/nu14091780
18. Zhou S, Yu Z, Shi X, Zhao H, Dai M, Chen W. The relationship between phase angle, nutrition status, and complications in patients with pancreatic head cancer. Int J Environ Res Public Health. 2022;19. doi:10.3390/ijerph19116426.
19. Conde Frio C, Härter J, Santos LP, Orlandi SP, Gonzalez MC. Phase angle, physical quality of life and functionality in cancer patients undergoing chemotherapy. Clin Nutr ESPEN. 2023;57:331–336. doi:10.1016/j.clnesp.2023.07.017
20. Osuna-Padilla IA, Salazar Arenas MLA, Rodríguez-Moguel NC, Aguilar-Vargas A, Montano Rivas JA, Ávila-Ríos S. Phase angle as predictor of malnutrition in people living with HIV/AIDS. Nutr Clin Pract. 2022;37:146–152. doi:10.1002/ncp.10744
21. Karavetian M, Salhab N, Rizk R, Poulia KA. Malnutrition-inflammation score VS phase angle in the era of GLIM criteria: a cross-sectional study among hemodialysis patients in UAE. Nutrients. 2019;12:11. doi:10.3390/nu11112771
22. Ruiz-Margáin A, Macías-Rodríguez RU, Duarte-Rojo A, Ríos-Torres SL, Espinosa-Cuevas Á, Torre A. Malnutrition assessed through phase angle and its relation to prognosis in patients with compensated liver cirrhosis: a prospective cohort study. Dig Liver Dis. 2015;47:309–314. doi:10.1016/j.dld.2014.12.015
23. Duarte Martins A, Paulo Brito J, Batalha N, Oliveira R, Parraca JA, Fernandes O. Phase angle as a key marker of muscular and bone quality in community-dwelling independent older adults: a cross-sectional exploratory pilot study. Heliyon. 2023;9:e17593. doi:10.1016/j.heliyon.2023.e17593
24. Sardinha LB, Rosa GB. Phase angle, muscle tissue, and resistance training. Rev Endocr Metab Disord. 2023;24:393–414. doi:10.1007/s11154-023-09791-8
25. Mendoza-Martínez VM, Baños-Vázquez R, Melendez-Mier G, et al. Phase angle (PhA) is an easy and complementary tool for assessing nutritional status in ulcerative colitis (UC) patients: a cross-sectional study. Life. 2024;14(11):1511. doi:10.3390/life14111511
26. da Silva BR, Orsso CE, Gonzalez MC, et al. Phase angle and cellular health: inflammation and oxidative damage. Rev Endocr Metab Disord. 2023;24:543–562. doi:10.1007/s11154-022-09775-0
27. Cioffi I, Marra M, Imperatore N, et al. Assessment of bioelectrical phase angle as a predictor of nutritional status in patients with Crohn’s disease: a cross sectional study. Clin Nutr. 2020;39:1564–1571. doi:10.1016/j.clnu.2019.06.023
28. Cioffi I, Scialò F, Di Vincenzo O, et al. Serum interleukin 6, controlling nutritional status (CONUT) score and phase angle in patients with crohn’s disease. Nutrients. 2023;15(8):1953. doi:10.3390/nu15081953
29. Lee Y, Kwon O, Shin CS, Lee SM. Use of bioelectrical impedance analysis for the assessment of nutritional status in critically ill patients. Clin Nutr Res. 2015;4:32–40. doi:10.7762/cnr.2015.4.1.32
30. de Almeida C, Penna PM, Pereira SS, Rosa COB, Franceschini S. Relationship between phase angle and objective and subjective indicators of nutritional status in cancer patients: a systematic review. Nutr Cancer. 2021;73:2201–2210. doi:10.1080/01635581.2020.1850815
31. Małecka-Massalska T, Mlak R, Smolen A, Morshed K. Bioelectrical impedance phase angle and subjective global assessment in detecting malnutrition among newly diagnosed head and neck cancer patients. Eur Arch Otorhinolaryngol. 2016;273:1299–1305. doi:10.1007/s00405-015-3626-5
32. Fernández-Jiménez R, Dalla-Rovere L, García-Olivares M, et al. Phase angle and handgrip strength as a predictor of disease-related malnutrition in admitted patients: 12-month mortality. Nutrients. 2022;14(9):1851. doi:10.3390/nu14091851
33. Kubo Y, Noritake K, Nakashima D, Fujii K, Yamada K. Relationship between nutritional status and phase angle as a noninvasive method to predict malnutrition by sex in older inpatients. Nagoya J Med Sci. 2021;83:31–40. doi:10.18999/nagjms.83.1.31
34. Varan HD, Bolayir B, Kara O, et al. Phase angle assessment by bioelectrical impedance analysis and its predictive value for malnutrition risk in hospitalized geriatric patients. Aging Clin Exp Res. 2016;28:1121–1126. doi:10.1007/s40520-015-0528-8
35. Ringaitiene D, Gineityte D, Vicka V, et al. Malnutrition assessed by phase angle determines outcomes in low-risk cardiac surgery patients. Clin Nutr. 2016;35:1328–1332. doi:10.1016/j.clnu.2016.02.010
36. Grundmann O, Yoon SL, Williams JJ. The value of bioelectrical impedance analysis and phase angle in the evaluation of malnutrition and quality of life in cancer patients--a comprehensive review. Eur J Clin Nutr. 2015;69:1290–1297. doi:10.1038/ejcn.2015.126
37. Ruiz-Margáin A, Xie JJ, Román-Calleja BM, et al. Phase angle from bioelectrical impedance for the assessment of sarcopenia in cirrhosis with or without ascites. Clin Gastroenterol Hepatol. 2021;19:1941–1949.e1942. doi:10.1016/j.cgh.2020.08.066
 © 2025 The Author(s). This work is published and licensed by Dove Medical Press Limited. The
full terms of this license are available at https://www.dovepress.com/terms.php
and incorporate the Creative Commons Attribution
- Non Commercial (unported, 4.0) License.
By accessing the work you hereby accept the Terms. Non-commercial uses of the work are permitted
without any further permission from Dove Medical Press Limited, provided the work is properly
attributed. For permission for commercial use of this work, please see paragraphs 4.2 and 5 of our Terms.
© 2025 The Author(s). This work is published and licensed by Dove Medical Press Limited. The
full terms of this license are available at https://www.dovepress.com/terms.php
and incorporate the Creative Commons Attribution
- Non Commercial (unported, 4.0) License.
By accessing the work you hereby accept the Terms. Non-commercial uses of the work are permitted
without any further permission from Dove Medical Press Limited, provided the work is properly
attributed. For permission for commercial use of this work, please see paragraphs 4.2 and 5 of our Terms.
Recommended articles
Does Control Nutritional Status (CONUT) Score Predict Early and Long-Term Mortality at the Initiation of Maintenance Hemodialysis?
Selen T, Ulusal Okyay G, Ayerden Ebinç F, Merhametsiz Ö, Şahin H, Aylı MD
International Journal of General Medicine 2025, 18:3775-3786
Published Date: 7 July 2025